Week 11: FSAE Car Project
Aim:
Simulate the flow over an FSAE car model with all the preprocessing (geometry cleanup, boundary flagging, generating the virtual wind tunnel) steps, setting up the simulation cases for the straight and "lot of turns" track and post-processing the simulation results using CONVERGE and Paraview.
Objectives:
- Provide basic introduction to the theory of downforce
- Summarise the basic pre-processing steps for cleaning and flagging the geometry
- Setup the simulation cases for the straight and "lot of turns" tracks
- Post-Process the simulation results and derive the conclusions
Theory:
Downforce is a downward lift force created by the aerodynamic features of a vehicle. If the vehicle is a car, the puprose of the down force is to allow the car to travel faster by increasing the vertical force on the tires, thus creating more grip. If the vehicle is a fixed-wing aircraft, the purpose of the downforce on the horizontal stabilizer is to maintain longitudinal stability and allow the pilot to control the aircraft in pitch.
Pre-processing the Geometry:
After uploading the geometry in Converge Studio, we remove the overlapping edges and non-manifold edges using the geometry editing tools and assign the entire car to a single boundary.
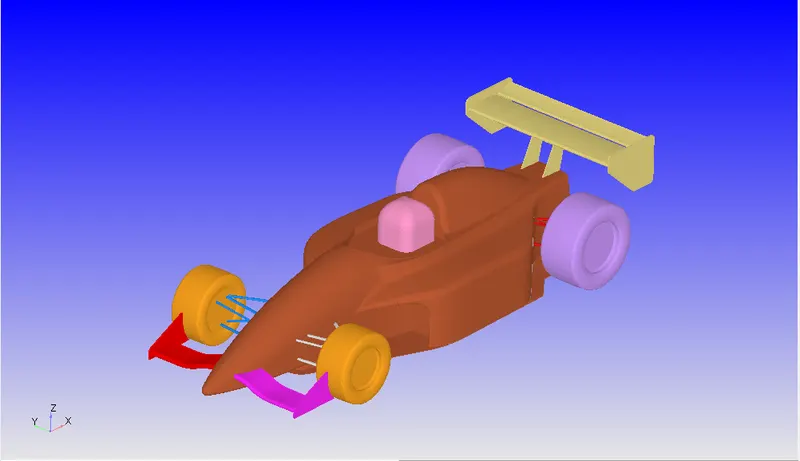
To seperate the different parts of the geometry for flagging them as separate boundaries, we use the in-built tool of boundary fencing. The following image shows the properly flagged FSAE car using the above methods.
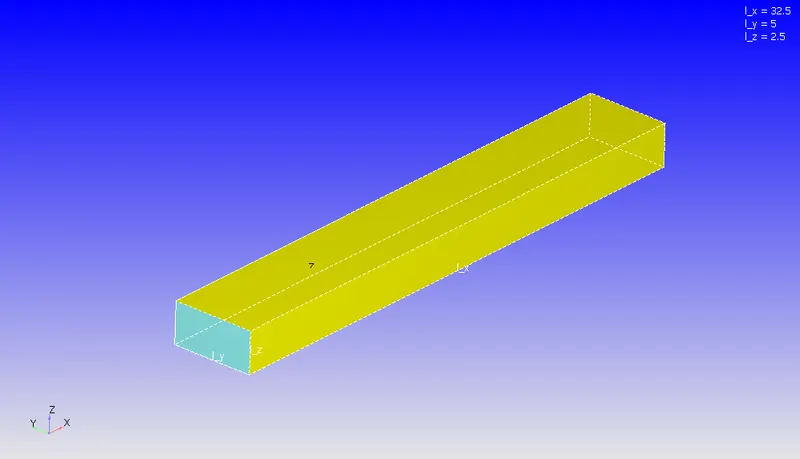
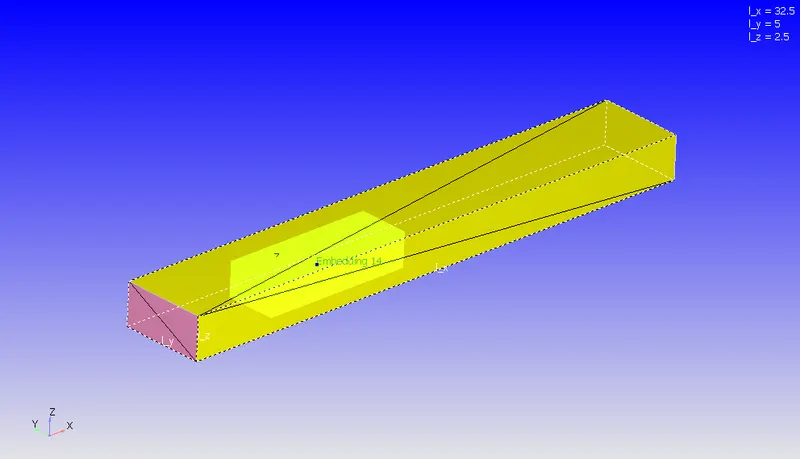
After completing this step, to perform the external flow simulation we generate a virtual wind tunnel which is 3x length in the upstream direction and 10x length in the downstream direction. The spanwise and lateral length are kept equal to that of the length of the car. The bottom wall has to be designed with sufficient care such that there are no intersection errors between it and the wheels of the car. The final computational domain for the problem looks as follows
Simulation Case Setup:
The case setup for both cases of the current study is carried out using the CONVERGE Studio Case Setup GUI. The following settings have been chosen for the simulation in the respective subtree
- Application subtree:
- Due to the relatively simple nature of the model, the Time based application was selected.
- Materials subtree:
- Predefined mixture of standard air with gas simulation default settings was used.
- The global transport parameters were set to default values.
- The standard air consists of oxygen and nitrogen species which are assumed to be non-reacting mixtures.
- Simulation parameters subtree:
- Fully compressible transient simulation with full hydrodynamic capacity is used for the simulation.
- Using the velocity of 20.83 m/s for straight track and 12.5 m/s for the curved track at the inlet. The streamwise length of the domain of 32.5m, we can calculated the flow through time as 1.5 sec and 2.6 sec respectively. We assume that we reach fully developed conditions at the end of the first cycle, so we decide the end time of the simulation as 1.5 and 2.6 seconds respectively.
- The initial time step is set to 1e-9 which is also the minimum time step for the simulation. The maximum time step is set to 1 second. The CFL criteria for the convection is set to 1 and for diffusion is set as 2. The variable time-step algorithm is used for the time stepping in the problem.
- A standard density based PISO algorithm was chosen as the Navier-Stokes equation solver with default settings
- Boundary Conditions subtree:
- Inlet: Pressure = Zero Normal Gradient , Velocity = 20.83 / 12.5 m/s in the x-direction, Temperature = Fixed value of 300K, Species = Standard Air, Turbulent kinetic energy and turbulent frequency = default values
- Outlet: Pressure = Static pressure of 101325 Pa (1 bar), Velocity = Zero Normal Gradient, Temperature = Backflow value of 300K, Species = Backflow value of Standard Air, Turbulent kinetic energy and turbulent frequency = default values
- (All boundaries of the FSAE car): Pressure = zero normal gradient, Velocity = Law of the Wall (stationary), Temperature = Law of the wall with wall temperature as 300K, Turbulent kinetic energy = zero normal gradient and turbulent frequency= Wall model
- Top and Side Walls: Symmetry
- No Slip Bottom Wall: Pressure = zero normal gradient, Velocity = Law of the Wall (stationary), Temperature = Law of the wall with wall temperature as 300K, Turbulent kinetic energy = zero normal gradient and turbulent frequency= Wall model
- Initial Conditions subtree:
- Fluid domain is initialized by filling it standard Air with velocity equal to inlet velocity, temperature of 300K and pressure set at 101325 Pa.
- Physical Models subtree:
- For the current simulation, k-`omega` SST turbulence models with automatic wall functions is used for the calculation of lift and drag forces.
- Grid Control subtree:
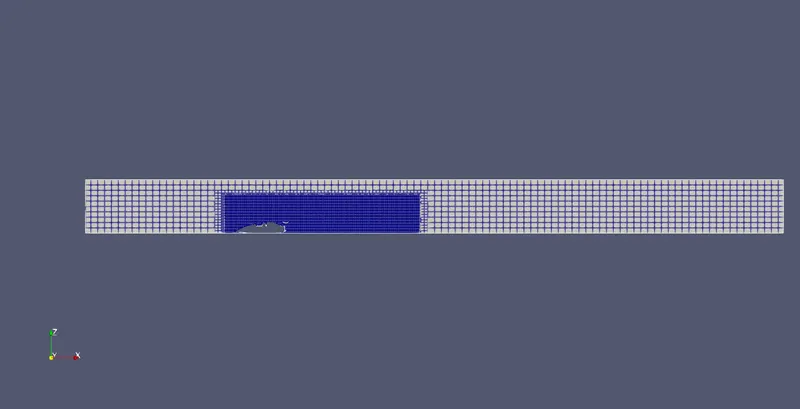
- The base grid settings for cell dimension is set to 0.075 m in all directions.
- A fixed embedding is provided in a box around the FSAE car for finer resolution of the flow physics in the front and rear of the body.
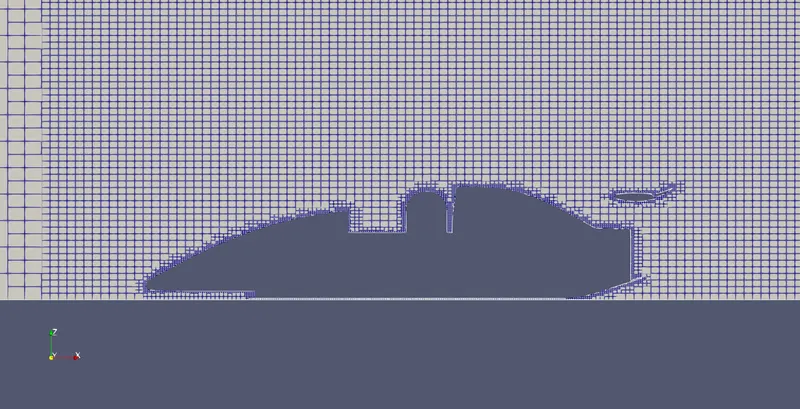
- Permanent boundary embeddings of scale 3 and number of layers as 6 on the surface of the FSAE body to accurately capture the flow seperation.
- Output subtree:
- To calculate the forces in the principal directions on the FSAE body, we switch on the wall output to boundaries only.
- To see whether the boundary layers are resolved, we switch on the post processing of the y+ values.
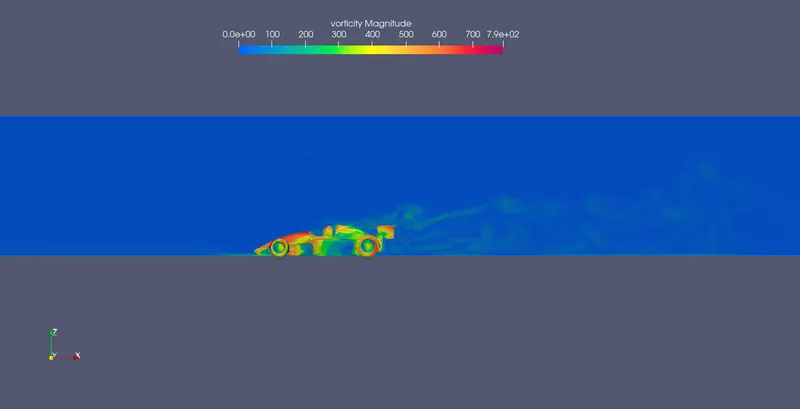
- The vortex generation is observed by enabling the vortex post-processing.
Simulation Results:
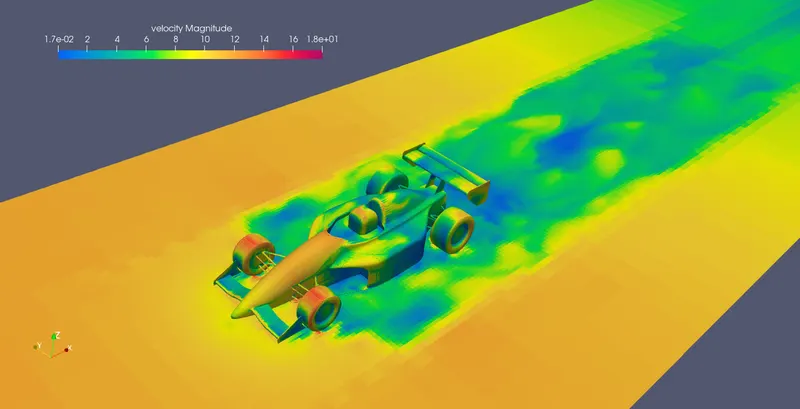
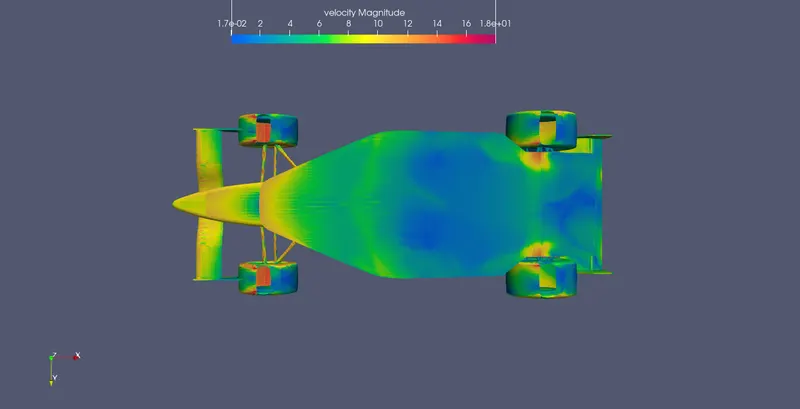
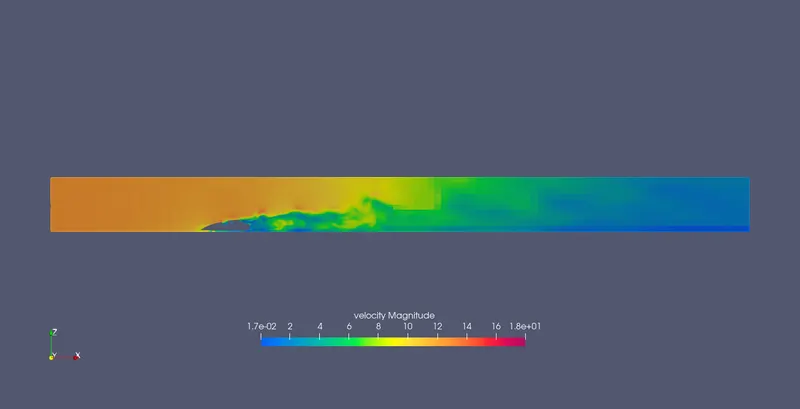
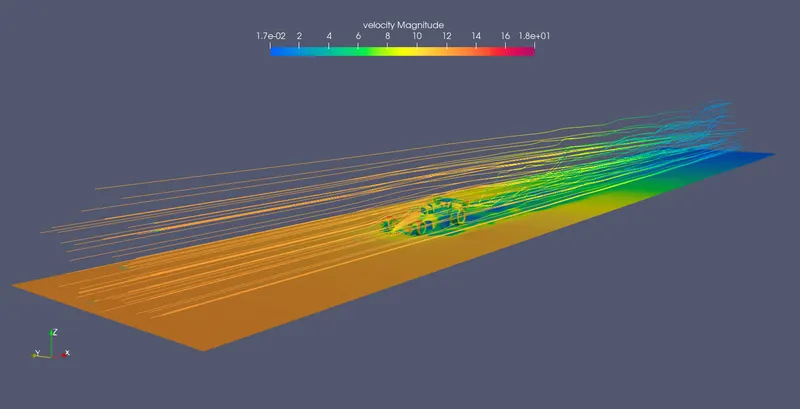
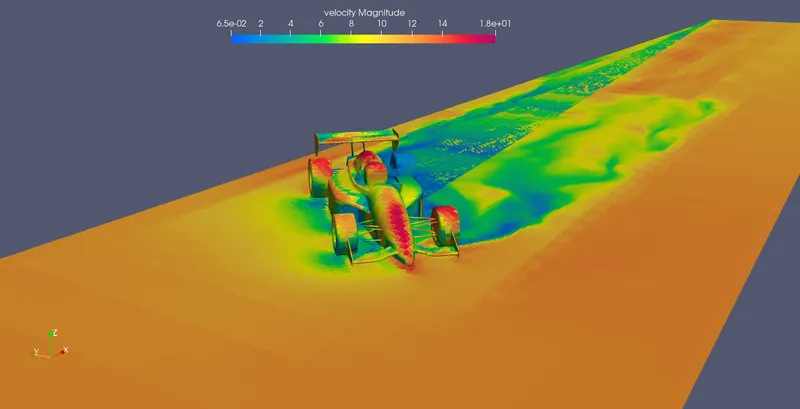
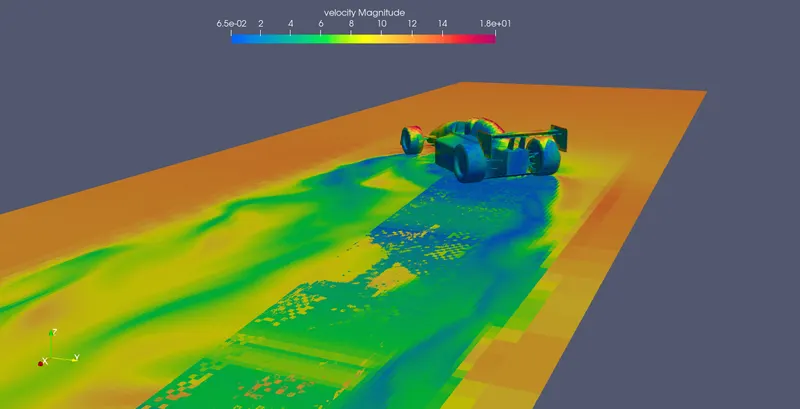
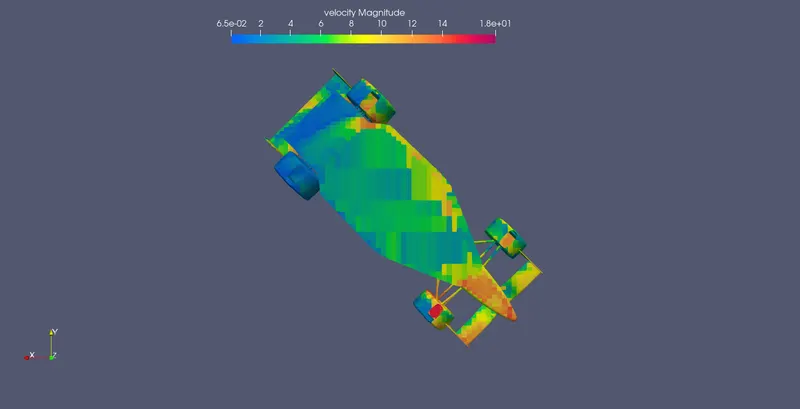
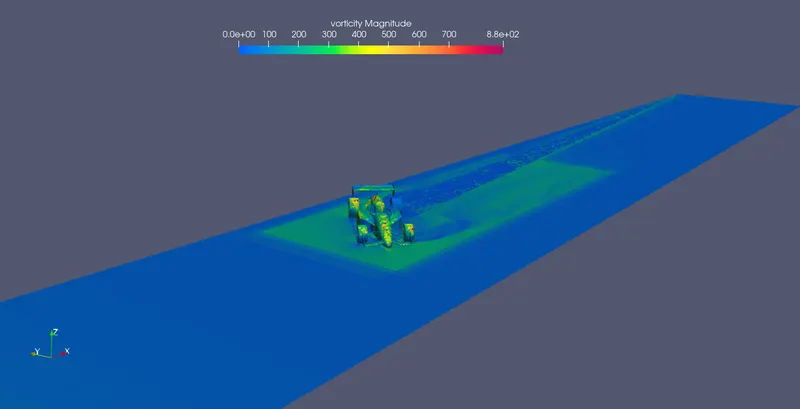
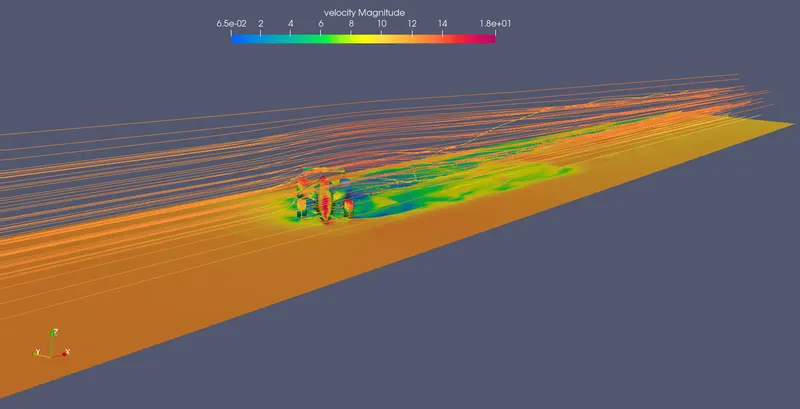
The results of the simulation for the current study are presented in the form of contour plots of velocity, vorticity and streamlines. To quantify the effects lift and drag forces on each component of the car, we provide the line plots of the lift and drag forces with time for all the components of the cars. This information will aid us in determing the performance of the car and ideas where it can be improved. We will first provide the straight track results and then follow by providing curved track.
Straight Track
Mesh:
Mesh Closeup:
Velocity contours:
Vorticity contour:
Streamline contour:
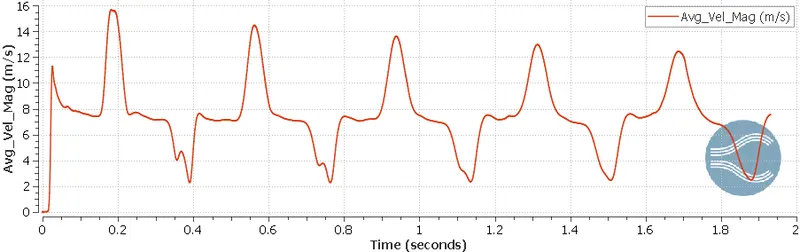
Line Plot of average velocity on the body:
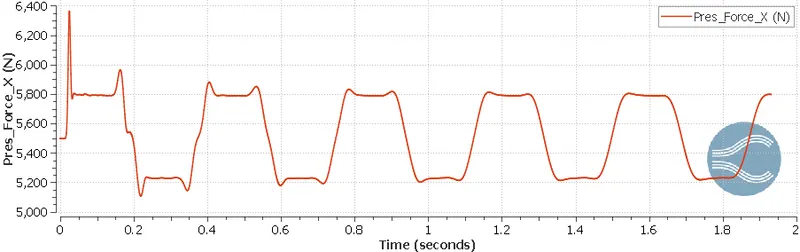
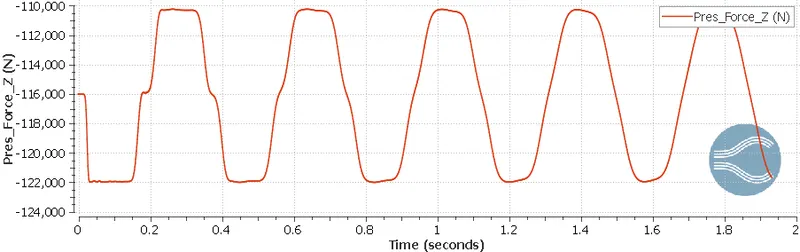
Line plots of Drag and Lift Forces
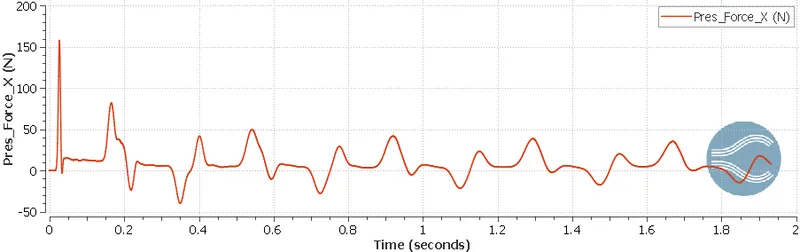
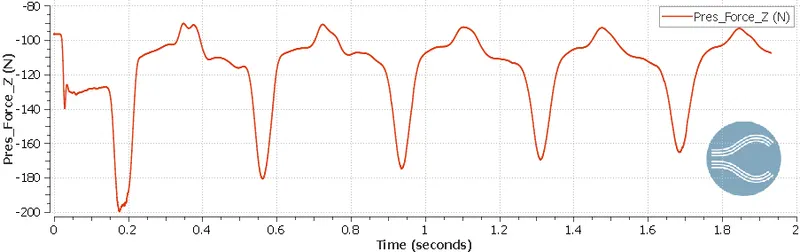
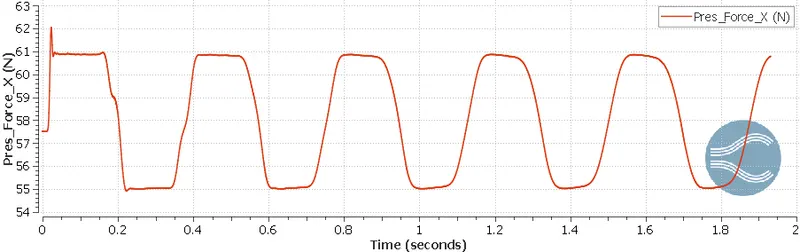
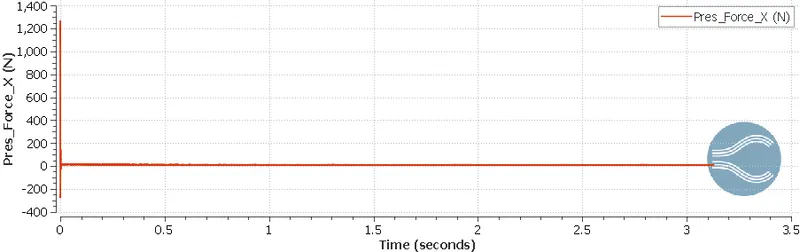
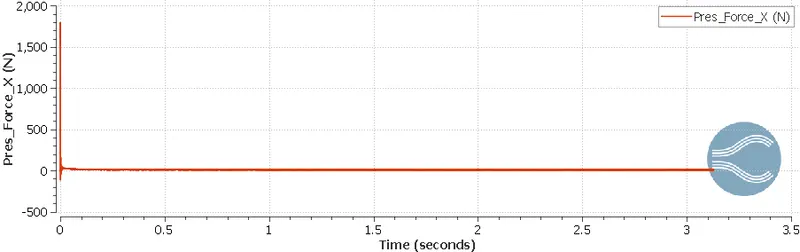
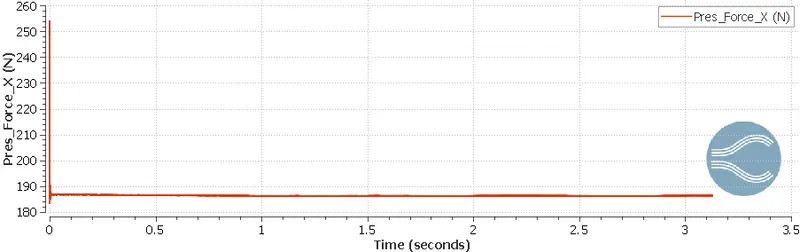
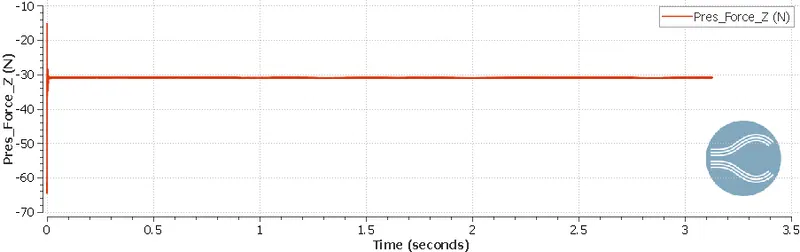
In the current study, the force in the principal x-direction is Drag Force and the force in the z-direction is Lift force
Drag and Lift Forces on the "body" boundary:
Drag and Lift Forces on the "Front wheels" boundary:
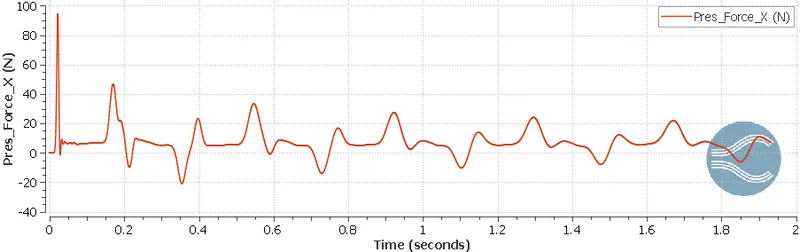
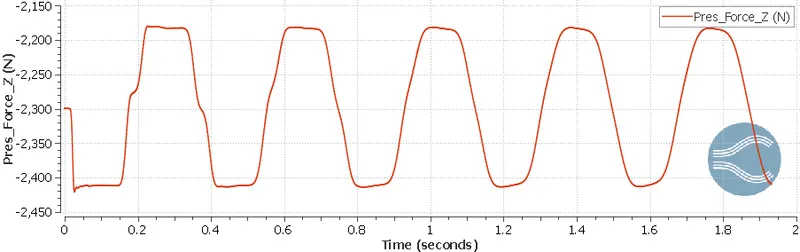
Drag and Lift Forces on the "Rear wheels" boundary:
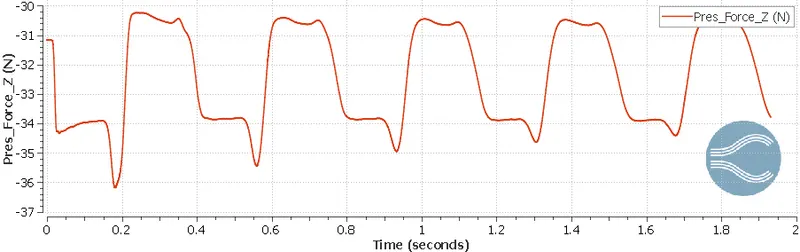
Drag and Lift Forces on the "Rear wing" boundary:
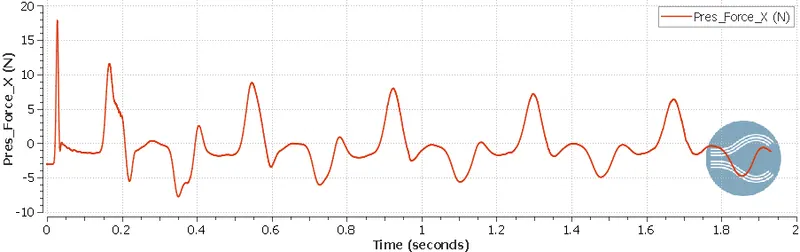
Drag and Lift Forces on the "underbody" boundary:
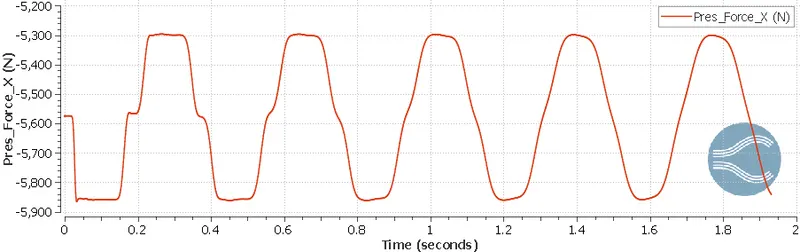
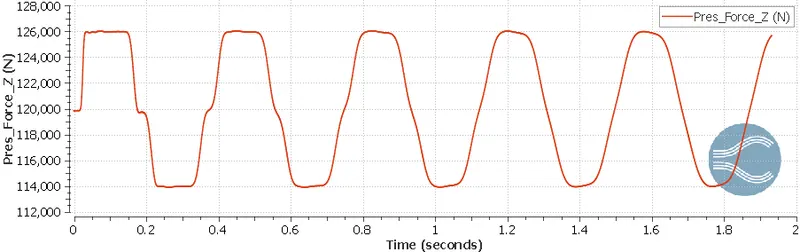
Drag and Lift Forces on the "front wings" boundary:
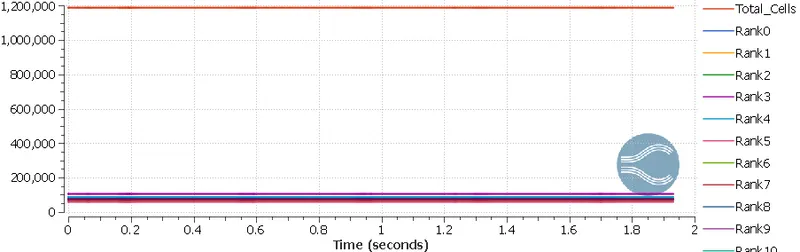
Cell count with division to different processors:
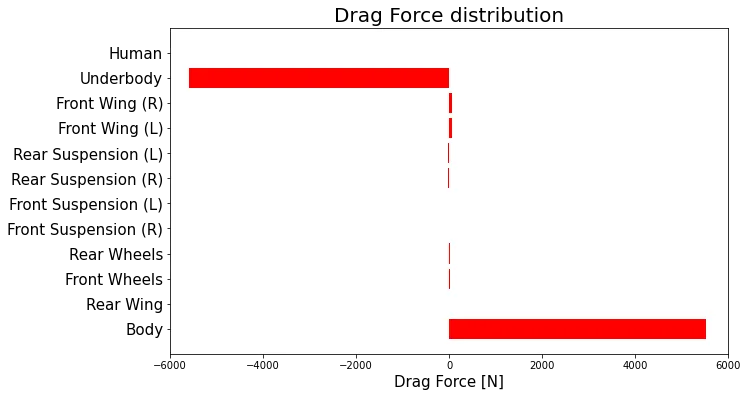
Average Drag Force on different parts of the FSAE car components
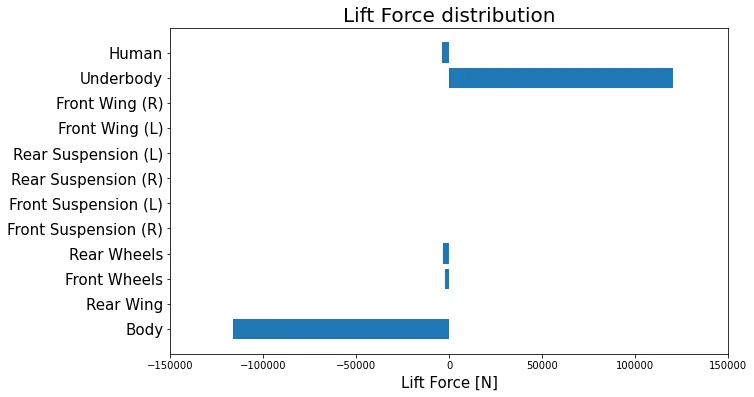
Average Lift Force on different parts of the FSAE car components
Lots of Curve Track
Computational Domain:
Velocity contours:
Vorticity contour:
Streamlines contour:
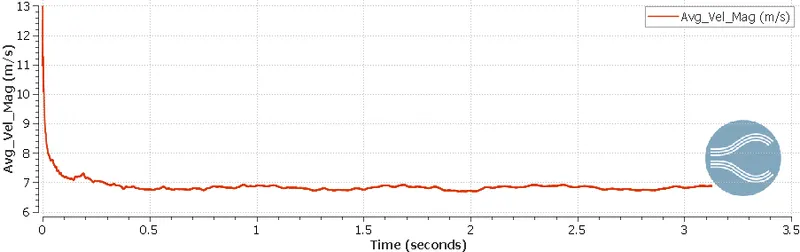
Line Plot of average velocity on the body:
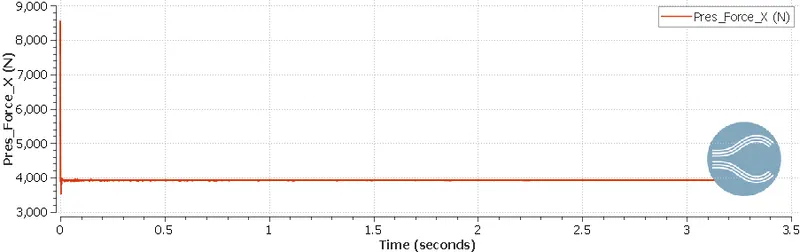
Line plots of Drag and Lift Forces
In the current study, the force in the principal x-direction is Drag Force and the force in the z-direction is Lift force
Drag and Lift Forces on the "body" boundary:
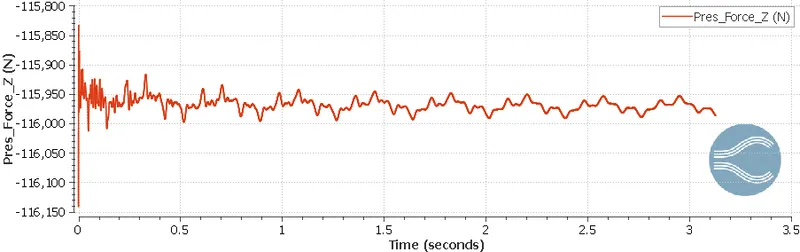
Drag and Lift Forces on the "Front wheels" boundary:
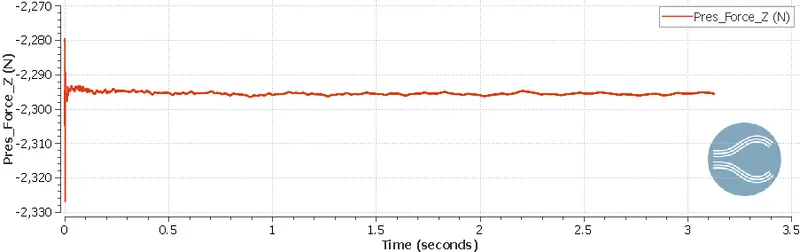
Drag and Lift Forces on the "Rear wheels" boundary:
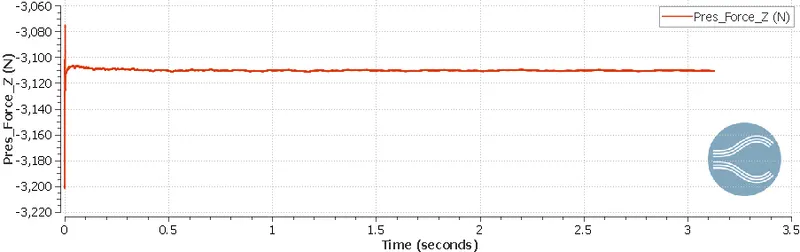
Drag and Lift Forces on the "Rear wing" boundary:
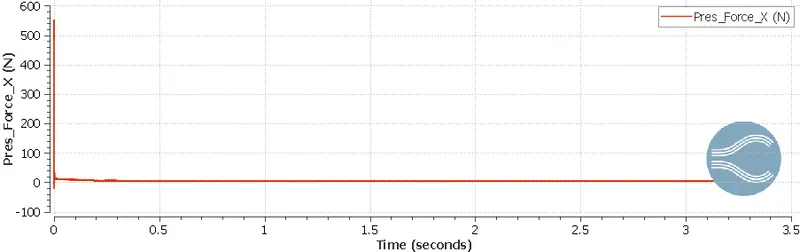
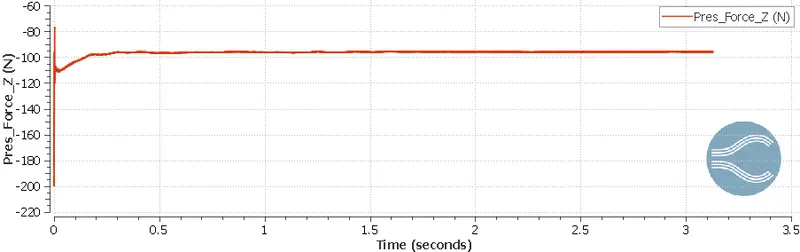
Drag and Lift Forces on the "front wings right" boundary:
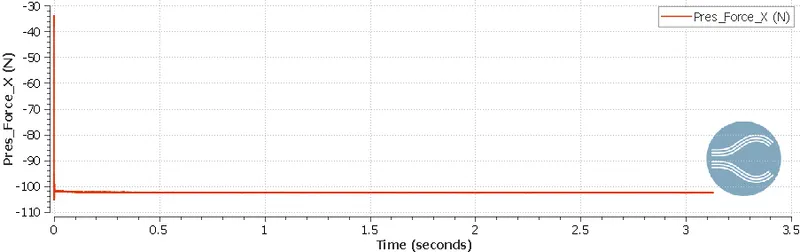
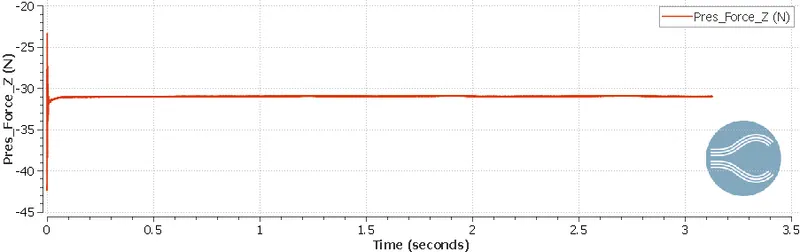
Drag and Lift Forces on the "front wings left" boundary:
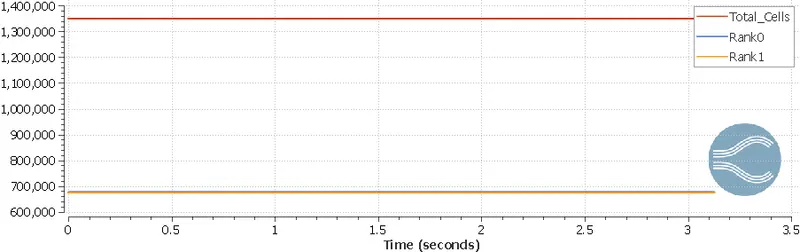
Cell count with division to different processors:
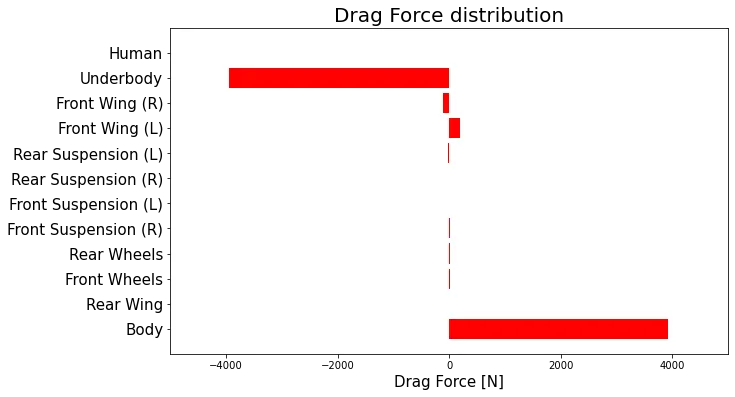
Average Drag Force on different parts of the FSAE car components
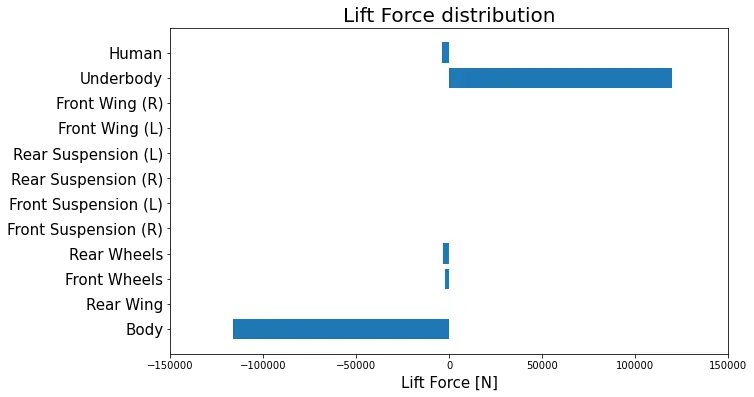
Average Lift Force on different parts of the FSAE car components
Conclusions:
From the CFD analysis, we can conclude the following statements:
- The wheels contribute to the overall drag of the FSAE car for both tracks. The aerodynmaic efficiency of the automobile can be increased by covering the wheels.
- The front wings do not have a significant contribution in the downforce in all tracks, as a result it is recommended to be redesigned.
- The load on the tires is increased in the Lots of turn track due to the turning and high-velocity region in the nose and the air ducts.
- The flow over the wheels has high velocity because of the front wings which has higher pressure at the top and lower pressure at the bottom. Although this should lead to prevention of the vorticies but they are observed for the current study. Hence, it is recommended that the front wings should be redesigned.
- The rear wing can be inproved by increasing the airfoil thickness and also increase the height of endplate.