Week-11 Challenge: Braking
1. AIM
- Calculate the energy required for braking for a defined driving cycle.
- Understanding why electric motor can’t develop braking torque at high speed similar to starting.
- Make a MATLAB program that plots the contour of given motor speed, torque, and efficiency values.
2. OBJECTIVE
- To calculate the energy required for braking for a defined driving cycle.
- To understand why electric motor can’t develop braking torque at high speed similar to starting.
- To make a MATLAB program that plots the contour of given motor speed, torque, and efficiency values.
3. METHOD
3.1 Calculate the energy required for braking for a defined driving cycle.
The Braking distance increases four times each time the starting speed doubles. This is because the work done in bringing a car to rest means removing all of its kinetic energy.
Kinetic energy is the force that keeps the vehicle moving. This energy is provided by the engine in order to accelerate the vehicle from a standstill to the desired speed. Kinetic energy is dissipated as heat by the brakes during the application of breaks.
Work done(Brake Energy) = kinetic energy = `1/2 mV^2`
where,
m = Mass of vehicle
V = Velocity difference (V_final - V_initial)
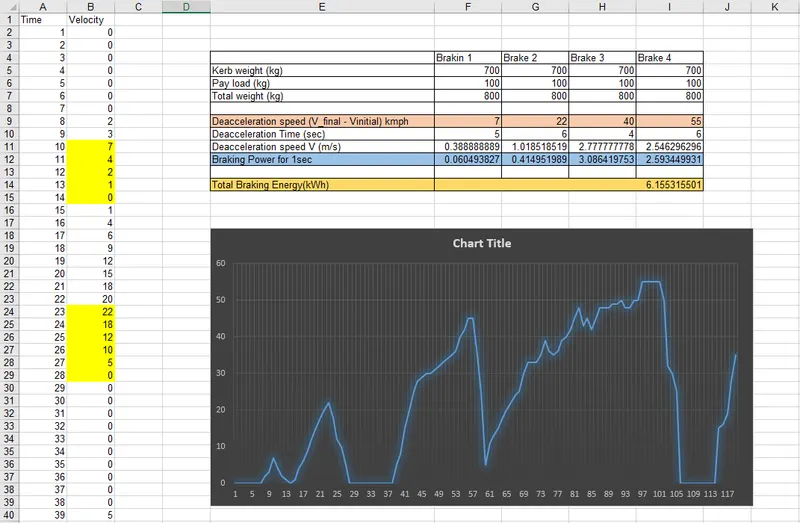 |
we define a drive cycle for 120 secs.
we take the total weight of the vehicle as 800 kgs
we have 4 cases in the drive cycle where the vehicle brakes.
we calculate V in m/s by multiplying it by 5/18.
|
First instance |
Velocity = 7 to 0 kmph V = `7-0=7` in 5 sec = 0.388 m/s |
BE1 = `1/2xx(800xx0.388)/1000=0.0605` |
|
Second instance |
Velocity = 22 to 0 kmph V = `22-0=22` in 6 sec = 1.019 m/s |
BE2 = `1/2xx(800xx1.019)/1000=0.415` |
|
Third instance |
Velocity = 45 to 5 kmph V = `45-5=40` in 4 sec = 2.778 m/s |
BE3 = `1/2xx(800xx2.77)/1000=3.087` |
|
Fourth instance |
Velocity = 55 to 0 kmph V = `55-0=55` in 6 sec = 2.55 m/s |
BE4 = `1/2xx(800xx2.55)/1000=2.56` |
Total Brake Power = Sum of all Brake Powers
BE = `0.0605+0.415+3.087+2.56=6.1225`
Hence, The Energy required for Braking is 6.1225 kWh.
The above excel file is attached below.
3.2 Why electric motor can’t develop braking torque at high speed similar to starting? How electric and mechanical brakes are coordinated?
Braking is achieved by using a Mechanical brake or Regenerative Brake.
In DC motors when the load on the motor is constant, speed is proportional to supply voltage. And when the supply voltage is constant, speed is inversely proportional to the load on the motor.
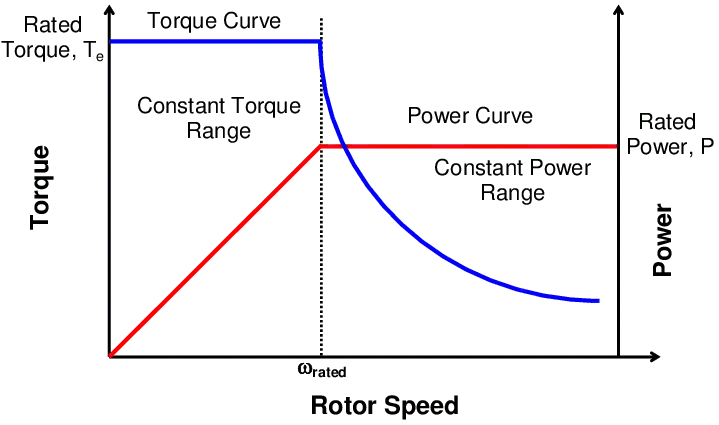 |
| FIG. MOTOR TORQUE-SPEED CURVE |
In the constant torque region higher acceleration is possible and then the vehicle reaches the point of constant power. When it comes to braking, where the torque is negative, the braking torque required goes down as the vehicle is in the constant power region lower than the torque which was required during acceleration. So while braking the peak torque is less than the torque required during acceleration.
Therefore peak acceleration and peak deceleration torque are not the same.
Braking control
- Usually, Front-wheel drives have a higher Braking force hence it is advisable for the front braking to not be increased.
- Braking should be distributed in both and rear wheel independently, so the direction of driving will not be sacrificed for the safety of the vehicle.
- Braking is achieved by using a Mechanical brake or Regenerative Brake.
- In practice, if the Regenerative braking power requirement is more than the charging limit of the battery or more than the regenerative capacity of the machine then the combination of both mechanical brake & Regenerative Brake is applicable.
- As the acceleration torque is higher than deceleration torque, only electric braking is not sufficient to stop the vehicle. Also while reducing the speed, the speed is not directly reduced, as a process, the regeneration takes place, where the curve enters into the 2nd quadrant and again enters to 3rd to a reduced speed.
- In practice, the same motor cannot produce the same braking power, which means if the motor accelerates to 100kmph in 10 seconds, it cannot give the equal Torque as acceleration in deacceleration. TBraking < TAcceleration
Limitations
- The battery charge rate is lower as compared to the peak discharge rate.
- Power converter limitations while reverse power flow.
Braking control strategies
1. Series Braking (one after another)
In the case of the series brake, we apply a Mechanical brake and Regenerative brake in series one after the other i.e applying one brake at a time.
2. Parallel Brake (Both at a time)
In the case of the parallel brake, we apply a Mechanical brake and Regenerative brake at a time i.e both brakes are applied at the same time.
Finally, we can conclude that Electric and Mechanical brakes are coordinated when being used in EV & HEV.
The coordination is based on the requirement, which is either comfort braking or efficient braking.
If we take an example of Nissan Leaf
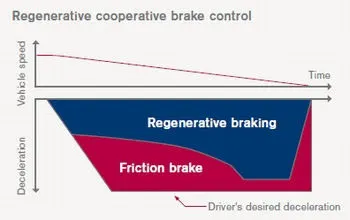
Nissan Leaf is made with the Regenerative Cooperative Brake Control method which is an intelligent Brake control method developed by the company.
This method is an intelligent automatic control method, designed by Nisan company, in this method when speed is low on Generation braking is done when applied brakes,
and when the speed is high to a certain point both mechanical and regenerative braking will work simultaneously.
 |
3.3.1 MATLAB program
% Program to Calculate Efficiency of Motor and Plot its Contour Graph

clear all
close all
clc

% Speed and Torque array
s = linspace(1,1000);  % Speed [rad/s]
t = linspace(1,250);   % Torque [N.m]

% Constant values of Motor Losses
kc = 0.2;
ki = 0.008;
kw = 0.00001;
Constant_loss = 20;

% Creating Mesh
[S,T] = meshgrid(s,t);
Output_power = (S.*T);  % Power = speed * Torque

Cu_loss = (T.^2)*kc;   % Copper Loss
Fe_loss = S*ki;        % Iron Loss
Wind_loss = (S.^3)*kw;    % Windage Loss

In_power = Output_power + Cu_loss + Fe_loss + Wind_loss + Constant_loss;      %Constant Loss

Z = Output_power./In_power;

% Plot the Contour Graph for Efficiency
V = [0.70, 0.80, 0.85, 0.90 0.91, 0.92, 0.925, 0.93];
box off
grid off
contour(S,T,Z,V);
xlabel('Speed [rad/s]');
ylabel('Torque [N.m]');
title('Efficiency Contour of Electric Motor');
hold on

% Plot the Contour Graph for Power Output
% Plot 4kW and 8kW

V = [4000,8000];
contour(S,T,Output_power,V)
shading interp
Idea behind the code
While calculating the input, the losses also need to take into consideration
The losses are iron losses, copper losses, windage losses.
Copper losses (Cu_loss) = Kc.T^2
where Kc is the constant of copper loss
Iron losses (Fe_loss) = Ki.w
where Ki is the constant of iron loss, this varies with speed.
Windage losses (Win_loss)= Kw.W^3
where Kw is the constant of Windage loss, it depends on the size and shape of the motor.
Constant losses (Const_loss) = 20
Total losses = Kc.T^2 + Ki.w + Kw.W^3 + 20
Variable Z is the efficiency points we are giving, Efficiency is the ratio of output power to input power
3.3.2 Output plots
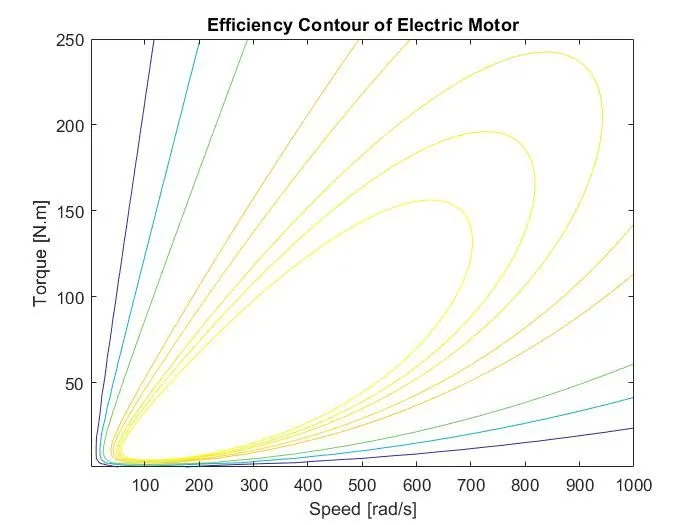 |
| FIG. CONTOUR GRAPH FOR EFFICIENCY |
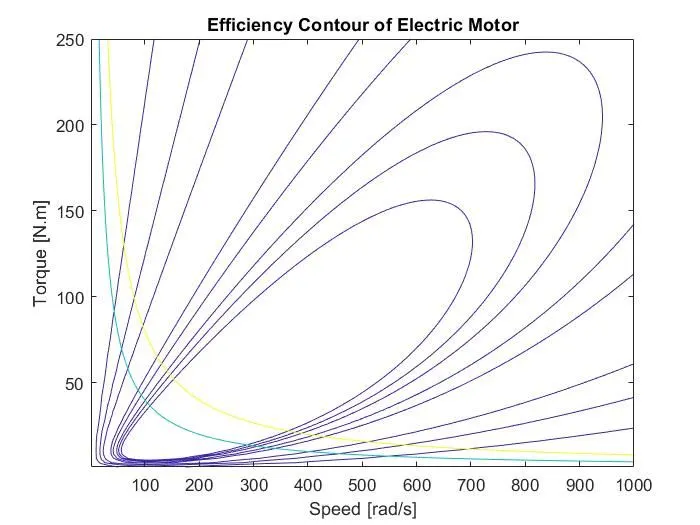 |
| FIG. CONTOUR GRAPH FOR EFFICIENCY SHOWING THE POWER OUTPUT OF 4KW & 8KW |
4. LEARNING OUTCOME
- To learn how to calculate the Braking Power for Motor for Defined Drive Cycle.
- To understand why an electric motor can’t develop braking torque at high speeds.
- To understand the coordination of electric and mechanical brakes.
- To understand the Efficiency of Electric motor using Contour Graph.