Week-11 Challenge: Braking
1. For the Us06 driving cycle, calculate the energy required for braking.
Us06 Drive cycle is taken and its characteristics of speed vs time are shown in fig 1.
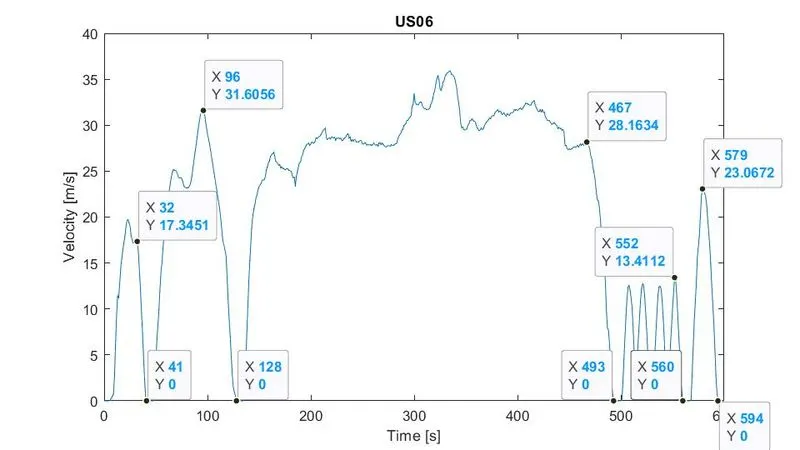
Fig 1. US06 drive cycle velocity vs time characteristics
W.K.T
watt to Kw conversion=1/1000
Braking Power in Kw=`1/2*(M*v^2)/t`
where
M= mass of the vehicle (kerb and payload)
v= Velocity of the vehicle (speed start to deceleration)
watt-sec to Kw-hr conversion=`1/(1000*3600)`
The energy required for braking in Kwhr=`1/2*Mv^2`
from the drive cycle, 5 deceleration(braking) Periods were taken for energy calculation. Periods are followed by
1st-period braking data: 32 to 41 sec i.e., time taken is 9sec, and 17.3452 to 0 m/sec (velocity is 17.3452 m/sec),
2nd-period braking data: 96 to 128 sec i.e., time taken is 32sec,and 31.6056 to 0 m/sec (velocity is 31.6056 m/sec),
3rd-period braking data: 467 to 493 sec i.e., time taken is 26sec and 28.1634 to 0 m/sec(velocity is 28.1634 m/sec),
4th-period braking data: 552 to 560 sec i.e., time taken is 8sec and 13.4112 to 0 m/sec(velocity is 13.4112 m/sec), and
5th-period braking data: 579 to 594 sec i.e., time taken is 15sec and 23.0672 to 0 m/sec(velocity is 23.0672 m/sec).
Assume the weight of the vehicle including payload is 1000kg
calculate power and energy for the braking period(1st)
Braking power(1st period)=`(1000*17.35*17.35)/(2*9)=16714.03` watts= 16.71 Kw
The energy required for braking (1st period)=`(1000*17.35*17.35)/(2)=150426.24`watt hr
watt hr to Kwhr=150426.24/(1000*3600)=0.0418Kwhr
Braking power(2nd period)=`(1000*31.61^2)/(2*32*1000)`=15.61 Kw
The energy required for braking (2nd period)=`(1000*31.61*31.61)/(2*1000*3600)=0.1387 kwhr`
Braking power(3rd period)=`(1000*28.16^2)/(2*26*1000)`=15.25 Kw
The energy required for braking (3rd period)=`(1000*28.16^2)/(2*1000*3600)=0.1101 kwhr`
Braking power(4th period)=(1000*13.41^2)/(2*8*1000)=11.24 Kw
The energy required for braking (4th period)=`(1000*13.41^2)/(2*1000*3600)=0.025 kwhr`
Braking power(5th period)=`(1000*23.07^2)/(2*15*1000)`= 17.74 Kw
The energy required for braking (5th period)=`(1000*23.07^2)/(2*1000*3600)=0.074 kwhr`
Total energy required for braking=0.0418+0.1387+0.1101+0.025+0.074=0.3896kwhr
By adding all the braking periods, we get The total energy required for braking in a US06 drive cycle is 0.3896Kwhr
Screenshot of Excel Sheet attached below for this energy-required calculation:
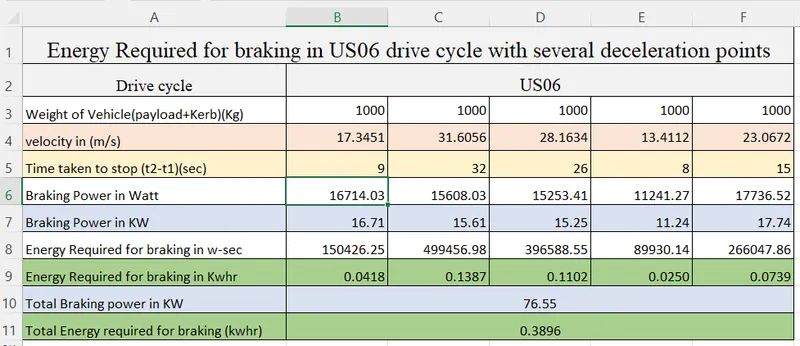
fig 2: energy-required and braking power calculation.
The Excel sheet is attached below and named 'energy required.xlsx'
2. Reason behind electric motor can’t develop braking torque at a high speed similar to starting
Regenerative Braking System
While in motion, an Electric Vehicle (Electric car, bus, and motorbike) carries momentum and kinetic energy. This kinetic energy while braking is lost to the environment as heat due to friction as braking.
As per the first law of thermodynamics – Energy can neither be created nor be destroyed but can be converted from one form to another, a part of the energy is converted or to say “regenerated” and driven back to the battery through the traction motor.
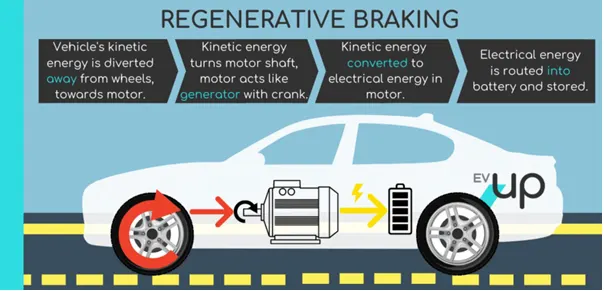
Fig 3: regenerative braking
In an Electric Vehicle, the moment the vehicle stops accelerating, the powertrain automatically engages a regenerative braking system to cover the loss of energy due to deceleration to transfer the energy back to the motor which now acts as the generator to recharge the battery. i.e., the Motor supply is disconnected from the battery then the kinetic energy of the motor is converted to electrical energy that charges the battery through a converter circuit. If the motor speed is greater than the synchronous speed then the motor act as a generator and enters into regenerative braking.
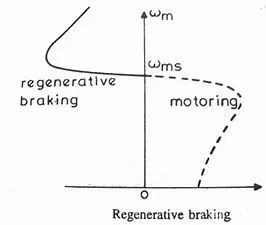
fig 4: Torque vs Speed characteristics of regenerative braking.
Reason:
The peak acceleration torque and peak deceleration torque are not equal in an electric motor. The peak acceleration torque is 7Nm but the peak deceleration torque is not -7Nm it's around -4Nm.
- During low speed, the torque produced by the motor is constant (i.e., Torque constant region). Therefore it has higher acceleration power.
- During high speed, the torque produced by the motor is not constant but power is constant(i.e., Power constant region). so at a low speed, higher braking torque is possible, and at a high speed, lower braking torque is possible.
- Because the motor is operating in a field weakening region or above base speed, the torque is compromised or lower torque is produced.
Limitation of regenerative braking
- All the power is not going to charge the battery.
- Charging of the battery is less than the peak discharging of the battery.
- Power converter must be bidirectional.
electric and mechanical brakes are coordinated:
Types of braking systems are followed by
- In conventional brake systems(mechanical brakes), continuous braking is applied and a significant amount of energy is lost due to the heating of the brake pads.
- In an anti-lock brake system(mechanical brakes), braking is not applied continuously, but intermittent braking is used to slow down or stop the vehicle. ABS is more efficient than the traditional brake system and provides superior performance.
- Regenerative Braking(Electric brake): When the brake pedal is pressed in an EV, the mechanism tends to move the motor in the opposite direction, thereby slowing the vehicle by generating torque in the opposite direction. During braking, the motor works as a generator that re-energizes the battery and at the same time slows down the vehicle. However, regenerative braking systems cannot be used alone because they have only a slow-down feature and cannot stop the vehicle completely. Therefore, such systems are used in coordination with conventional friction brakes or ABS.
Brake control strategies are classified into two types, they are series and parallel brake control strategies.
Series Brake control strategies:
In this system, both regenerative and mechanical braking cannot be applied simultaneously. braking is applied one by one i.e., At a time one brake is applied either regenerative or mechanical.
Parallel brake control strategies:
In this system, both the Regenerative braking system and the mechanical braking system are applied together in parallel braking to slow down the vehicle and the parallel regenerative braking system is simple and inexpensive.
Electric Driven Intelligent Brake(EDIB): It comes under parallel brake control strategies. At low-speed regenerative braking is used higher ratio than the mechanical braking system and starting period of braking or high speed, Both mechanical and regenerative are used simultaneously. Mechanical braking has a higher percentage than regenerative braking. fig 5 shows the braking participation of both systems.
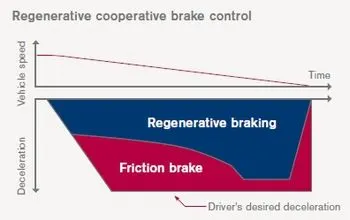
fig 5: EDIB control ratio of friction and regenerative braking.
3. MATLAB program that plots the contour of given motor speed, torque, and efficiency values.
M.script Program:
% Plotting contours of speed, torque, and efficiency for electric motors.
% The X axis corresponds to motor speed(w),and the y axis to torque T.
x=linspace(1,1000); % Speed in Rad/sec
y=linspace(1,300); % Torque in Nm
% Now make mesh
[Speed,Torque]=meshgrid(x,y);
% Motor losses= copper+iron+windage+constant motor losses
kc=0.2; % For copper losses constant
ki=0.008; % For iron losses constant
kw=0.00001; % For windage losses constant
ConL=20; % For constant motor losses
Pcu=(Torque.^2)*kc; % Copper losses
Pi=Speed*ki; % Iron losses
Pw=(Speed.^3)*kw; % Windage losses
Losses=Pcu+Pi+Pw+ConL;
Outputpower=(Speed.*Torque); % Torque*speed=Power
Inputpower=Outputpower+Losses;
Efficiency=Outputpower./Inputpower;
% We now set the efficiences for which is contour will be plotted.
V=[0.70,0.80,0.85,0.875,0.90,0.91,0.92,0.925,0.93];
box off;
grid off;
contour(Speed,Torque,Efficiency,V);
xlabel('Speed in rad/s'),ylabel('Torque in Nm');
hold on;
% Now plot a contour of the power output
% the array Output power has already been calculated.
% we draw contours
I=[8000,10000];
contour(Speed,Torque,Outputpower,I);
Program Explanation:
- Using linspace command setting the range for the x and y axis and here x-axis is the speed in rad/sec and y-axis is torque in Nm.
- Using meshgrid command is used to combine the x and y axis without a relation equation between them.
- Calculate the copper losses`P_(cu)=T^2*k_c` , iron losses `P_i=speed*k_i`, windage losses `P_w=speed^3*k_w` and additing all the motor losses `Losses=P_(cu)+P_i+P_w+constant`
- Calculate the output power by multiplying the torque and speed.
- by additing losses and output power we get input power.
- calculate efficiency using output power divide by input power formula.
- Set the point of efficiency from 70 to 93 %( v variable used) for which contour will be plotted.
- contour command is used to plot the speed, torque, efficiency, V. contour is used to show the 3D dimension in 2D with top view.
- power 8000 and 10000 watt is plotted using contour command
- run the program and get the graph of speed torque efficiency .
Output Graph:
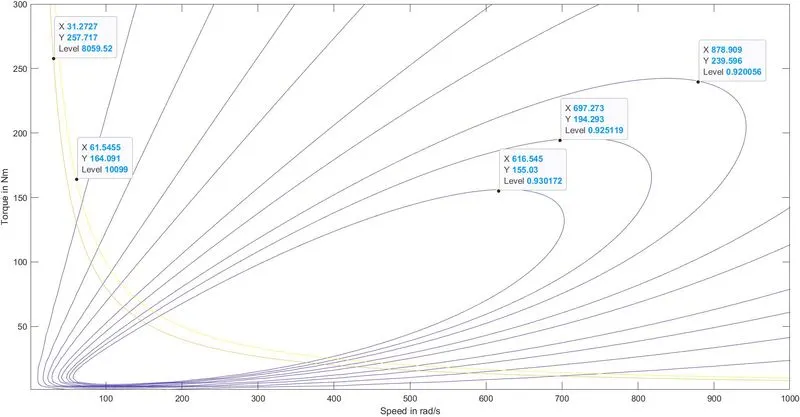
Fig 6: shows the torque, speed, and efficiency of the motor in contour form.
In the above image shows the yellow and brown characteristics are 8000 and 10000-watt power respectively
Inner elliptical characteristics show efficiency at 93%, as elliptical increases then the efficiency is decreased. The outer elliptical curve has 92% efficiency.
Contour program m script is attached below and named 'motor_loss.m'.