Week-11 Challenge: Braking
NOTE:EV LIVE SESSION BATCH 16
Q1)For a defined driving cycle, calculate the energy required for braking.
ANS:
Following is the script required for calculating energy required for bracking
m=1000;
 %xlsread (drive_cycle_ch11.xlsx);
 t=drivecyclech11(:,1);
v=drivecyclech11(:,2);
 for i=1:(length(drivecyclech11)-1)
 if v(i) >v(i+1)
BE(i)= 0.5*m*(v(i)-v(i+1))^2;
 end
end
 fprintf('total brake energy is %d', sum (BE));
%plotting
 plot (BE, 'color', 'r');
xlabel( 'Time(s)');
ylabel('Energy(J)');
title('Braking Energy')
The following is graph of bracking energy
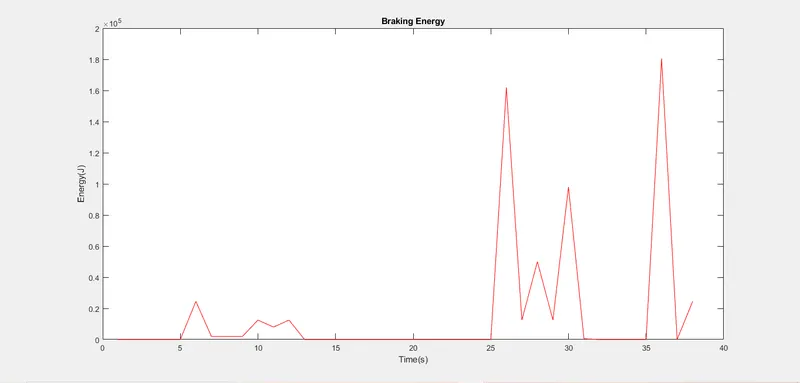
Total brake energy required for bracking is 604000 J=0.167777778 KWh. from result
I aatached .xlsx file name by drive_cycle_ch.xlsx
***************************************************************************************
Q2)Why electric motor can’t develop braking torque at high speed similar to starting? How electric and mechanical brakes are coordinated?
ANS:
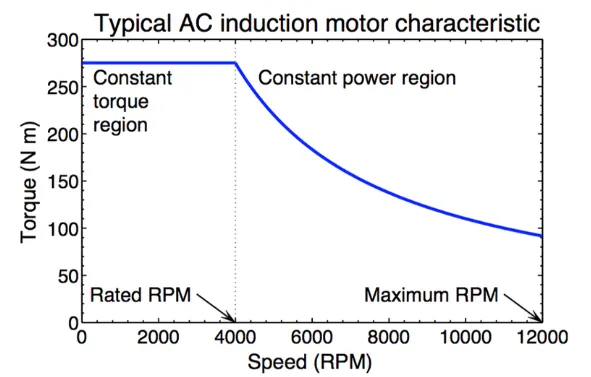
- The above fig shows t6he Torque speed characteristis of electric motor
- Thre are two region one is constanty torque rigion and another is const power region
- we can see that at time of starting of motor we need the torque to rotate the rotor so at starting high torque is required and torque demand is constant upto speed reach rated speed value therefore this region from starting to rated speed called as constant torque region
- but when motor reach to its rated speed the torque demand is less and we can increase the speed further but at this time power requirement is constant therefore this rigion is called constant power region
- as motor is at high speed we provide negatthe torque for bracking but at time speed value is high there fore torque provided is low and motor anable to generate high bracking torque at that time.
- for high breaking torque the motor speed should be low
- thats why electric motor cant developed braking torque as similar to starting so we have to use mechanical bracking with electrical in Electric vehical
How electric and mechanical brakes are coordinated
In electrical bracking we providing negative torque by changing in electric connection means we change the supply terminal of motor.
But it take time if motor is at high speed as at high speed the torque value is less.
In Ev mostly regenerative bracking is used in this bracking system the motor act as generator and the kinetic energy is fed back to sourse.
In mechanical bracking we reduce the speed by freection using brack drum.and kinetic energy will converted into heat energy and speed reduced
As at high speed the the electrical bracking take time to reduce speed so mechanical bracking and electrical bracking both are used such as at initial condition mechanical bracks are applied to reduced speed and when speed reach in constant torque region the electrical bracking is comes in action to reduce speed further.
Co-ordination in bracking can be done in two way
1)paraleel bracking 2) series bracking
1) Parallel Bracking:
- in parallel bracking font wheel bracking done by mechanical means by friction and rear wheel bracking by applying the mechanical and electrical bracking symultaniously
2)Series Bracking:
- in series bracking the front wheel control by mechanical bracking and in real wheel mechanical and electrical bracking are applied one after another.
- if speed is less then electrical bracking is used but it m,ay limited according to SOC og battery
- if soeed is high then real wheel friction bracke are applied and if bracking not done then front wheel bracking employed
- The co-ordination of bracking is done as per choice of comfort and battery state
****************************************************************************
Q3)Make a MATLAB program which plots contour of given motor speed, torque and efficiency values. Attach the code as a .m file attach a screenshot of all the plots
ANS:
A contour plot is a graphical method to visualize the 3-D surface by plotting constant Z slices called contours in a 2-D format. The contour plot is an alternative to a 3-D surface plot
x = linspace(1,1000);  % motor speed (rad/sec)

y = linspace(1,250);   % Motor Torque (Nm)

% allocate motor losses

Kc = 0.2; % copper loss

Ki = 0.008; % iron loss

Kw = 0.00001; % windage loss

ConstL = 200;   % constant loss

% now make mesh

[X,Y] = meshgrid(x,y);

OutputPower = (X.*Y);  % Power = Torque * Speed

B = (Y.^2)*Kc;  % Copper loss

C = X*Ki;  % Iron loss

D = (X.^3)*Kw;  % Windage Loss

InputPower = OutputPower + B + C + D + ConstL;

Z = OutputPower./InputPower;

% We now set the efficiencies for which a contour
% Will be plotted
V = [0.70,0.80,0.85,0.90,0.91,0.92,0.925,0.93];
contour(X,Y,Z,V);
xlabel('Speed (rad/sec)')
ylabel('Torque (Nm)')
title('Efficiency of Motor')
RESULT:
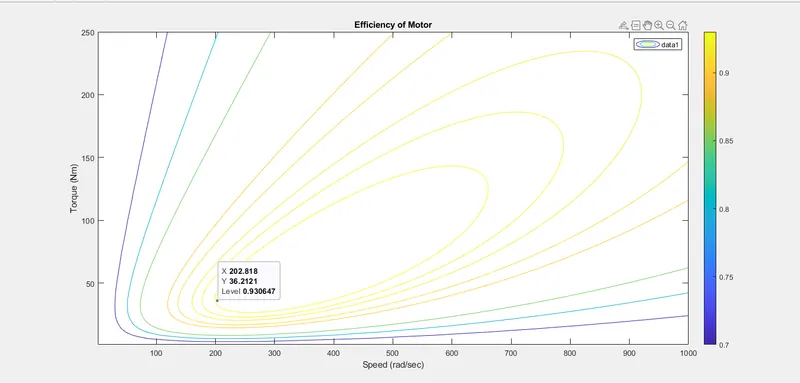
- contour represent operational condition of motor.
- In above plot we can see that efficiency of motor is high at low speed and torque as speed and torque increses efficiency decreases