Week - 4
Q.1)Implement control logic of a “washing machine” using Stateflow as per given sequence:
- If the power supply is available, the system gets activated
- If the Water supply is not available, stop the process & indicate through LED
- Soaking time should be 200s followed by Washing time of 100s.
- Then rinsing happens for next 20s & dryer runs for 50s
After all the processes have completed turn on the finished LED
ANS:
- Here to make model we need 'stateflow chart' to drow different state in washing machin they mentioned in question.
- we also need lamp and constant block to indicate process and to give input as power supply and water avaibility respectively
- I arrange it as per requirement
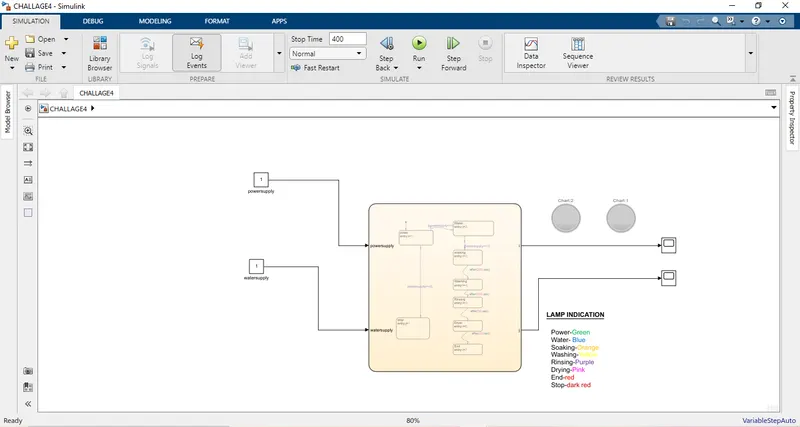
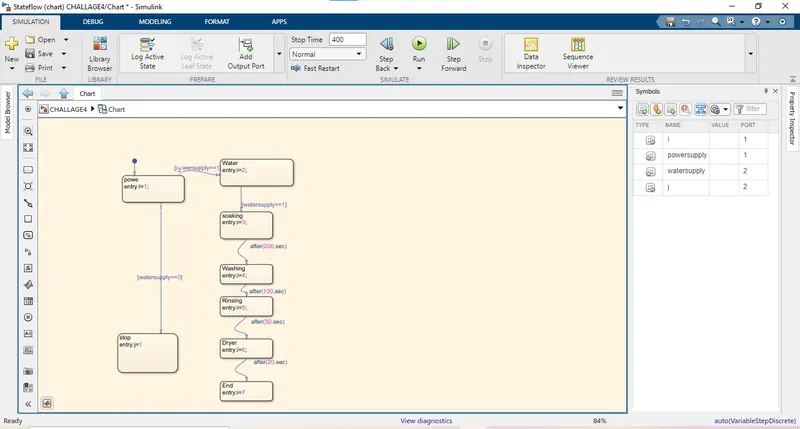
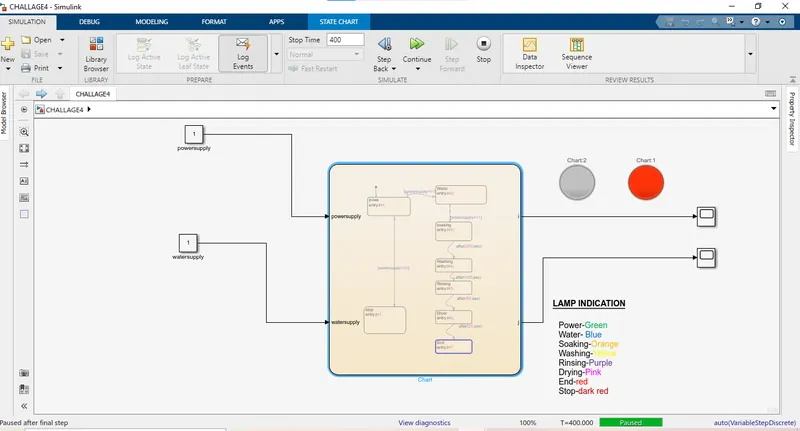
- Here bellow i drow the chart according to condition required .
- Use 'i' & 'j' as variable for output and drow state
- As per flow requirement give deley between state were requred and chart done as shown below
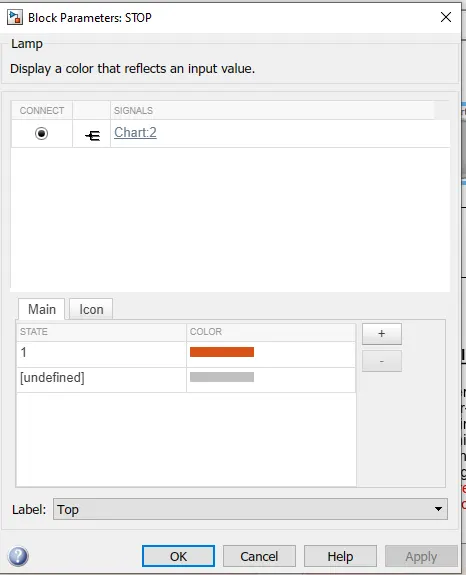
- Here i use the lamp to indicate the condition water is not available so that process was stop.
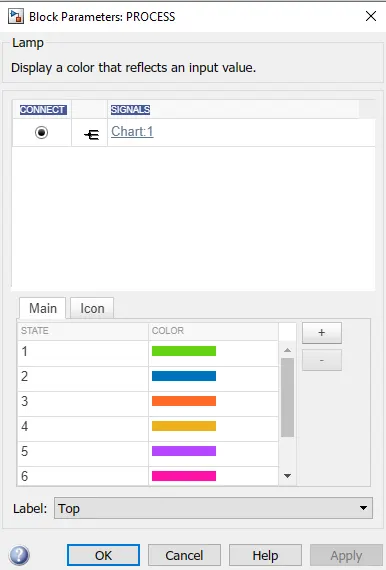
- And i connect to 'j' output of chart. also assign dark red colour for indication as bellow.
- Here i use one lamp for power avaibility,water avaibility and all 4 state in washing machine as well as for to indicate end of process & give them different colour according to state to identify that perticular state after runing.
This lamp connect to 'i' output from the chart
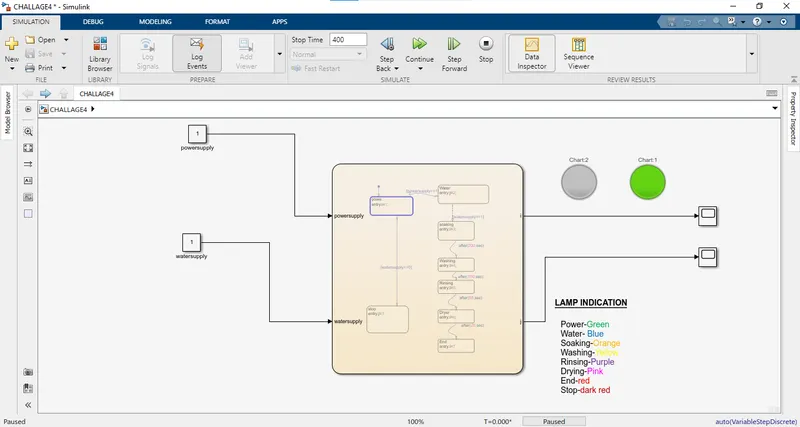
case1:
- So after running model here our first condition is to check power supply.
- The input given through const block as 1
- so it indicate power is available and it indicate green colour by lamp
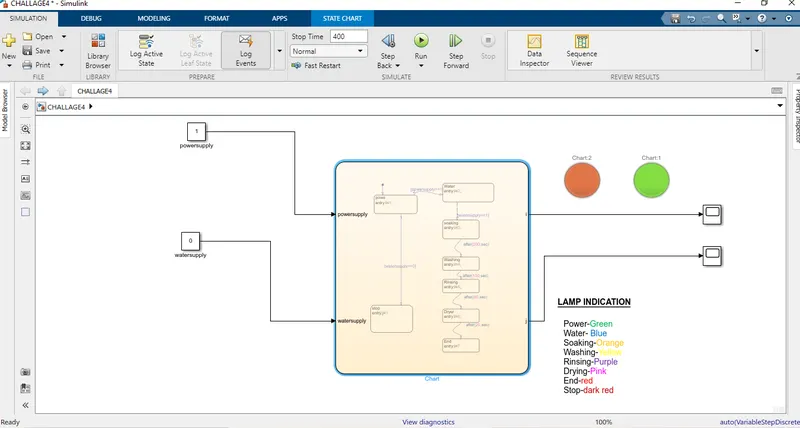
CASE 2:
If the water supply not available means the input given to the constant block of water supply is '0' then the condition to go next state was not satisfied and no process done afterward and the 'no water condition' execute which give the glowing lamp connected to j output with dark red colour
CASE3:
- Next case is power supply and water supply available
- If both power supply and water is available then it indicate by green colour of thamp that power is available. and another lamp not active means water is also available as it for 'No water condition'
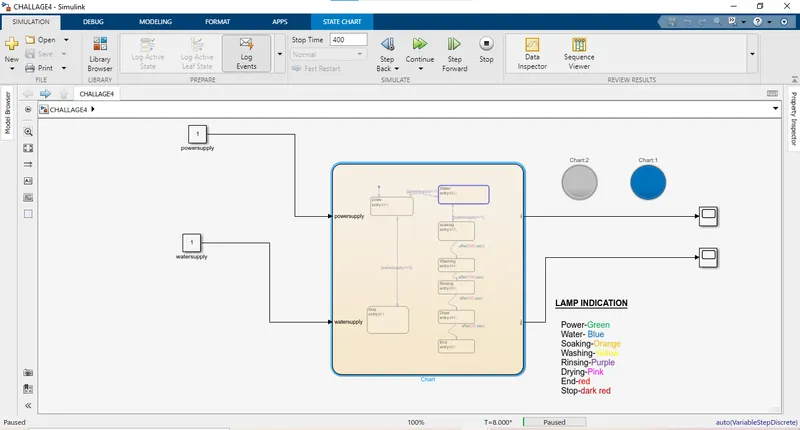
- If both power and water are available then state next to the water block i. e soaking state will activated.
- And the soaking state remains for 200 seconds as I give a delay of 200sec to next state. And it indicated by lamp as in fig by ORANGE Colour indicate that soaking process going on
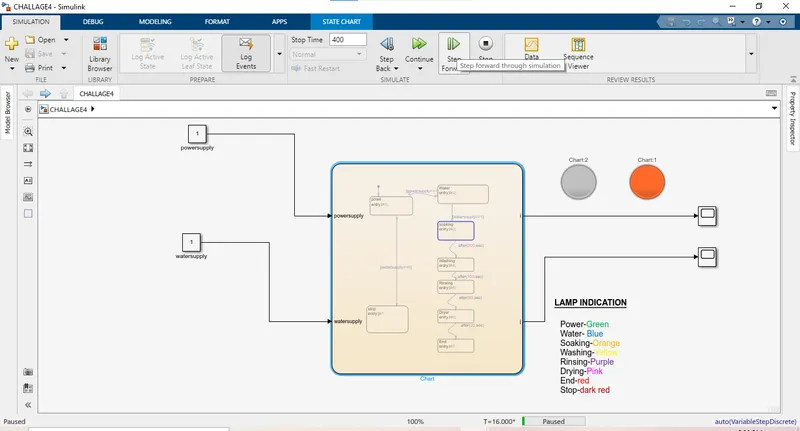
- After completing the 200sec it goes to the next state of washing. And asper condition this state will active for 100sec and the lamp will glow by colour YELLOW indicate that the washing process is going on
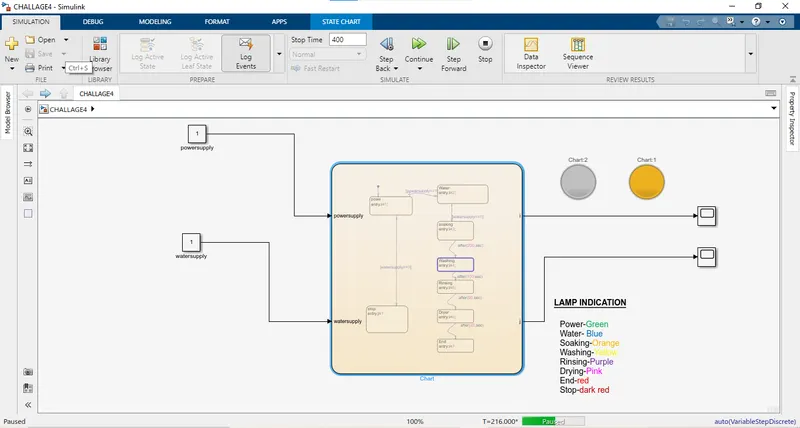
- After 100 sec it go to next stateflow block of rising.
And it remains for 20sec and and indicated by lamp with PURPLE colour Showing that rising process is going on
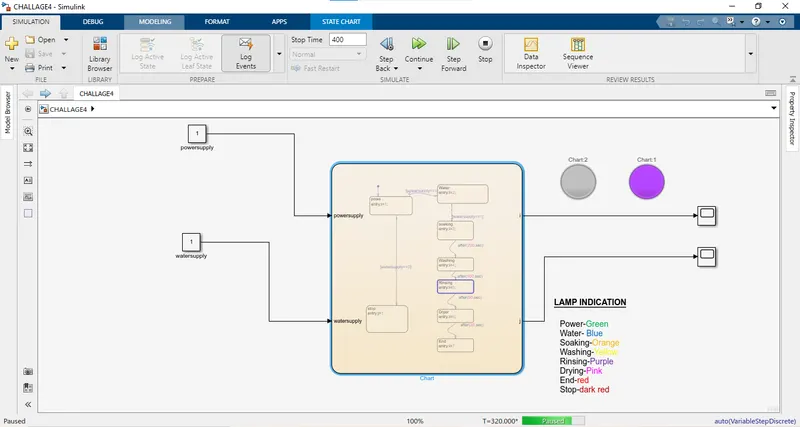
- After 20 sec it will goes to next stateflow state of drying. And it remains for 50 sec indicated by lamp with PINK colour Showing that drying process is going on
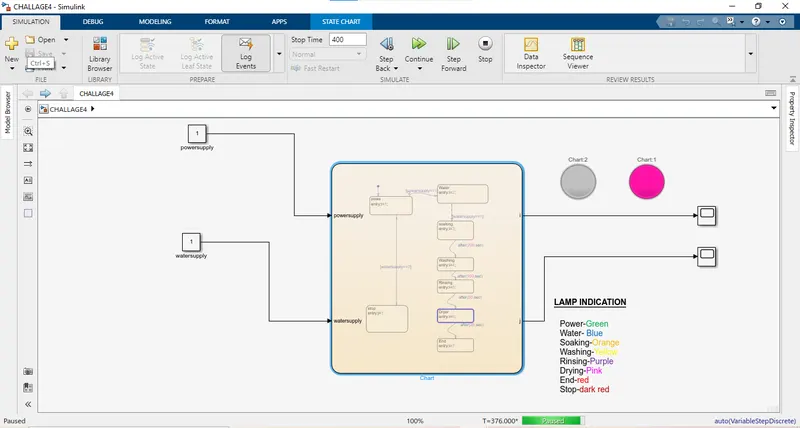
- After 50 sec the process drying will stop and the lamp of 'process end' glow indicating that whole process done and bulb glow with colour RED
--------------------------------------------------------------------------------------------------------------------------------
Q2) Make a Simulink chart for the “Gear shift” logic as per below conditions:
Speed Range(kmph) Gear
0 to 15 1
16 to 25 2
26 to 40 3
41 to 60 4
Above 61 5
Give speed input while the simulation is running & display the gear number.
ANS:
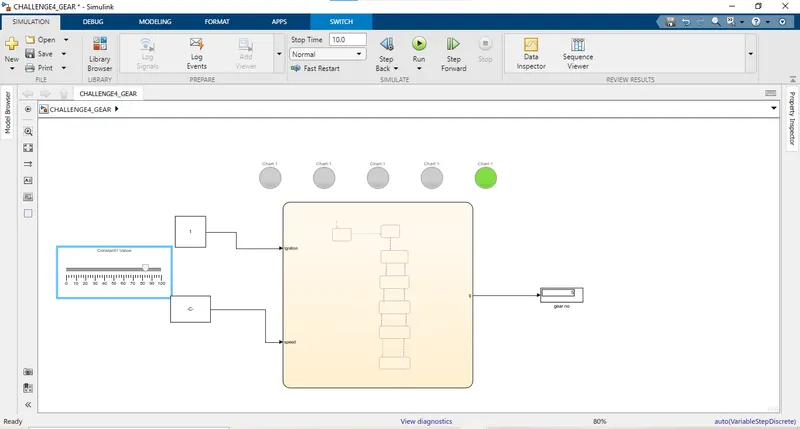
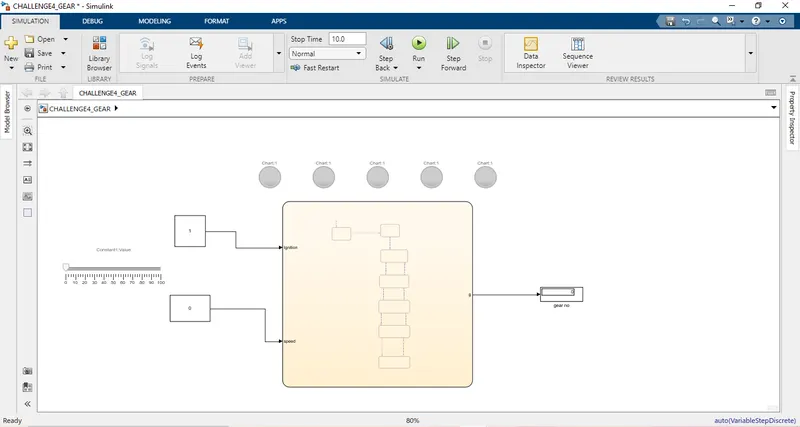
- For creating these gear shift logic model required a Stateflow chart block.
- Also providing desired speed input to the chart block I used slider and constant blocks.
- Another const block given for engine ignition to start vehicle or process
- Similarly for easy identification of gear numbers I used Lamp
- Below figure shows the model of gear shift logic
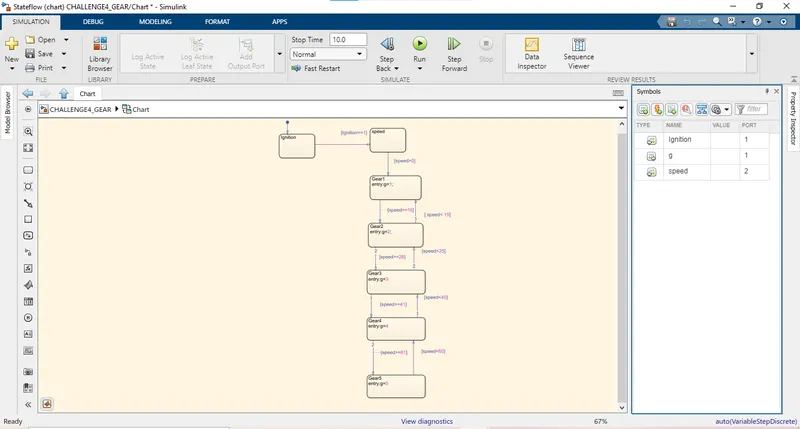
- In the chart block i create a simple logic as per our given condition.
This is how and where i connect the lamp and slider is as per given fig
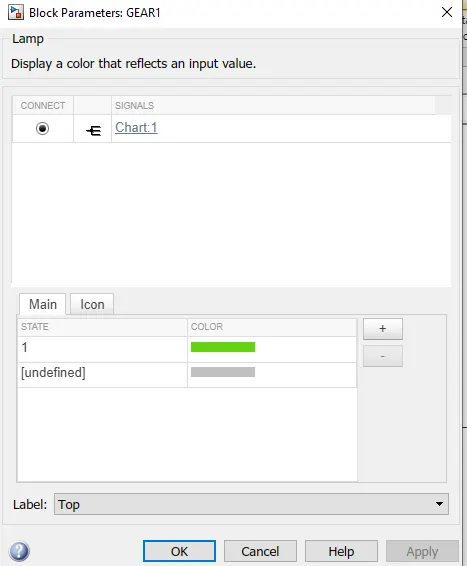
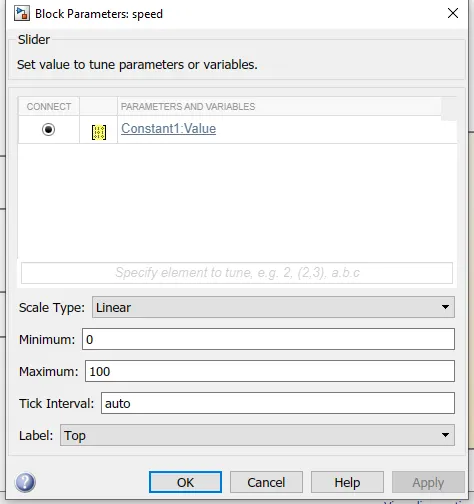
- According to chart block logic when we vary the input speed, gear number also varies in display as per above transition assigned condition. Similarly respective gear lamps also glow.
- In the above chart block I defined ‘speed’ is an input data and ‘g’ is an output data as shows in symbol pane of above no2 figure.
- When speed between 0 to15 lamp and display indiacate 1st gear
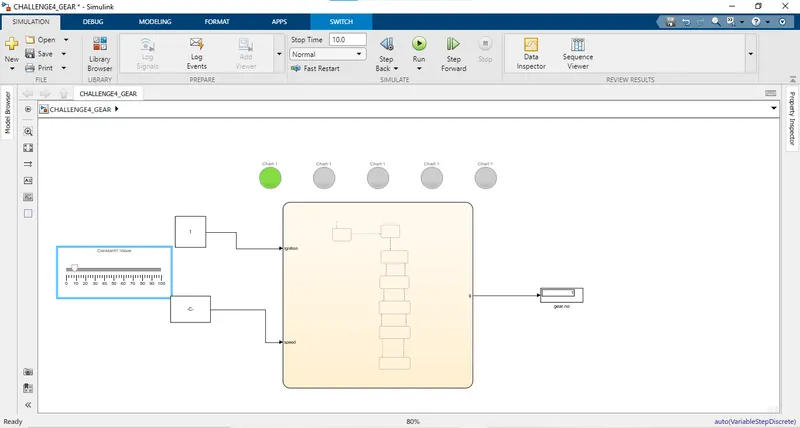
- When speed between 16 to 25 lamp and display indiacate 2nd gear
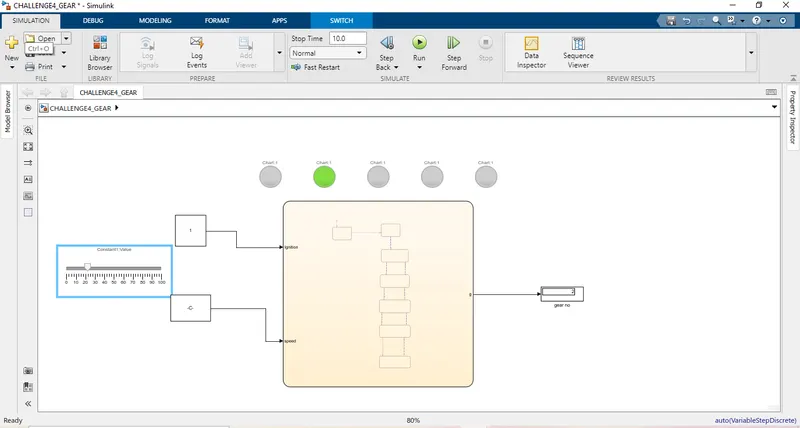
- When speed between 26 to 40 lamp and display indiacate 3rd gear
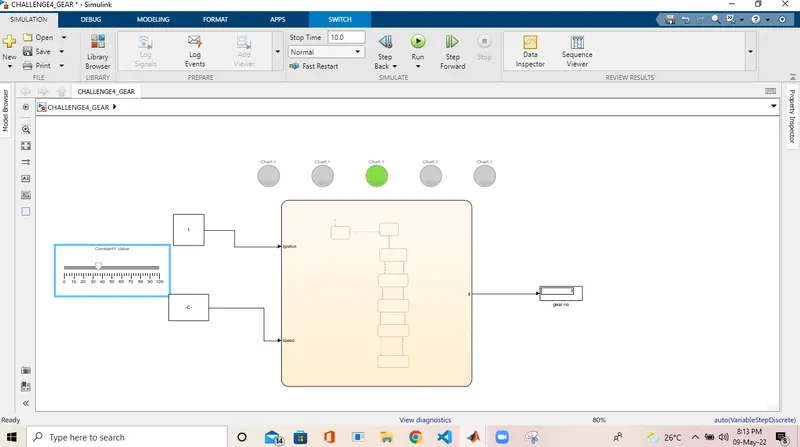
- When speed between 41 to 60 lamp and display indiacate 4th gear
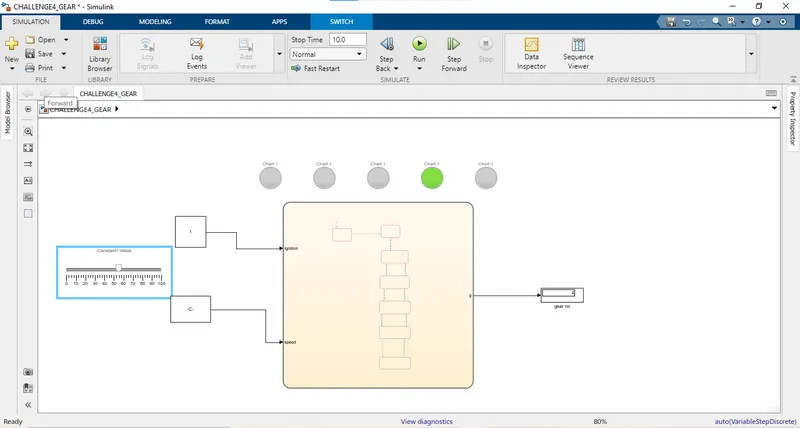
- When speed above 60 lamp and display indiacate 5th gear