Week-11 Challenge: Braking
**This assignment is for the 13th batch live session**
AIM:
1. To calculate the energy required for braking for a defined drive cycle.
2. Why electric motor can’t develop braking torque at a high speed similar to starting? How electric and mechanical brakes are coordinated?
3. Make a MATLAB program that plots the contour of given motor speed, torque, and efficiency values. Attach the code as a .m file attach a screenshot of all the plots.
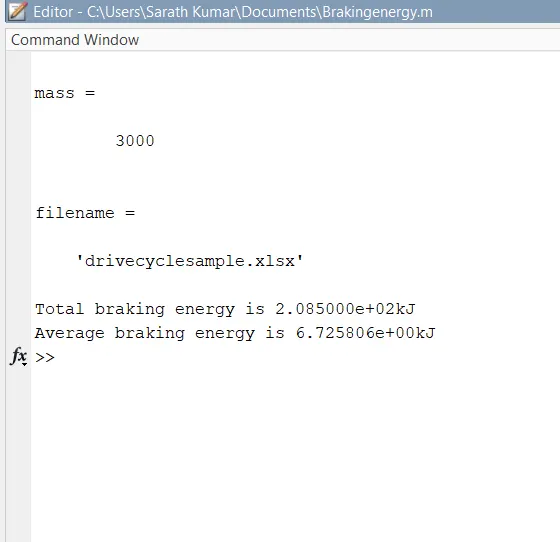
1. Energy required for braking for a defined drive cycle.
The energy required for acceleration or deceleration is nothing but the kinetic energy required by the vehicle.
Energy required for Acceleration = Energy required for Deceleration = 1/2 m*v^2
But concerning the calculation of braking energy of a vehicle, we have to consider the initial speed and the final speed of the vehicle to determine the kinetic energy required
Hence, BE = Braking Energy (J) = BE/(3600 1000) (Kwh)
M = Mass of the vehicle (kg)
V1 = Initial Velocity (m/s)
V2 = Final Velocity (m/s)
%Plot for motor speed, torque and efficiency

clear all
close all
clc

%input quantities       Assumed parameters
V = linspace(1,1200);   %velocity array
T = linspace(1,500);    %Torque array
Kc = 0.1;               %copper loss constant
Ki = 0.06;              %Iron loss constant
Kw = 0.001;             %Windage loss constant
C1 = 20;                %Motor loss constant

%calculation
[A,B] = meshgrid(V,T);  %Array to matrix

%power calculations
P_out = (A.*B);        %Motor output power
P_c = (B.^2)^Kc;       %Copper loss power
P_i = A.*Ki;           %Iron loss power
P_w = (A.^3)*Kw        %Windage loss power
P_in = P_out + P_c + P_i + P_w +C1;  %Motor input power

%Efficiency calculation
Efficiency = P_out./P_in;

%Contour plotting
N = [0.75,0.8,0.85,0.86,0.87,0.88,0.89,0.9,0.91,0.92,0.93,0.94,0.95];  %Countour Mapping

figure(1)
box off
grid off
contourf(A B C V)
colorbar
title('Torque-speed-Efficiency contour of an induction motor');
xlabel('Rotor speed in rpm');
ylabel('Induced Torque in N-m');
zlabel('Motor efficieny');

figure(2)
surf(A,B,Efficiency);
colorbar
title('Torque-speed-Efficiency surface contour of an induction motor');
xlabel('Rotor speed in rpm');
ylabel('Induced Torque in N-m');
zlabel('Motor efficieny');
Excel link for drive cycle:
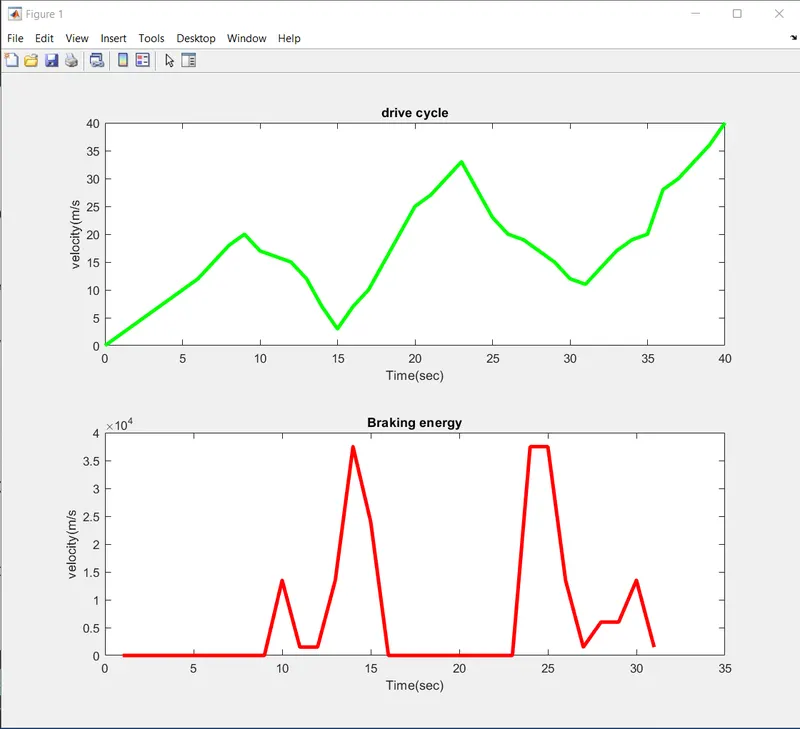
Output plot:
Model link:
2. Why electric motor can’t develop braking torque at a high speed similar to starting? How electric and mechanical brakes are coordinated?
The torque developed by an electric motor during deceleration is very low compared to the acceleration phase because during acceleration the motor operates at the constant torque region where the starting torque is very high.
Whereas during the deceleration phase the motor operates in the constant power region where the torque developed is very low.
During deceleration ie when the motor is at high speeds i.e. at speeds greater than base speed, due to the field weakening effect the torque developed will be below. Hence it is not possible to obtain maximum regenerative braking efficiency due to the above-explained motor limitation.
Another limitation concerning regenerative braking is due to the battery. The discharge rate of a battery is twice that of its charging rate. Hence during regenerative braking, the energy saved cannot be used to charge the battery at the desired rate. The final limitation concerning regenerative braking is associated with the power converter. To supply the energy saved during regeneration from the motor back to the battery, we need a bi-directional power converter, which in turn increases the complexity of the system and also losses during conversion should be considered.
COORDINATION BETWEEN ELECTRIC AND MECHANICAL BRAKES
Coordination between electric and mechanical brakes can be obtained using two methods:
1. Series strategy and
2. Parallel strategy
Under the series strategy, both the electric and mechanical brakes are applied one after another. With the serial type of blending between friction brake and regenerative brake can be obtained, leading to the vehicle deceleration corresponding to the driver's braking demand.
This type offers a high regeneration efficiency and good braking feel but requests several modifications in the hydraulic brake line to mechanically decouple the connection between the brake pedal and the brake pressure Under a parallel strategy, both the electric and mechanical brakes are applied simultaneously. In parallel systems, the brake pressure is coupled to the brake pedal, and the regenerative braking is added directly to the friction brake operated by the brake pedal, which results in a low regeneration efficiency and poor brake comfort.
Electric Driven Intelligent Brake (EDIB) developed by NISSAN is one of the most efficient types of coordinated braking established between electric and mechanical brakes. After stepping on the brake pedal, the system produces a natural and adequate braking force that corresponds to the operation.
EDIB (Electric Driven Intelligent Brake) controls the regenerative brake and friction brake to support both of these requirements. Further, it also controls the reactive force from the pedal to unify the feeling when stepping down on the pedal and the sense of deceleration.
EDIB is programmed such that during the initial phase of braking i.e. at high speeds both the regenerative and friction brakes are applied in a predetermined ratio. Whereas at lower speeds the regenerative brakes are applied pre-dominantly. This is because, at lower speeds, large torque is present which increases the efficiency of regenerative braking.
3. Make a MATLAB program that plots the contour of given motor speed, torque, and efficiency values. Attach the code as a .m file attach a screenshot of all the plots.
clear all
close all
clc

%Determining the speed range (rad/s)
x = linspace(1,1000);

%Determining the torque range (Nm)
y = linspace(1,250);

%Allocating motor loss constants

%For copper losses
Kc = 0.2;

%For Iron losses
Ki = 0.08;

%For windage losses
Kw = 0.00001;

%For constant motor losses
ConL = 20;

%Meshing speed and torque ranges to create a 2D Array
[x,y] = meshgrid(x,y);

%output power
Po = (x.*y);

%Copper losses
B = Kc.*(y.^2);

%Iron losses
C = Ki.*(x);

%Windage losses
D = Kw.*(x.^3);

%Input power
Pi = Po + B + C + D +ConL;

%Efficiency
z = Po./Pi;

%Setting the efficiencies for which a contour will be plotted
v = [0.70,0.75,0.80,0.85,0.90,0.91,0.92,0.93,0.94,0.95];

%plotting the efficiency contour
box off
grid off
contour(x,y,z,v)
xlabel('speed (rad/sec)');
ylabel('Torque (Nm)');
hold on
%plotting contours of output power at 8kW and 10kW
v = [8000,10000];
contour(x,y,Po,v)
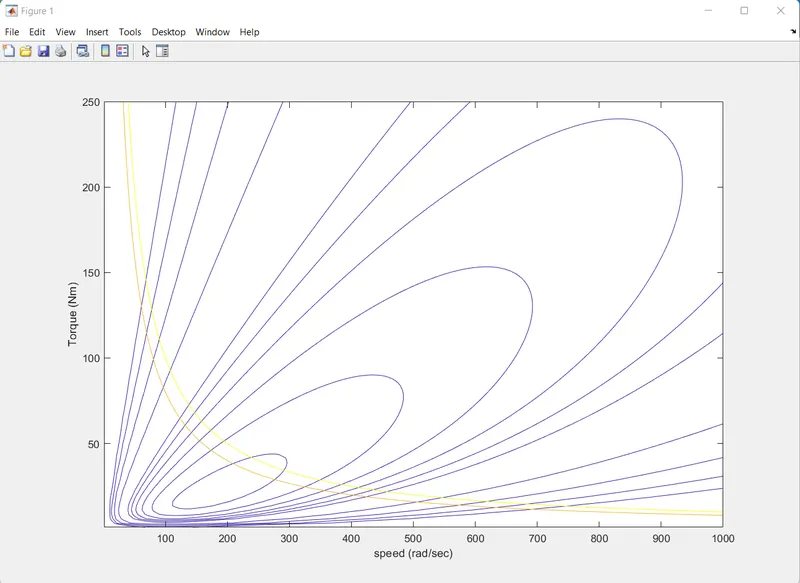
Plot:
Model link: