Week-11 Challenge: Braking
1) For a defined driving cycle, calculate the energy required for braking.
Answer :
The function of the braking system is to retard the speed of the moving vehicle or bring it to rest in the shortest possible distance whenever required. The vehicle can be held on an inclined surface against the pull of gravity by the application of a brake. Brakes are mechanical devices for increasing the frictional resistance that retards the turning motion of the vehicle wheels. It absorbs either kinetic energy or potential energy or both while remaining in action and this absorbed energy appears in the form of heat. While moving down a steep gradient the vehicle is controlled by the application of brakes. In this case, brakes remain in action for a longer period making it imperative to dissipate the braking heat to the atmosphere as rapidly as possible.
Automobiles are fitted with two brakes; the service or foot brake and the emergency or hand brake.
The foot brake is used to control the speed of the vehicle and to stop it, when and where desired, by the application of force on the brake pedal. The hand brake, applied by a lever, is used to keep the vehicle from moving when parked. Hand brakes are called emergency brakes because they are applied when the service brake fails. Virtually all vehicles are now equipment with 4-wheel brakes. The front brakes must operate without interfering with the steering action. The brakes must be capable of decelerating a vehicle at a faster rate than the engine is able to accelerate it. Normally brakes have to absorb three times the amount of engine horsepower energy in its equivalent form.
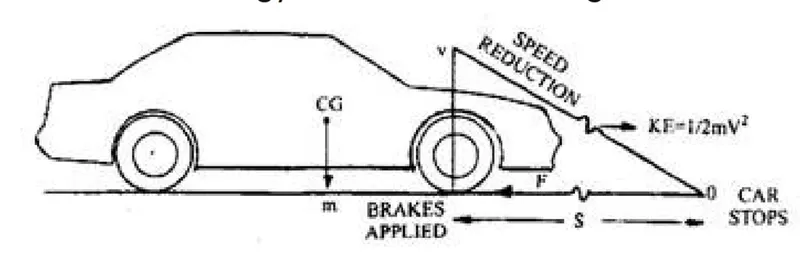
Kinetic energy is the force that keeps the vehicle moving. This energy is provided by the engine in order to accelerate the vehicle from a standstill to desired speed. Kinetic energy is dissipated as heat by the brakes during application of breaks (Fig. 28.1). The kinetic energy of a vehicle during braking is given by :
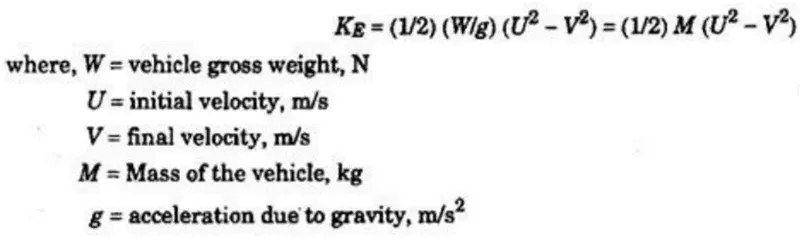
Thus, the kinetic energy doubles as the weight doubles, but it increases four times as speed doubles.
Before calculating the Braking Energy of a particular vehicle ,we need to create an excel sheet for a drive cycle.
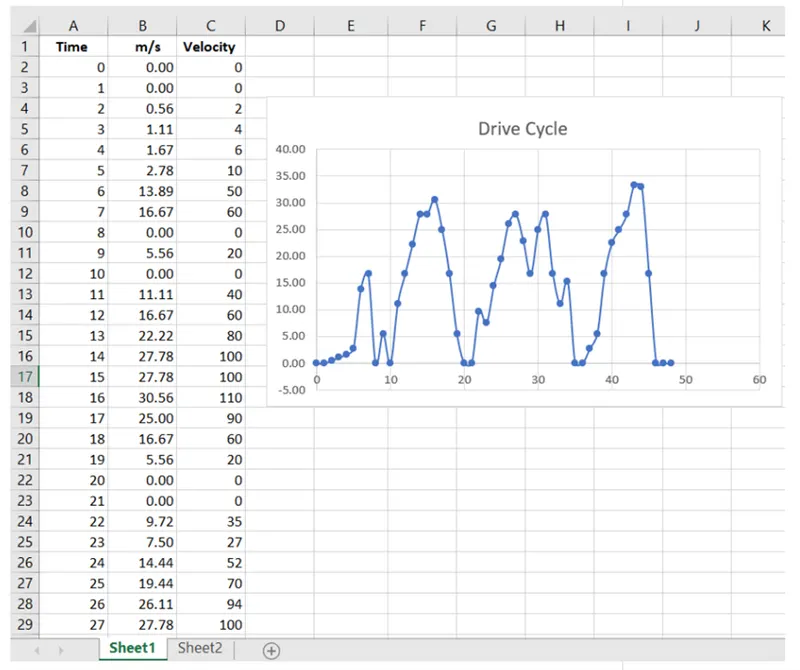
Now we need to import this excel data to the MATLAB and then create a program to calculate and plot the results of the brake energy.

MATLAB program for the calculation of brake energy:
mass = 1000; % mass of the vehicle in kg

t = velocityandtime(:,1); % time period

v = velocityandtime(:,2); % velocity data in m/s

for i = 1:(length(velocityandtime)-1)

if v(i)>v(i+1)

BE(i) = 0.5*mass*(v(i) - v(i+1))^2; % BE stands for brake energy

end

end

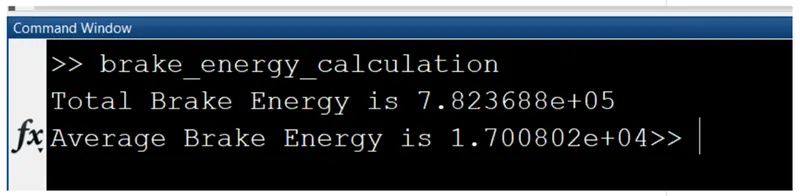
fprintf('Total Brake Energy is %d',sum(BE))

fprintf('Average Brake Energy is %d',mean(BE))

% plotting the results

figure(1)

subplot(2,1,1)

 plot(t,v,'linewidth',3,'color','g')

 xlabel('Time(s)')

ylabel('Velocity(m/s)')

 title('Drivecycle')

subplot(2,1,2)

 plot(BE,'linewidth',3,'color','r')

 xlabel('Time(s)')

 ylabel('Braking Energy')
Results :
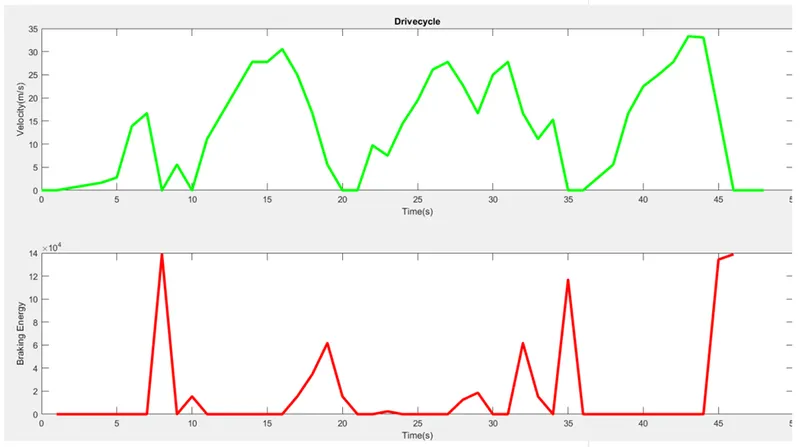
2) Why electric motor can’t develop braking torque at high speed similar to starting? How electric and mechanical brakes are coordinated?
Speed torque characteristics of motor is shown below,
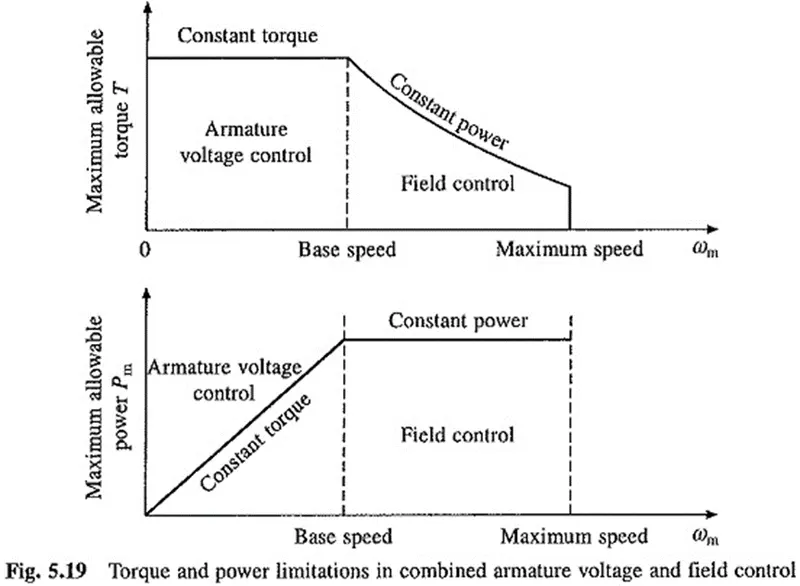
In the first graph till the motor reaches the critical speed it has constant torque and once it reaches the critical speed, the curve is having a down slope which is a constant power region. And this graph denotes the accelerating operation of the motor. For the deceleration or braking operation of the motor, this graph is mirrored down which will be having the speed (+ve) and torque (-ve).
For example,
we can say that an EV can achieve 0-100 kmph in 10sec. Acceleration operation goes this way, with low speed and high torque Constant torque region is achieved which has accelerating power and by reaching the critical speed it shifts to constant power region and thus it easy for an EV to reach 0-100 kmph.
As said the breaking operation graph will be th mirrored image of above plot. So we cannot say that the motor producing 7Nm torque for acceleration can also produce -7Nm for breaking. Because we are operating in the field weakening region and operating above the base speed. Thus Peak Acceleration torque is greater than the Peak Deceleration torque. Thus, for acceleration it has high torque with low speed and for deceleration it has low torque for high speed.
There are two brake control strategies ,SERIES & PARALLEL.
SERIES:
Brakes will be applied one after the another so which they are connected in series. Either one brake stragety at a time either Regenerative braking or Mechanical braking at a time.
PARALLEL:
In case of parallel both the brakes are applied simultaneously, Both at a time.
ELECTRIC DRIVEN INTELLIGENT BRAKE:
And Nissan has developed a practical brake strategy called ELECTRIC DRIVEN INTELLIGENT BRAKE developed by Nissan leaf.
Technology Functionality:
After stepping on the brake pedal, the system produces natural and adequate braking force that corresponds to the operation. The amount of energy regeneration also needs to be increased as much as possible. EDIB (Electric Driven Intelligent Brake) controls the regenerative brake and friction brake to support both of these requirements. Further, it also controls the reactive force from the pedal in order to unify the feeling when stepping down on the pedal and the sense of deceleration.
3) Make a MATLAB program which plots contour of given motor speed, torque and efficiency values. Attach the code as a .m file attach a screenshot of all the plots.
MATLAB program:
clear all

close all

clc

 x=linspace(1,1000,250); %Speed in rad/sec

 y=linspace(1,250,250); %Torque in Nm

%Motor loss constants

kc=0.2; %Copper loss constant

 ki=0.008; %Iron loss constant

 kw=0.00001; %Windage loss constant

Const_Loss=20; %Constant motor loss

 [X,Y]=meshgrid(x,y); %Converting to 2D

Output_power=(X.*Y); %Power = Torque x Speed

 B= (Y.^2)*kc; %Copper loss

C= X.*ki; %Iron loss

D= (X.^3)*kw; %Windage loss

Input_power = Output_power + B + C + D + Const_Loss;

Efficiency= Output_power./Input_power; %Eff of the motor

V = [0.70,0.80,0.90,0.91,0.92,0.925,0.93]; %Efficiencies to be plotted

box off

grid off

contourf(X,Y,Efficiency,V);

contourcbar

title('Speed-Torque-Efficiency Characteristics of Motor');

xlabel('Speed (rad/sec)');

ylabel('Torque (Nm)');
Program Description:
1Here in this program first two inputs were given. They are Speed & Torque using linspace command.
- the motor constant values are assigned namely Copper loss, Iron loss, Windage loss and Constant motor.
- meshgrid is used to evaluate functions of two variables and three-dimensional mesh/surface plots.
- Output Power is calculated by multiplying speed and torque.
- Then all the loss were calculated and the input powers were also calculated.
- Then comes the efficiency were calculated. And Contour graph is plotted between Speed, Torque and Efficiency.
- Title were given and labels were given.
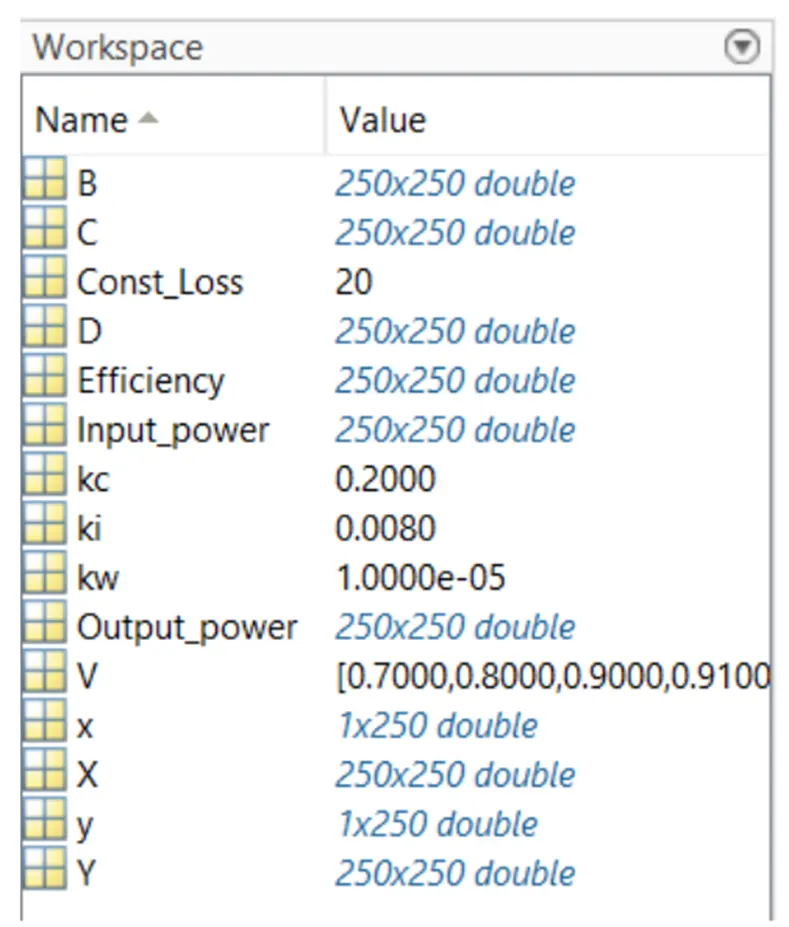
Workspace:
Plot :
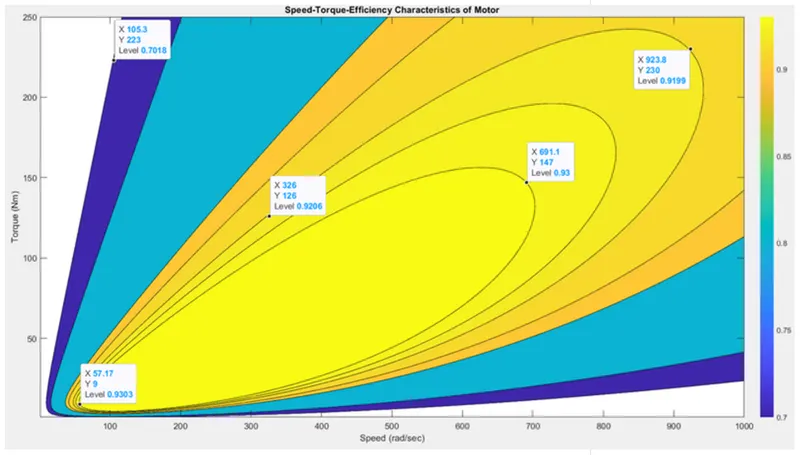
This clearly shows that maximum efficiency of 93% is achieved by 691.1rad/sec and at 147Nm. The lowest Efficiency is achieved at 223 rad/sec and at torque of 105.3Nm .And this Contour plot clearly gives the idea on Speed, Torque and Efficiency relationship of the motor. The color indicates the efficiency denoted in the right side with the colorbar.
CONCLUSIONS:
- For a defined driving cycle, the energy required for braking is calculated.
- Why electric motor can’t develop braking torque at high speed similar to starting and how electric and mechanical brakes are coordinated were discussed.
- A MATLAB program which plots contour of given motor speed, torque and efficiency values is coded.