Week-11 Challenge: Braking
1.
The drive cycle is the plot of speed of a vehicle with time for a given driving condition.To Understand amount of energy required for braking we are considering an Urban dynamometer Driving Schedule(UDDS). The Braking energy can be calculated by use of following formula,
`E_(Brake)=1/2M(V_i^2-V_f^2)`
where, M is the mass of the vehicle,Vi is the inital speed of the vehicle and Vf is the final speed of the vehicle. In case of braking Vi>Vf. The energy of braking is lost interms of heat to the environment for the conventional IC engine vehicle but for hybrid and electriv vehicle some amount of energy can be recovered by the process called regenerative braking.Figure 1 shows the the UDDS drive cycle.In the figure we can see that the vehicle is frequently brake.
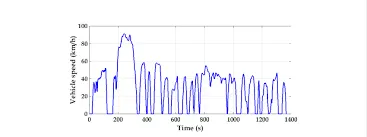
Figure 1: UDDS drive cycle.
For Calculation Lets us consider the weight of a vehicle(Including the driver and payload )=1200 kg
Now excel software is used for the calculation of the braking energy.
Figure 2 shows the excel sheet window used calculation:
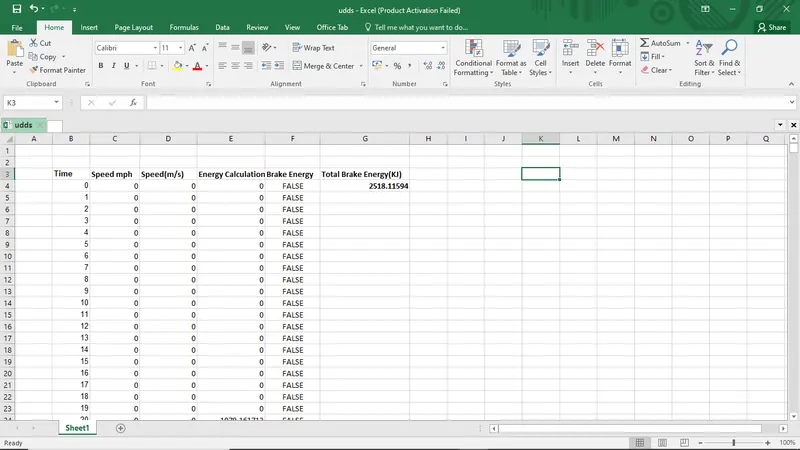
From above calculation we can get the total amount of energy required for braking is 2518.11594 KJ
2.
To understant why motor cannot develop the enough braking torque we have to understand the torque and speed characteristics of an electric motor.Figure 3 shows the torque and speed characteristics of an electric motor.
Figure 3: Torque and Speed characteristics of an electric motor.
We can observe from above that electric motor delivers constant torque for certain speed range and after that its torque starts to reduce with increase in speed. The point from which the speed starts to reduce is called as corner speed. After this speed the power of the motor will be constant. The decrease in the speed is due to the flux weakening after the corner speed. Now lets us consider the motor is running speed below 5000. The maximum torque from the motor is higher than 150Nm. Now consider motor is running above the corner speed,lets say 10000.The maximum torque that can be generated from the motor is around 100. Since shows the similar characteristics for braking(Generation) and motoring. We can say that an electric motor can produce the braking torque during stating but arenot able to produce braking torque at high speed.
In an Electric and Hybrid electric vehicle, both conventional brakes and electric brakes are used. Conventional brakes are the frictional brakes, where the braking action takes place by contacting the surface. Where as electric braking is done by the motor itself when driver moves the foot from the acclerator pedal.Based on the types of brake control strategies . the braking system in an electric and hybrid vehicle can be classified as:
- Series Braking system
- Parallel Braking System.
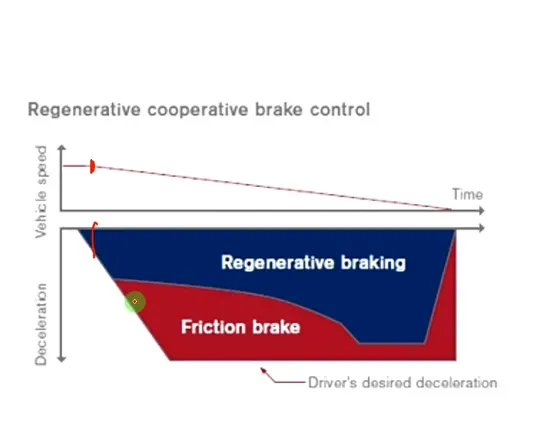
In series braking system,both regenerative braking and mechanical brakes are applied one after another,while in parallel braking system both the brakes are applied at same time. To understand how does the mechanical and electric brakes are coordinated let understand figure 4a and 4b.
a) b)
From above we can see that,when the braking torque is higher we are using the friction brakes more than the regenerative braking. As discussed earlier, electric motor wonot be able to produce higher braking torque demand at high speed.When the speed of the vehicle starts to reduce we can see that amount of barking torque produced by the regenerative braking is also started to increase.which is due to the characteristics of an electric motor as discussed earlier.In figure 4b also we can see that the ratio of Regenerative braking and Friction brake at higher speed is lower when compared with the ratio at the lower speed of the vehicle. The ratio of braking is control by a brake controller based on control algorithms. We can also observe that while stoping the vehicle friction brakes are used more.
3.
In an electric motor there are mainly four types of losses which are as follow:
- Copper losses
- Iron losses
- Windage losses
- Constant losses
Copper losses are generally occured to the flow of current in the winding of motor either stator or rotor. With the change in the current flow the copper losses also changes. Mathematically,
Copper losses=`K_cT^2` where T is the toruqe produce by the motor and Kc is the copper losses constant.
Iron losses are also called as magnetic losses. They are generally caused by magnetci field which generated eddy current,hystersis etc.Mathematically, iron losses can be calcultaed as,
Iron losses:`K_iw` where, Ki is the iron loss constant and w is the spped of the motor in rpm.
Windage losses is the combination of losses due to drag forces created between the rotor and fluid around its surrounding along with frictional losses in the winding. Mathematically,
Windage losses:`K_ww^3` where,kw is the windage loss constant and w is the speed of the motor in rads-1
constant losses are all the other losses other than above mentioned losses.
Output power from the motor=T.w .
Input power=Output power+Iron losses+copper losses+windage losses +constant losses
Efficiency of the Motor: Output power/Input power
To plot the efficiency contour we have assumed above mentined constant and created an array for torque and speed for certain range. The 1D array of torque and speed is converted to 2D by the use mesh grid and by using the contour command contour plot is created.
Matlab Script:
close all
clear all
clc

%Parameters of a motor
kc=0.2; %Copper loss constant
ki=0.008; %Iron loss constant
kw=0.00001; %Windage loss constant
Cons=20; %Constant loss

%Creation of torque and speed array
t=linspace(1,250); %1D torque array
w=linspace(1,1000); %1D speed array

%Converting 1D to 2D
[T,W]=meshgrid(t,w);

%Power calculation
P_out=W.*T; %power=speed *Torque

%losses
L_c=(T.^2)*kc; %Copper losses
L_i=W*ki; %Iron losses
L_w=(W.^3)*kw; %Windage losse

P_in=P_out+L_i+L_c+L_w+Cons; %Input power

eff=P_out./P_in;  %efficiency
contour(W,T,eff,'ShowText','on')
xlabel('Speed rads-1');
ylabel('Torque in Nm');
Output plot:
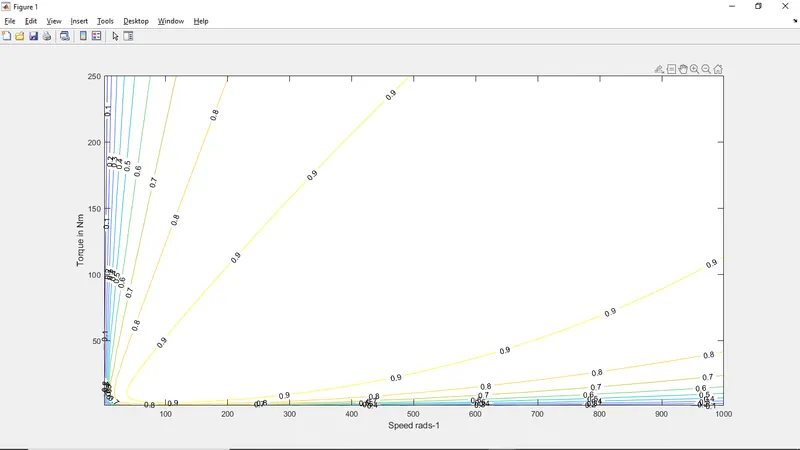
Figure 5: Plot for efficiency,torque and speed for a motor with given losses constant
Figure 5 shows the plot for the efficiency for different torque and speed of the motor. From the plot we can observe that the motor has an maximum efficiency of 90%.