Week-11 Challenge: Braking
1. For a defined driving cycle, calculate the energy required for braking.
kinetic energy = ½ mv2
weight of vehicle = 500kg
velocity of vehicle during initial moment & during destination reached moment.
Vf = final velocity
Vi = initial velocity
For final velocity Vf = 40 km/h
For initial velocity Vi = 0 km/h
Power required to move electric vehicle of mass from 0 km/h to 40 kmh,
Braking power;P
P = [ ½ m ( Vf - Vi )2 ]
P = [ ½ 500 ( 40 - 0 )2 ]
P = [ ½ 500 ( 40 2 )]
P = [ 3200000 ]watt
P = (400) kwatt
Energy required to move electric vehicle of mass from 0 km/h to 40 kmh in time period of T = 20sec.
Energy = power/time;
Energy = 400/20;
E = 20kwh
Braking energy required for braking de-acceleration of vehicle of weight = 500kg, from initial speed of 40 km/h to 0 km/h, in T = 20sec. is 20KWH.
2)Why electric motor can’t develop braking torque at high speed similar to starting? How electric and mechanical brakes are coordinated?
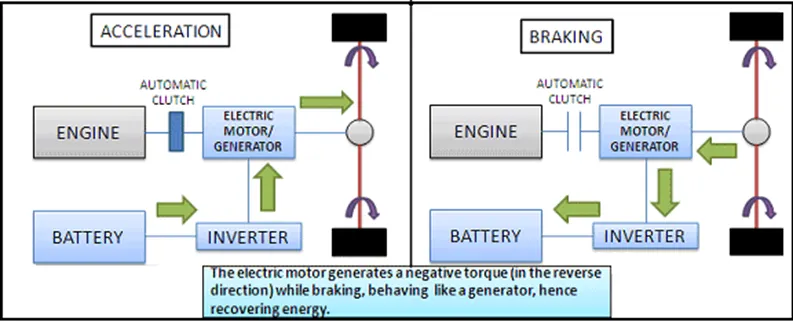
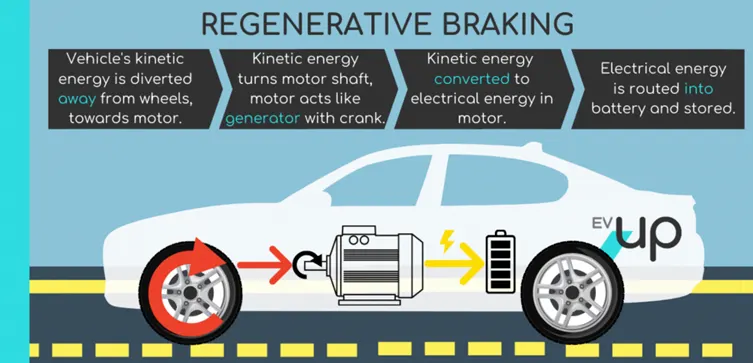
Regenerative braking is a system found in both electric vehicles (EVs) and plug-in hybrid electric vehicles (PHEVs) that recharges your battery by braking.
It’s a simple but effective technology is widely used in electric vehicles and is an efficient way to mitigate the loss of energy while braking.
A moving vehicle creates kinetic energy and when the brakes are applied, this energy must go somewhere.
In a conventional braking system, friction-based disk brakes are used to slow vehicles.
The kinetic energy from the movement of the vehicle is being converted into heat via friction and dissipating into the atmosphere, resulting in a loss.
Regenerative braking is when an electric vehicle’s kinetic energy is harvested through the action of slowing down and is sent back into the battery as usable power.
However, not a lot of power is retrieved in this process and it is often depleted as the vehicle accelerates.
While it does not fully reimburse the power expended to accelerate, regenerative braking is efficient enough to increase an EVs overall range when compared to a similar car with conventional braking systems.
Overall, regenerative braking is not designed to make a car more efficient; it is designed to make it less inefficient.
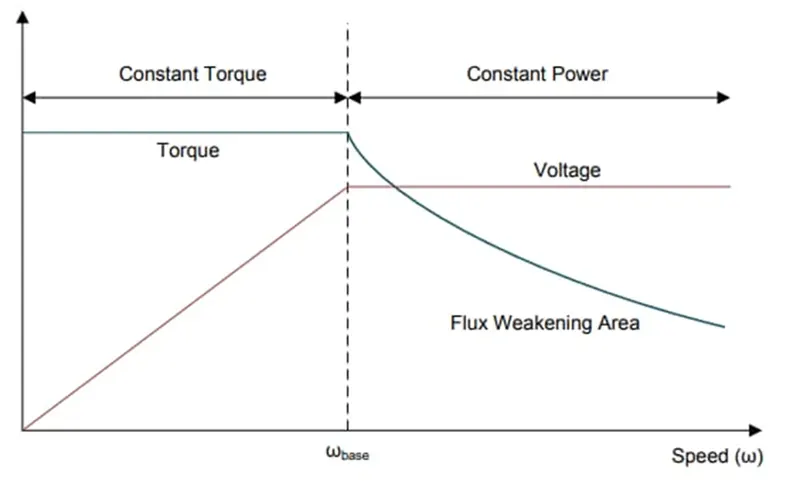
lets analyse the constant power region in electric motor.
During initial low speed high & constant torque is observed by motor.
During increase in time torque reduces at critical speed, and after that motor operates in constant power region.
But at the stopping time,
The scenario is opposite, speed is already high and torque is low.
To gain regenerative braking torque, that much amount of torque is insufficient.
Now first we have to reduce the speed.
To gain some torque for regenerative braking.
That’s Why electric motor can’t develop braking torque at high speed similar to starting….
Brake control strategies with reference to both electric & mechanical brakes…
When the brake is applied, both brakes come into action according to the position of torque speed characteristics and the defined algorithm for braking phenomena.
- Series braking:
Braking is not applied at once, instead one after another.
- Parallel braking:
Both brakes are applied which will help to reduce the braking time.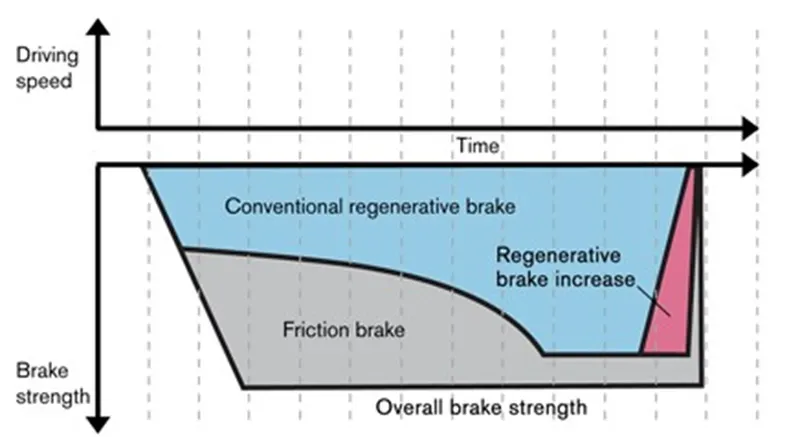
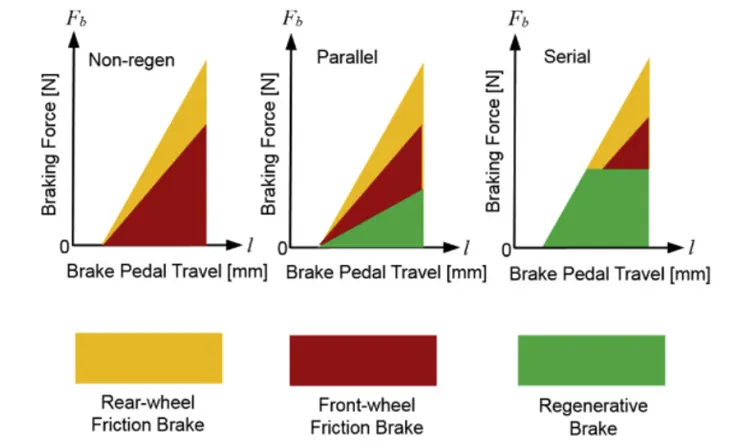
Rear wheel friction brake > front wheel friction brake > regenerative brake……
3.)Make a MATLAB program which plots contour of given motor speed, torque and efficiency values. Attach the code as a .m file attach a screenshot of all the plots.
%contour for Efficiency
x = linspace(1,50000);%speed
y = linspace(1,50000); %torque
kc = 0.2;
kw = 0.00001;
ki = 0.008;
conl = 20;
[x,y] = meshgrid(x,y);
outpower = (x.*y);
copper_loss = (y.^2)*kc;
iron_loss = (x.*ki);
windage = (x.^3)*kw;

input_power = outpower + copper_loss + iron_loss + windage + conl;
E = (outpower./input_power);
% efficinecy values
v = linspace(0.65,0.95,10);
box off
grid off
contour (x,y,E,v);
xlabel('speed'),ylabel('torque'); 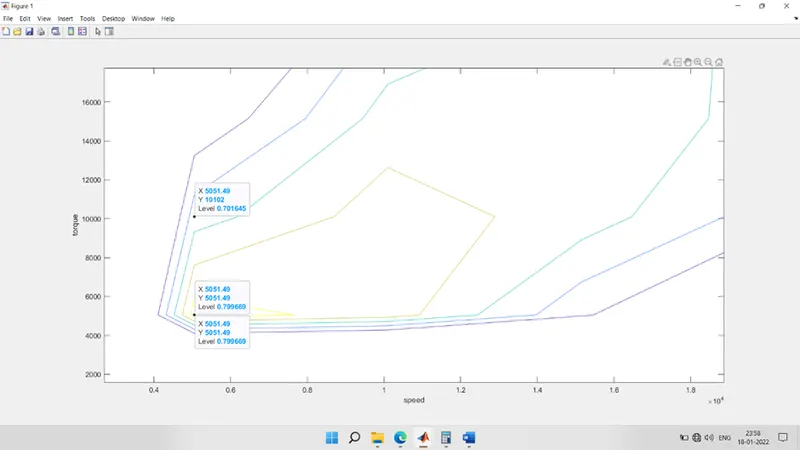
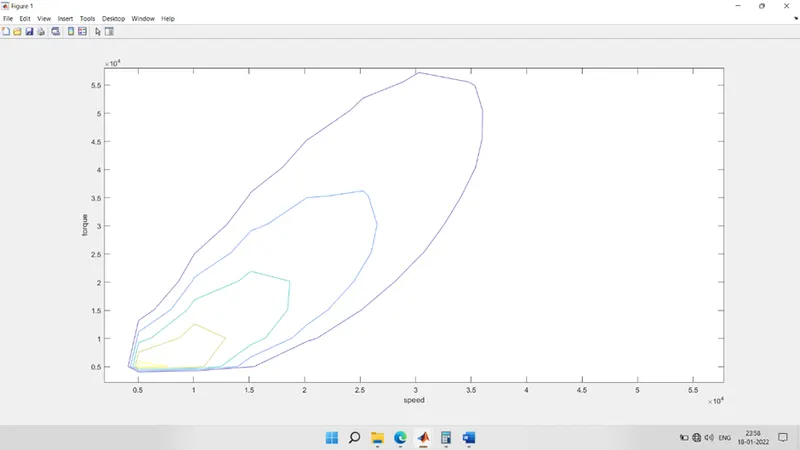
The above plot shows motor speed torque characteristics efficiency plots.
The innermost contour line is having highest ever efficiency.
Contour shows the maximum height and point in that same group of efficiencies.
With increase in efficiency the contour also grow inside, similarly the contour showing outermost line is having lowest efficiency.