Week-11 Challenge: Braking
1. For a defined driving cycle, calculate the energy required for braking.
-
Electrical vehicles requires some energy to stop the vehicle at any instant of time, this energy is called braking energy.
There are two types of braking
- Electrical braking
- Mechanical braking
This two braking's are required to halt the vehicle from a given speed to zero speed
Energy required for a braking = 0.5 * mass * velocity ^2
Let us consider the drive cycle given below for calculating the energy required for braking.
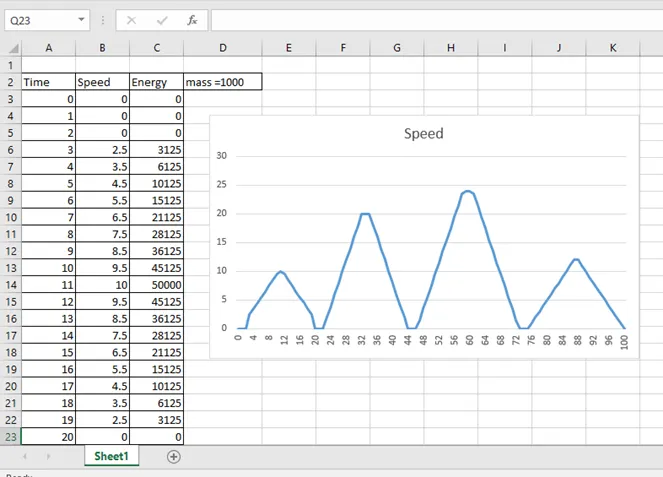
In this graph, we have considered a drive cycle for a vehicle with mass 1000kg. The braking energy required by the vechicle at each speed points is calculated by the equation:
Energy required for a braking = 0.5 * mass * velocity ^2
Also for calculating, the total energy required the vehicle for breaking, sum up the decelerating energies.
In this case the decelerations are:
- 10mps to 0mps = 50kJ(from table)
- 20mps to 0mps = 200kJ(from table)
- 24mps to 0mps = 288kJ(from table)
- 12mps to 0mps = 72kJ(from table)
Therefore, the Total Braking Energy required by the vehicle = 50+200+288+72 = 610kJ
- There are two major reasons for a motor developing higher starting torque compare to braking.
- Due To Transients:
At starting the motor draws a large current due Transient. As torque is proportional to square of current, therefore torque value is also high at this moment. When we applies brakes to motor at that time current value is within the range therefore Torque values is also within the range.
- Torque speed characteristic:
From Torque speed characteristic when speed increases torque should decrease to maintain power constant. At the time of starting speed is very low therefore Torque value is very high. At the time of braking, speed value is high therefore torque value will be low. Therefore at the time of braking torque value available will be lower.
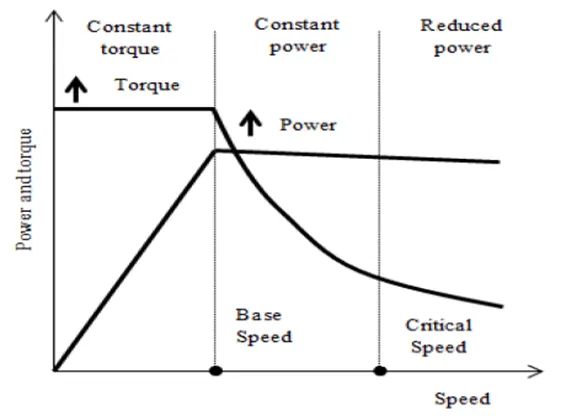 Here it is clearly shown in the graph that till the motor reaches the critical speed it has constant torque and once it reaches the critical speed, the curve is having a down slope which is a constant power region. And this graph denotes the accelerating operation of the motor. For the deceleration or braking operation of the motor, this graph is mirrored down which will be having the speed (+ve) and torque (-ve).
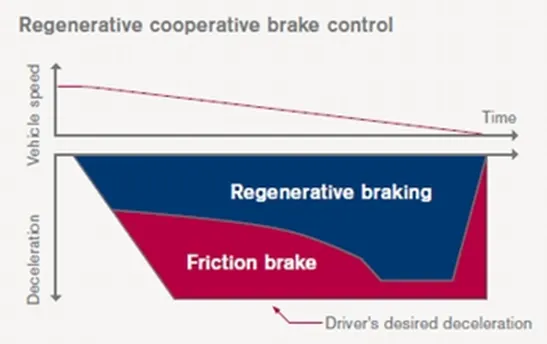
Electric and mechanical brakes are coordination:
There are two brake control strategies namely, SERIES & PARALLEL.
- SERIES
Brakes will be applied one after the another so which they are connected in series. Either one brake stragety at a time either Regenerative braking or Mechanical braking at a time.
- PARALLEL
In case of parallel, both the brakes are applied simultaneously.
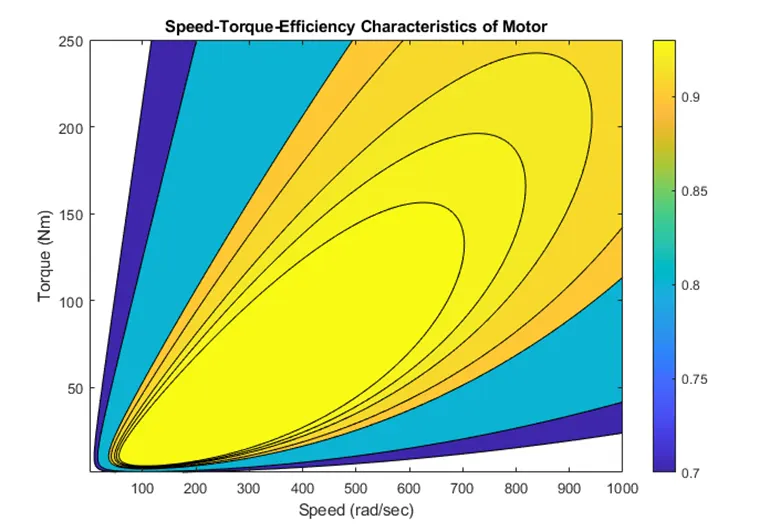
- MATLAB program which plots contour of given motor speed, torque and efficiency values
Script:
%The x axis corresponds to motor speed(w),
%and the y axis to torque T.
%First set up arrays for range

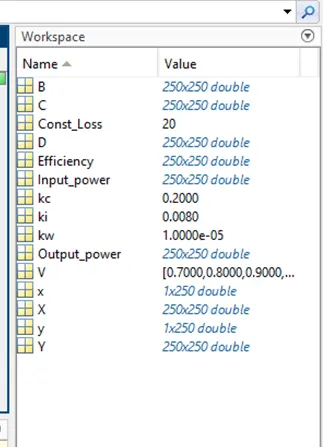
x=linspace(1,1000,250); %Speed in rad/sec
y=linspace(1,250,250); %Torque in Nm

%Motor loss constants
kc = 0.2; %Copper loss constant
ki = 0.008; %Iron loss constant
kw = 0.00001; %Windage loss constant
Const_Loss = 20; %Constant motor loss

%Now make a mesh
[X,Y] =meshgrid(x,y); %Converting to 2D
Output_power = (X.*Y); %Power = Torque x Speed

B= (Y.^2)*kc; %Copper loss
C= X.*ki; %Iron loss
D= (X.^3)*kw; %Windage loss

Input_power = Output_power + B + C + D + Const_Loss;
Efficiency = Output_power./Input_power; %Eff of the motor

%We noe set the eff for which a contour will be plotted.

V = [0.70,0.80,0.90,0.91,0.92,0.925,0.93]; %Efficiencies to be plotted
box off
grid off
contourf (X,Y, Efficiency, V);
contourcbar
title('Speed-Torque-Efficiency Characteristics of Motor');
xlabel('Speed (rad/sec)');
ylabel('Torque (Nm)');
Program Description:
- Here in this program first two inputs were given, they are Speed & Torque using allocated by linspace command.
- Then the motor constant values are assigned namely Copper loss, Iron loss, Windage loss and Constant motor
- Then mesh grid is used to evaluate functions of two variables and thuce-dimensional mesh/surface plots.
- Output Power is calculated by multiplying speed and torque.
- Then all the loss were calculated and the input powers were also calculated
- Then comes the efficiency were calculated. And Contour graph is plotted between Speed, Torque and Efficiency.
- Title were given and labels were given
Results: