Dynamic explicit analysis of Car Crash simulation using ANSYS Workbench
AIM: To perform dynamic explicit analysis of a car crash simulation using ANSYS Workbench.
PROCEDURE:
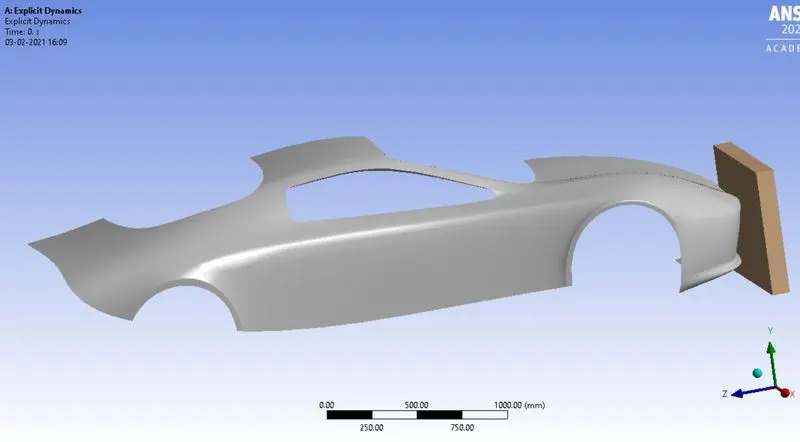
The reduced car model along with a rigid wall was imported into ANSYS and the geometry is shown below:
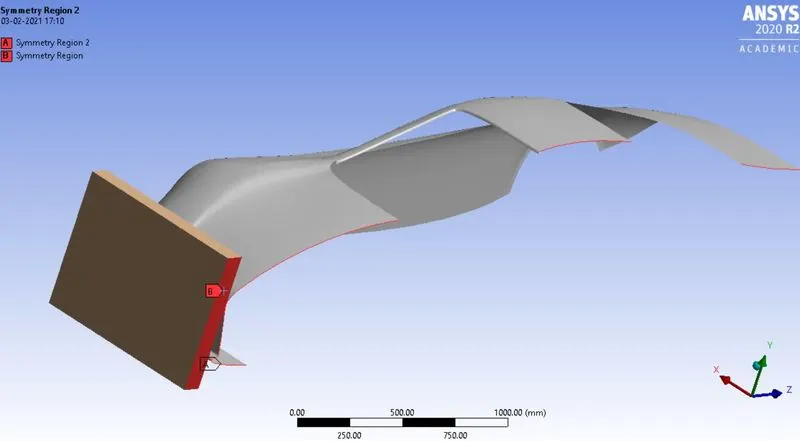
A symmetric condition normal to x-axis was given to the two bodies as shown below:
The car body was given material Stainless Steel Non-Linear whereas the wall was given a rigid condition. The mesh is shown below:
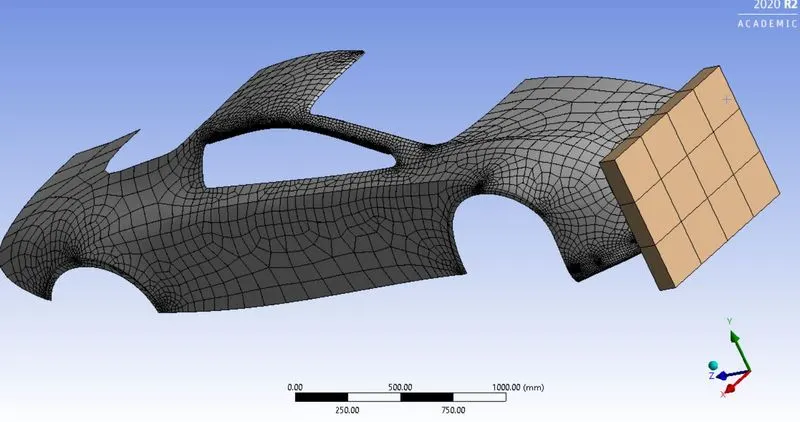
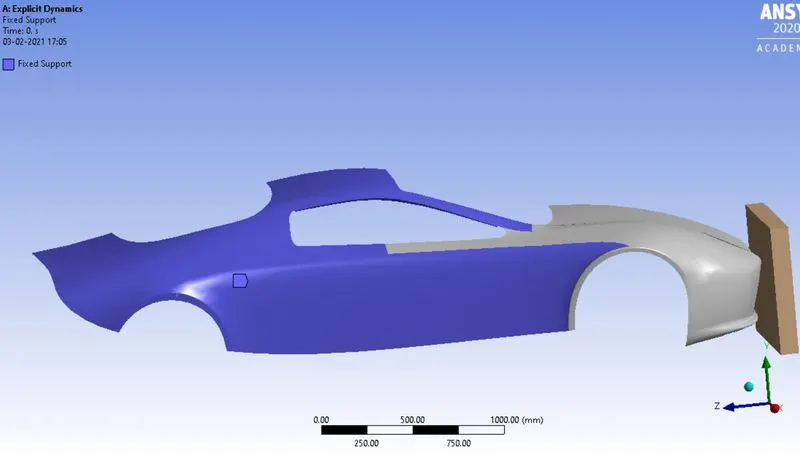
The mesh given is relatively coarse due to the computational limitations of the computer used for the analysis. The car body was given fixed support as shown below:
The displacement condition of 500 mm towards the car body was given to the rigid wall as shown below:
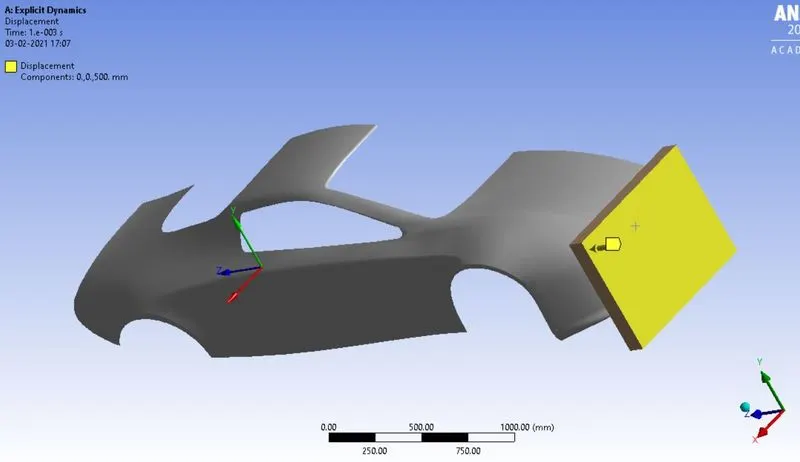
The simulation was solved for three different thicknesses for the car body.
CASE 1: Thickness = 0.3 mm:
The thickness of the car body was given as 0.3 mm and the stress contour is given below:
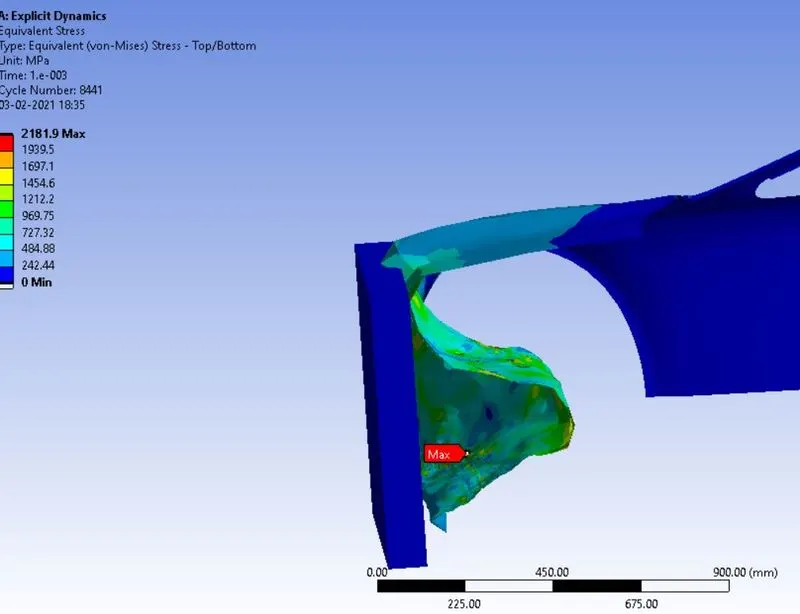
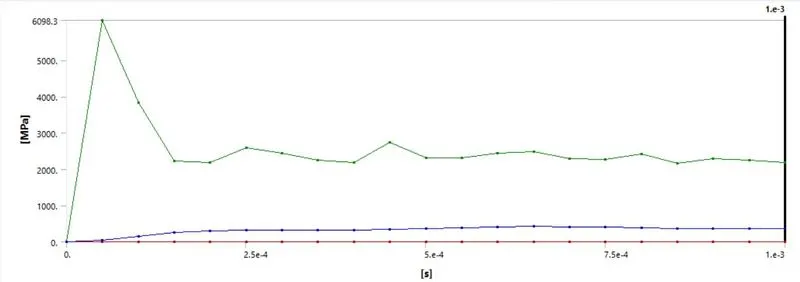
Maximum stress was observed to be 6098.3 MPa and the variation with time is plotted below:
The deformation contour is given below:
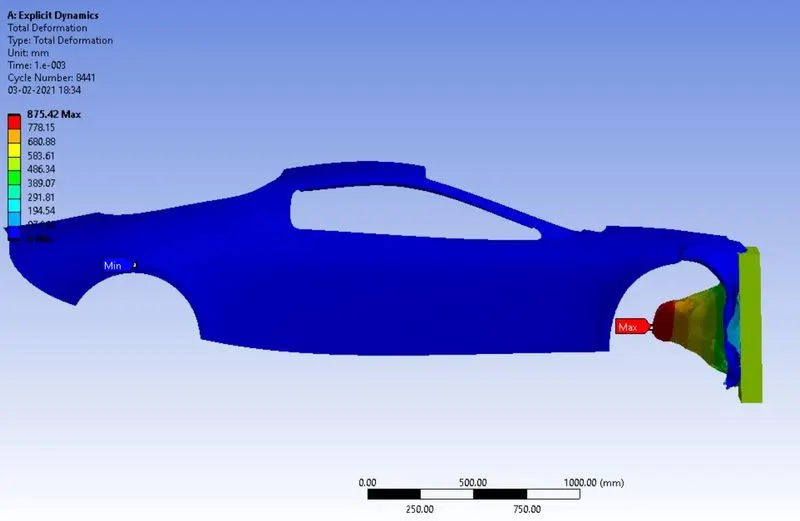
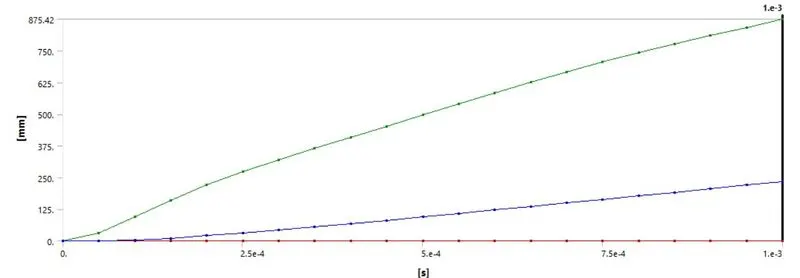
Maximum deformation was observed to be 875.42 mm and its variation with time is plotted below:
CASE 2: Thickness = 0.5 mm:
The thickness of the car body was changed to 0.5 mm and the simulation was solved. The stress contour is given below:
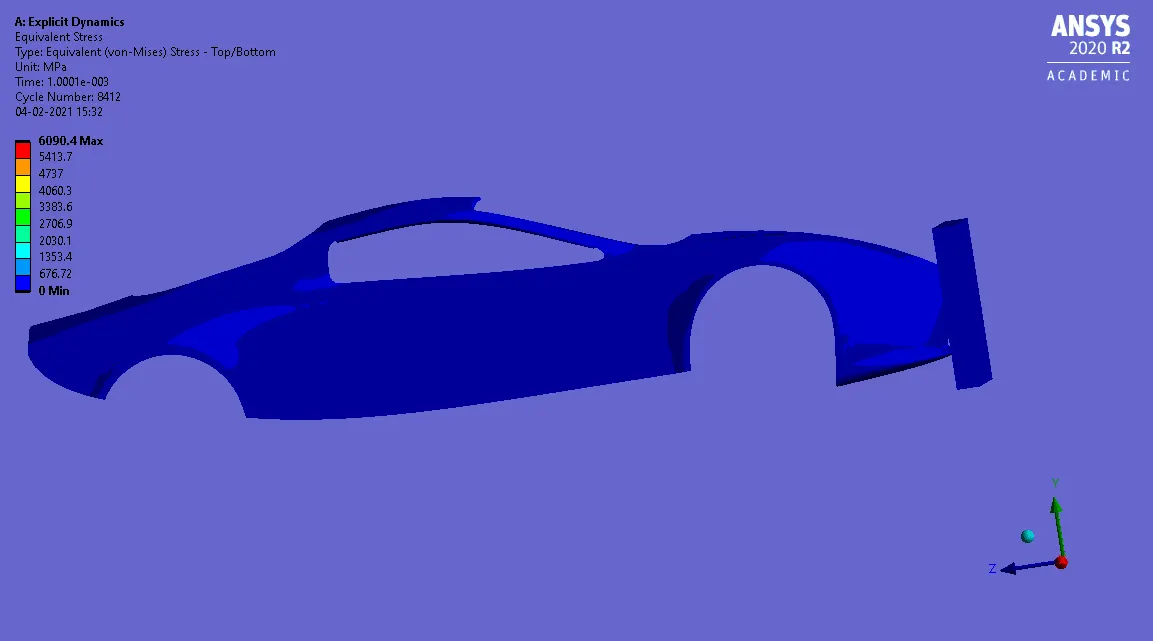
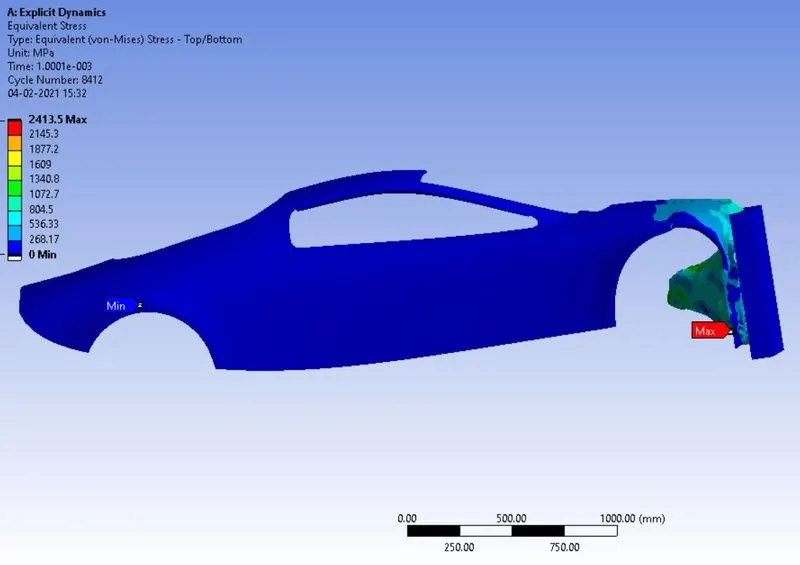
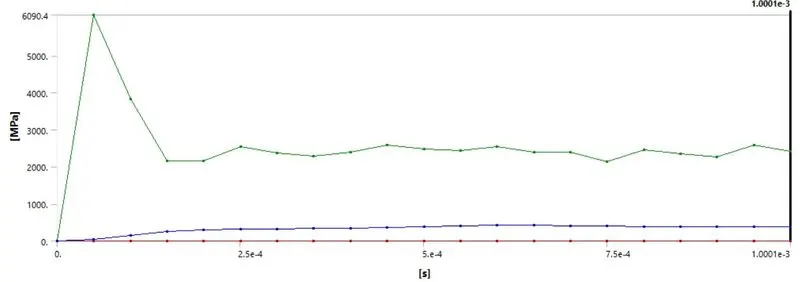
The maximum stress was observed to be 6090.4 MPa. The variation with time is plotted below:
The deformation contour is shown below:
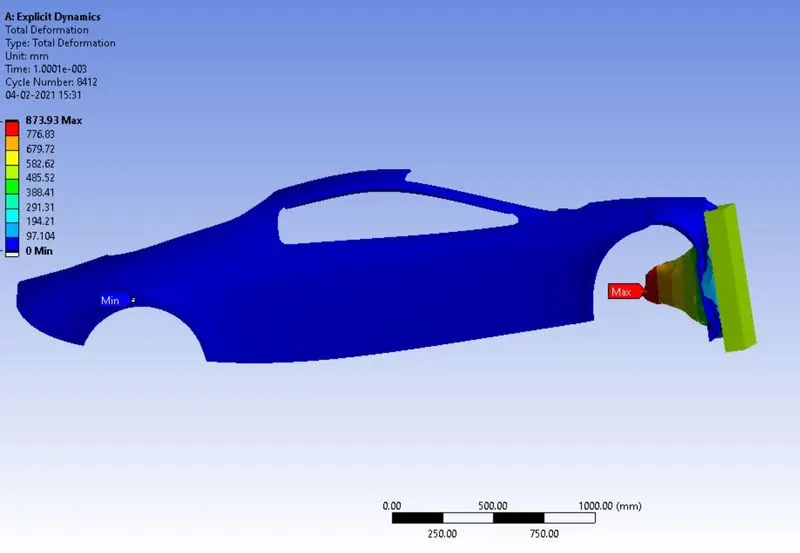
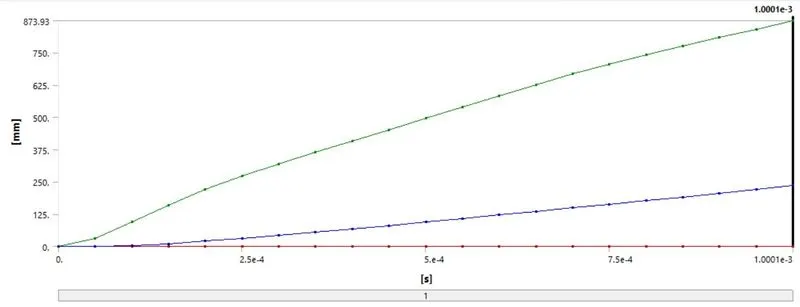
The maximum deformation was observed to be 873.93 mm and its variation with time is plotted below:
CASE 3: Thickness = 0.6 mm:
The thickness of the car body was changed to 0.6 mm and the simulation was solved. The stress contour is shown below:
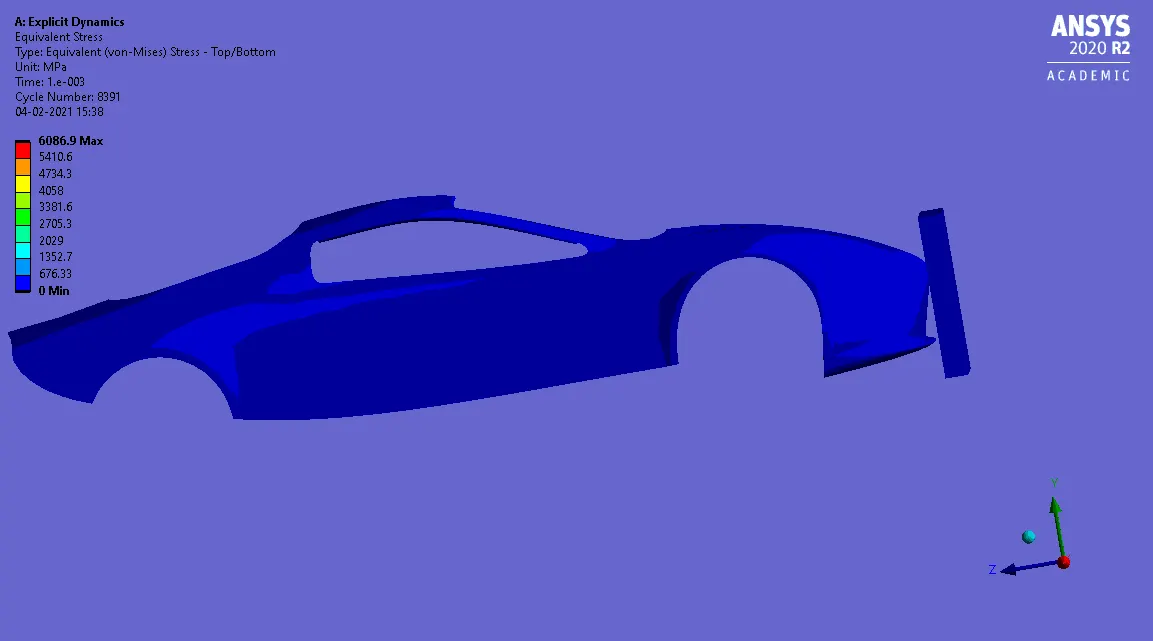
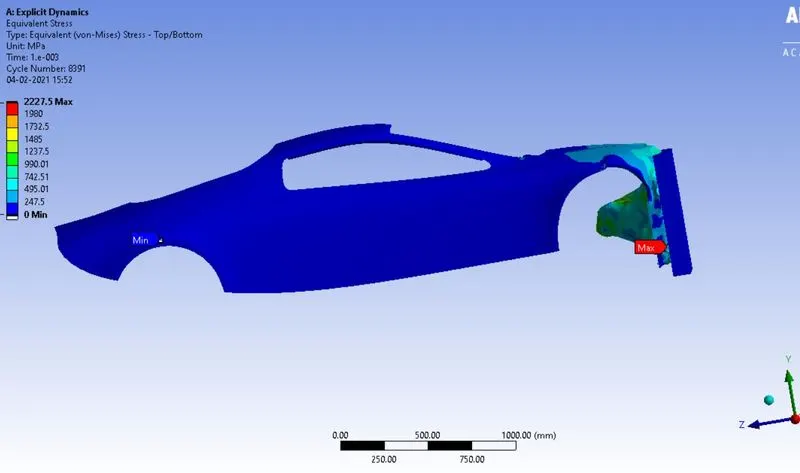
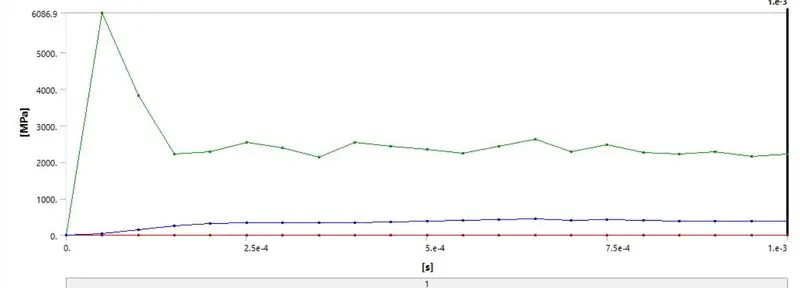
The maximum stress observed is 6086.9 MPa and its variation with time is plotted below:
The deformation contour is given below:
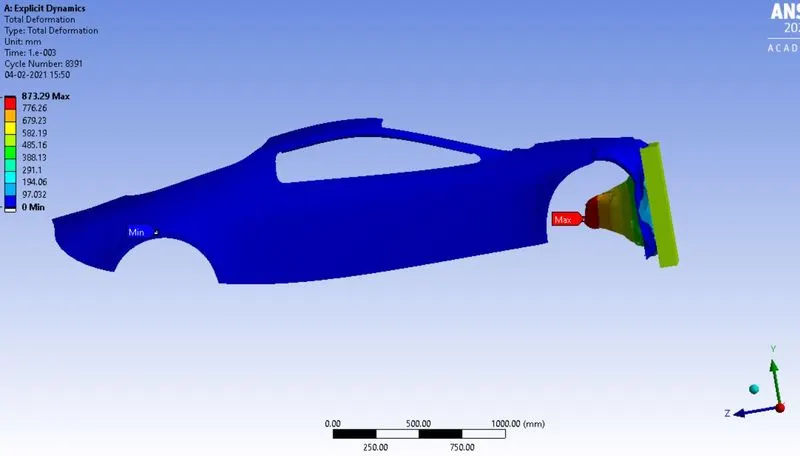
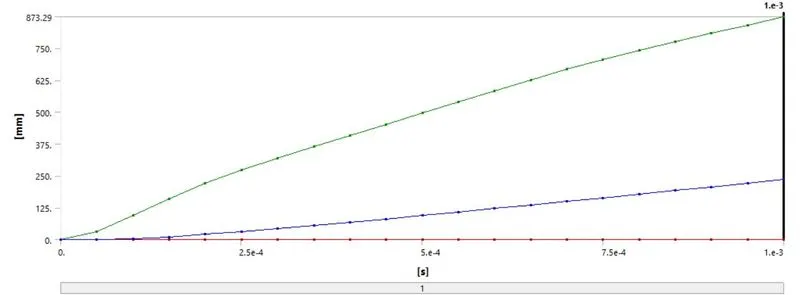
The maximum deformation is observed to be 873.29 mm and its variation with time is plotted below:
The results from the three cases can be summarized below:
|
Car Body Thickness |
Max Deformation |
Max Stress |
|
0.3 mm |
875.42 mm |
6098.3 MPa |
|
0.5 mm |
873.93 mm |
6090.4 MPa |
|
0.6 mm |
873.29 mm |
6086.9 MPa |
As can be seen from the above table, variation in thickness did not significantly affect deformation. Maximum stress reduced when thickness was increased. Increasing thickness leads to an increase in the cross-sectional area which therefore reduces stress induced if the force remains the same. However, the increase in the cross-sectional area leads to higher rigidity and therefore for the same deformation, higher stress needs to be applied. Therefore, there is a trade-off being made. Of course, the coarse mesh due to computational limitations also limits the accuracy and hence increases the dependency on approximations and therefore the results cannot be completely justified.
For a properly justified simulation to be conducted on the crash analysis of a car, the following changes have to be made to the simulation:
1. Make the mesh finer especially in the region where contact occurs between the car and the wall. This can be done in the non-academic version and is feasible in computers with high-end CPUs.
2. Standardize the simulation according to various standards such as FMVSS, ECE, IIHS, etc
CONCLUSION: The dynamic explicit analysis of car crash was successfully completed and the results were tabulated and compared quantitatively.