Week 11 Car Crash simulation
Explicit Dynamics Analysis of Car Crash simulation
Objective
To perform a Expicit Dynamics Simulation of Car Crashing in parametric analysis approach for three different thickness Cases on Car body ,they are taken as
Case 1: 0.3 mm
Case 2: 0.4 mm
Case 3: 0.6 mm
To Find
- Total deformation
- Equivalent stress
To Deliver
- Compare these results from all three cases.
Material data
Figure. 1 shows the Structural steel's properties in Ansys Workbench engineering data. It was used in the Car Crash model's as material input for wall body.
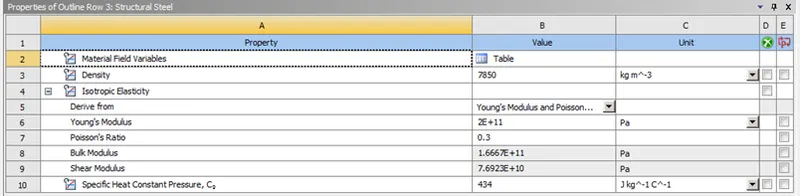
Figure. 1 Structural steel Engineering data.
Figure. 2 shows the Structural steel NL's properties in Ansys Workbench engineering data. It was used in the Car Crash model's as material input for car body for car body.
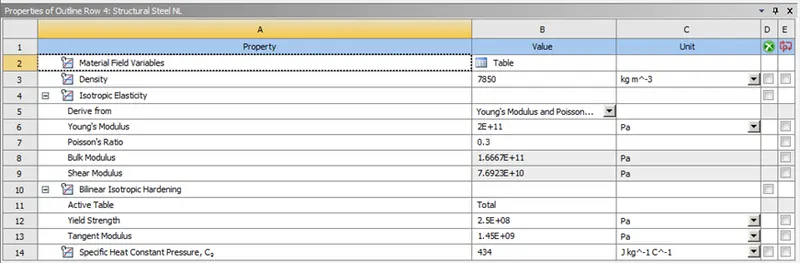
Figure. 2 Structural steel NL Engineering data.
Model Geomentry
Figure. 3 shows the imported given Car Crash model in the mechanical modular.
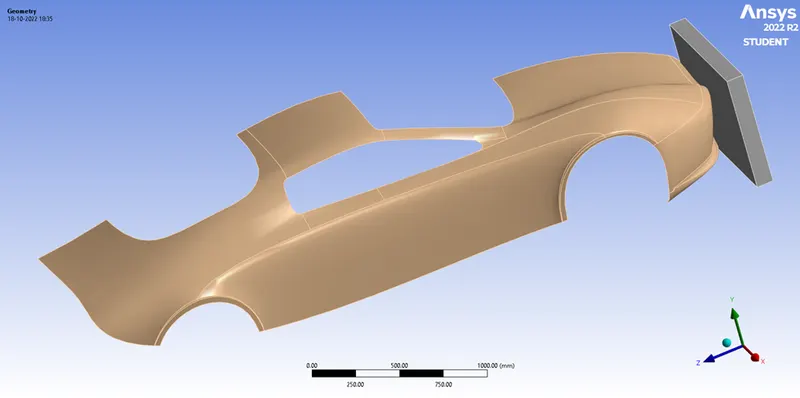
Figure. 3 Car Crash model
Meshing
Figure. 4 illustrates the model is Default meshed of a element size 30 mm with no Adaptive sizing and medium smoothing quality.
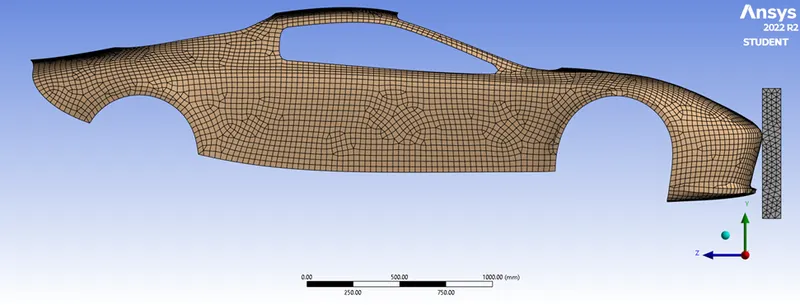
Figure. 4 Overall meshed model
Symmetry Region
Figure. 5 illustrates the Car body symmetry edges in the X-axis, overall symmetry edges of car body are 7. Figure. 6 illustrates the Wall body symmetry face in the X-axis, overall symmetry face of car body are 1.
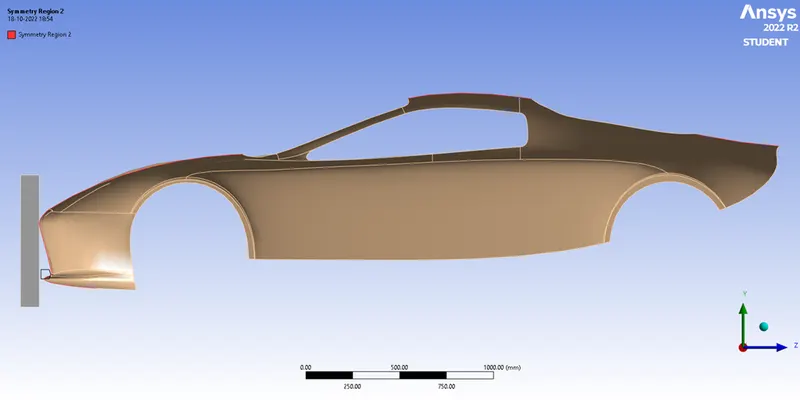
Figure. 5 Car body symmetry edges
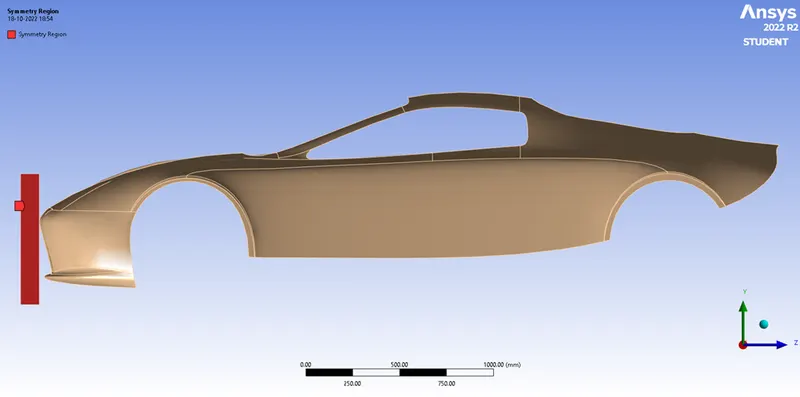
Figure. 6 Wall body symmetry face
Displacement & Fixed joint
Figure. 7 illustrates Fixed joint of the Car body which is assigned to be the back end of the part with 8 faces. Figure. 8 illustrates the dispacement of the Wall body with a value of 500 mm in the positive Z-direction of the global coordinate system.
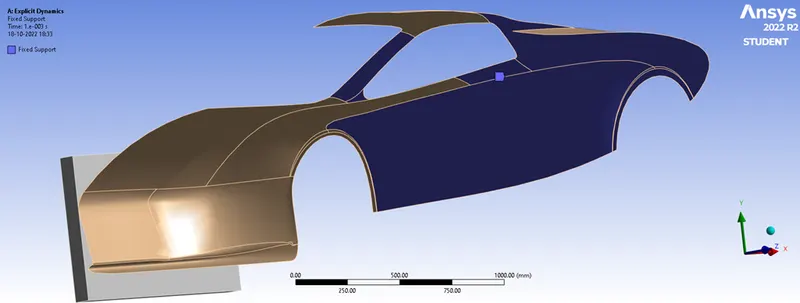
Figure. 7 Fixed joint of the Car body
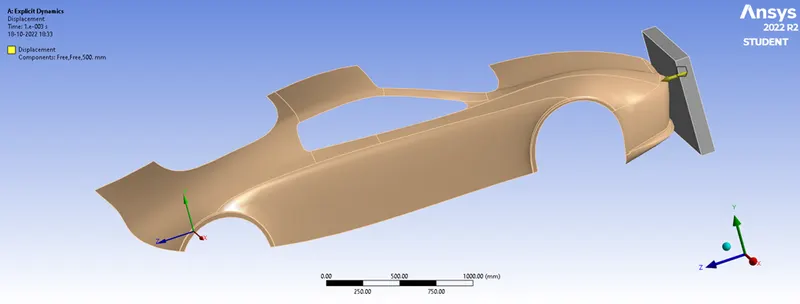
Figure. 8 Dispacement joint of the Wall body
Simulation Results
Case 1
Total Deformation
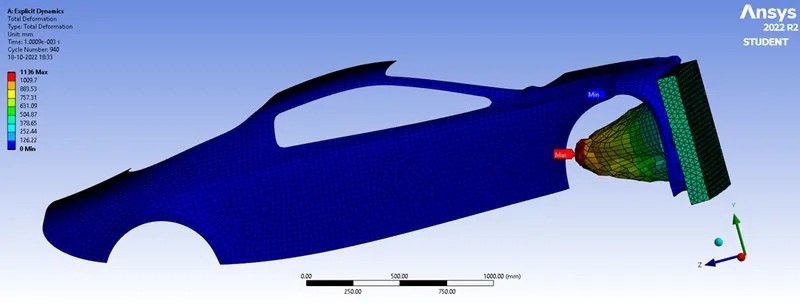
Figure. 9 Total deformation of the model
Equivalent stress
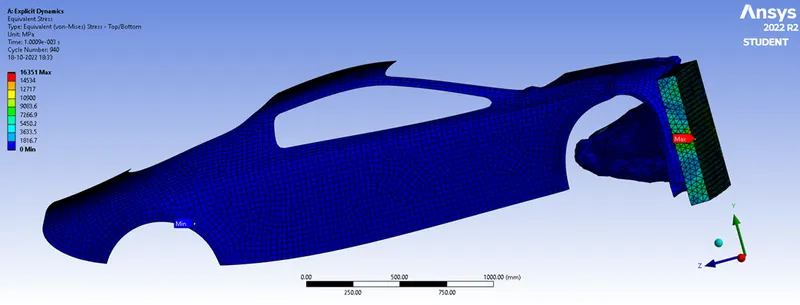
Figure. 10 Equivalent stress ofthe model
Case 2, 3
Parametric analysis
Figure. 11 illustrates the parametric analysis of the car crash model of three different thickness of the car body, that is, 0.3 mm, 0.4 mm and 0.6 mm and the results are obtained according to those three thickness (Equivalent stress and Total deformation are obtained at design points in the parametric analysis).
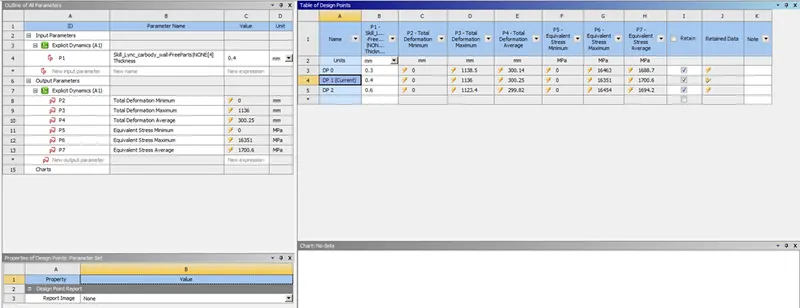
Figure. 11 Parametric analysis results of the car crash model
Comparison of Case 1,Case 2 & Case 3
|
Parameters |
Case 1 (0.3) |
Case 2 (0.4) |
Case 3 (0.6) |
|
Maximum Total Deformation |
1138.5 mm |
1136 mm |
1123.4 mm |
|
Maximum Equivalent Stress |
16463 MPa |
16351 MPa |
16454 MPa |
Conclusion
- Maximum Total Deformation is higher in Case 1 but Maximum Equivalent Stress is almost similar values (value deviation lies between 100 MPa). This shows that Deformation is directly proportional to the thickness of the car body and stress doesn't depends on the thickness but depends on the impacting Crash.
- From these statements the Car body thickness can be arranged as
- Maximum Deformation, Case 1 (0.3) > Case 2 (0.4) > Case 3 (0.6).
- Maximum Stress, Case 1 (0.3) > Case 3 (0.6) > Case 2 (0.4).