Week 10 - Simulating Combustion of Natural Gas.
Combustion phenomena consist of many physical and chemical processes which exhibit a broad range of time and length scales. A mathematical description of combustion is not always trivial, although some analytical solutions exist for simple situations of laminar flame. Such analytical models are usually restricted to problems in zero or one-dimensional space.
Combustion models for CFD refers to combustion models for computational fluid dynamics. Combustion is defined as a chemical reaction in which a hydrocarbon fuel reacts with an oxidant to form products, accompanied with the release of energy in the form of heat. Being the integral part of various engineering applications like: internal combustion engines, aircraft engines, rocket engines, furnaces, and power station combustors, combustion manifests itself as a wide domain during the design, analysis and performance characteristics stages of the above-mentioned applications.With the added complexity of chemical kinetics and achieving reacting flow mixture environment, proper modeling physics has to be incorporated during computational fluid dynamic (CFD) simulations of combustion. Hence the following discussion presents a general outline of the various adequate models incorporated with the Computational fluid dynamic code to model the process of combustion.
Eddy breakup model: This model is used when turbulent mixing of the constituents has to be taken into consideration. The k/Ɛ turbulent time scale is used to calculate the reaction rate. A comparison between the turbulent dissipation rates of the fuel, oxidant and products is done and the minimum amongst all is taken as the rate of the reaction. The transport equations for the mass fractions of the constituents are solved using this rate of reaction. Apart from this a mean enthalpy equation is also solved and temperature, density and viscosity are calculated accordingly. The model can also be implemented when finite rate kinetically controlled reaction is to be simulated. In such situation while deciding the rate of the reaction the Arrhenius kinetic rate expression is also taken into account and the rate of reaction is taken as minimum amongst the turbulent dissipation rates of all the constituents and the Arrhenius kinetic rate expression.
Laminar flamelet model: This model approximates the turbulent flame as a series of laminar flamelet regions concentrated just around the stoichiometric surfaces of the reacting mixture.This model exploits the use of experimental data for determining relations between the variables considered like mass fraction, temperature etc. The nature and type of dependence of the variables is predicted through experimental data obtained during laminar diffusion flame experiment and laminar flamelet relationship is deduced based on the same. These relationships are then used to solve the transport equations for species mass fraction and mixture composition. The model can very well be implemented for situations where concentration of minor species in the combustion is to be computed like quantifying the generation of pollutants.
The basic equation which is followed is :
`CH_4 + a_r(O_2 +3.76*N_2) = a*CO_2 + b*H_2O + c*N_2`
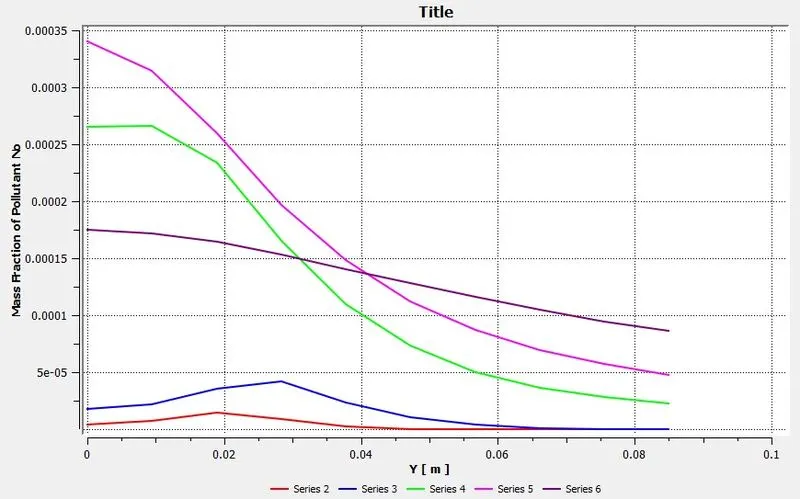
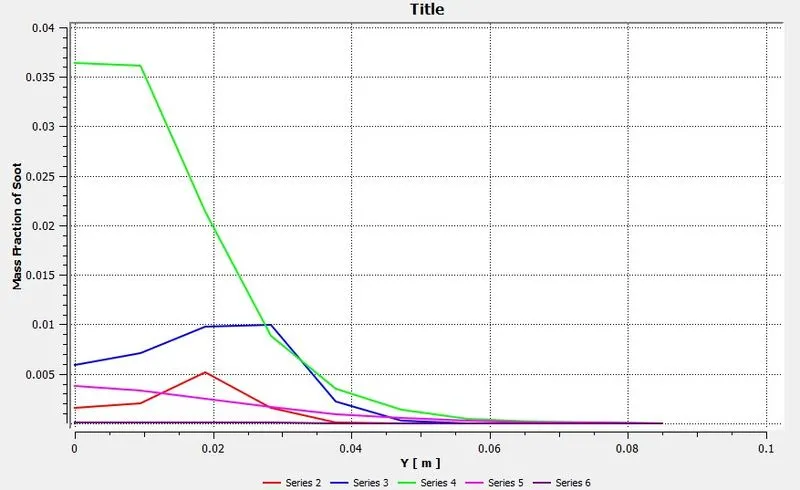
Task1: Perform a combustion simulation on the combustor model and plot the variation of the mass fraction of the different species’ in the simulation using line probes at different locations of the combustor as shown in Fig. You need to plot for CO2, H2O, CH4, N2, O2, NOx emissions & Soot formation.
The 3D geometry of the doamin is given as below
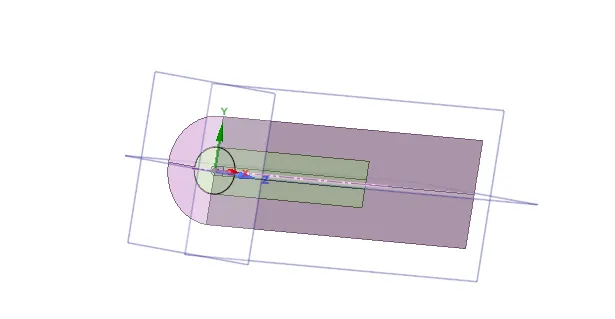
This geometry is considered to be Axisymmetric about X-axis so we convert it into a 2d plane and complete the analysis: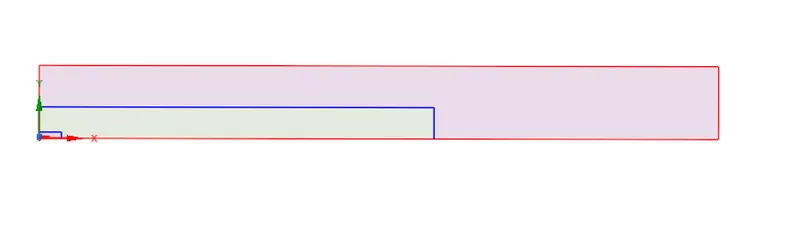
Meshing:
The meshing size is selected to be 5mm and the triangular mesh is selected and other options are:
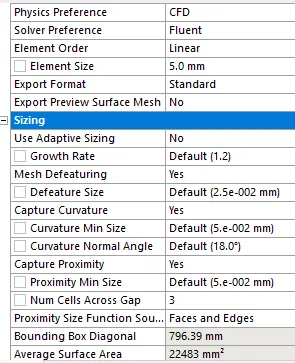
The mesh output is given as:

Different areas are given as named selection as :
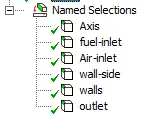
Setup:
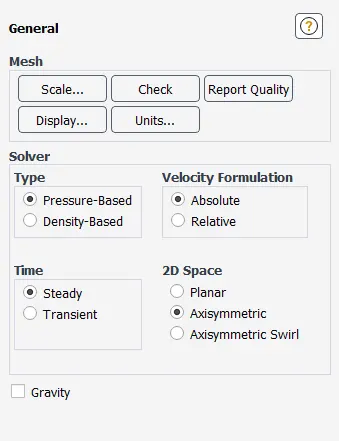
Axisymmetric space is selected and energy equation is turned on:
K-epsilon turbulence model is selected-
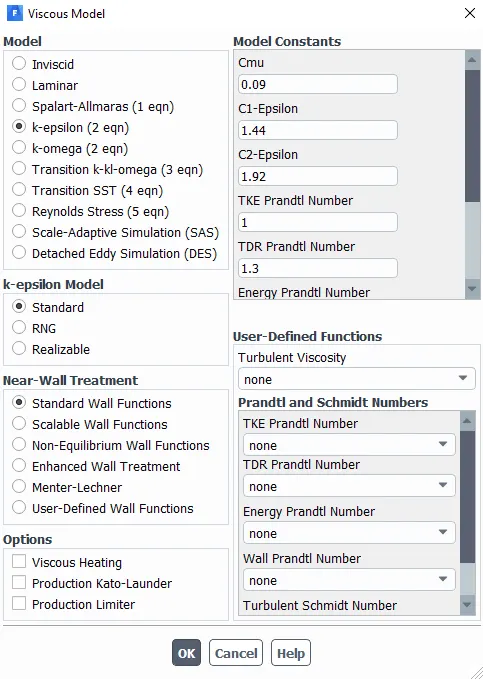
In the species- Species transport model is selected with volumetric reactions and inlet diffusion term is turned on. Material Methane-air is selected. and eddy dissipiation is selected.
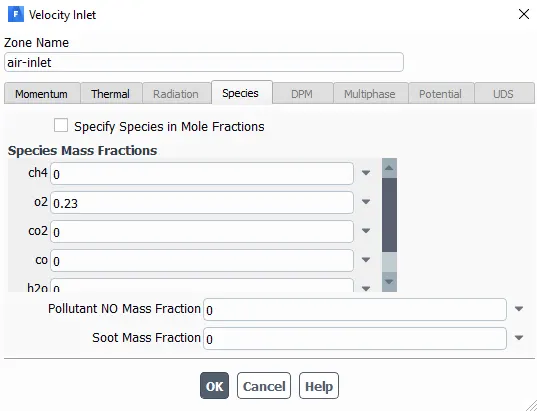
For the air inlet velocity of 0.5 m/s is selected and species as follows:
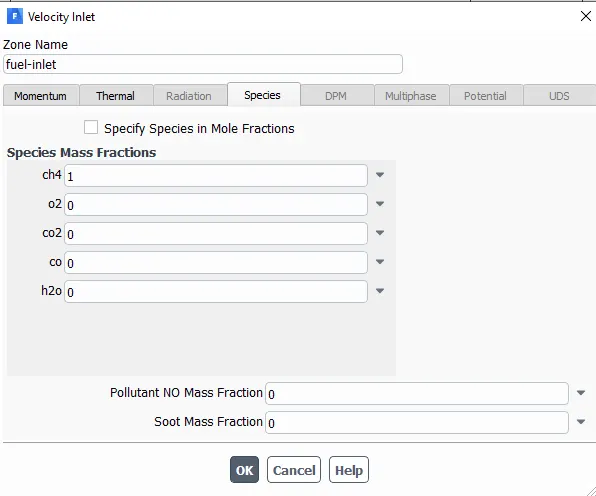
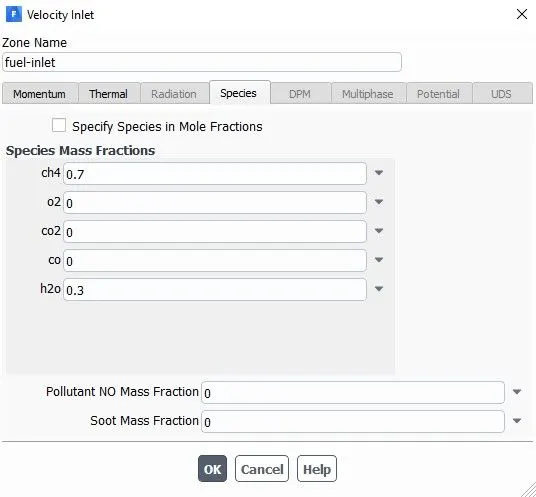
For the air fuel velocity of 80 m/s is selected and species as follows:
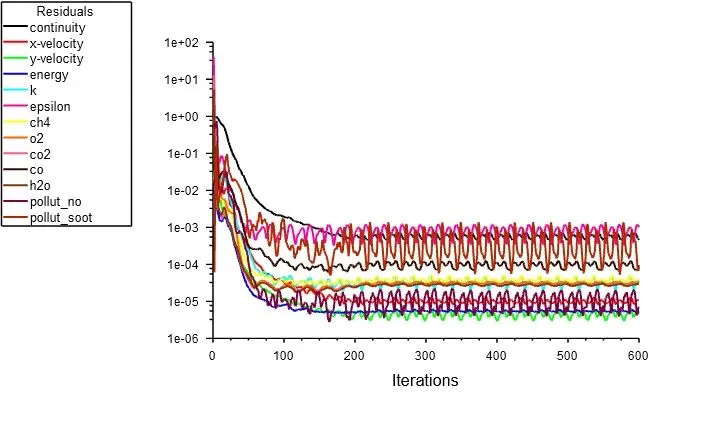
With hybrid initialisation and 600 iterations output obtained is:
Residuals plot:
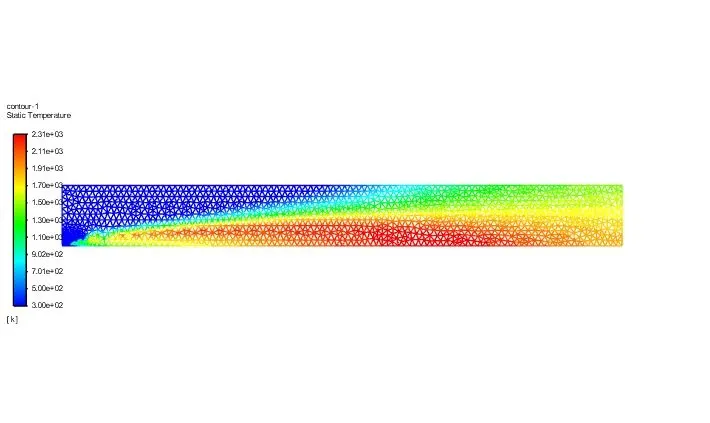
Post Processing:
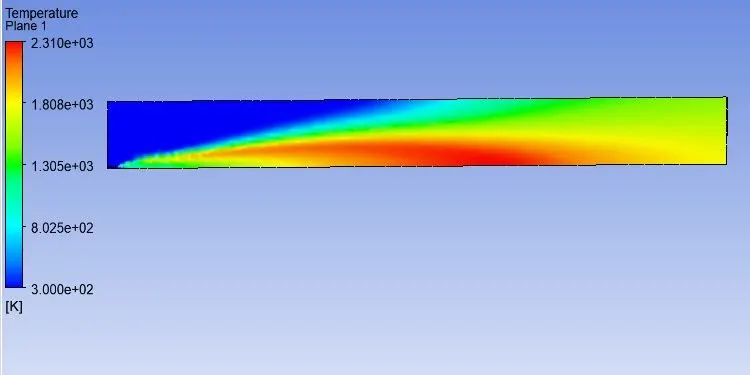
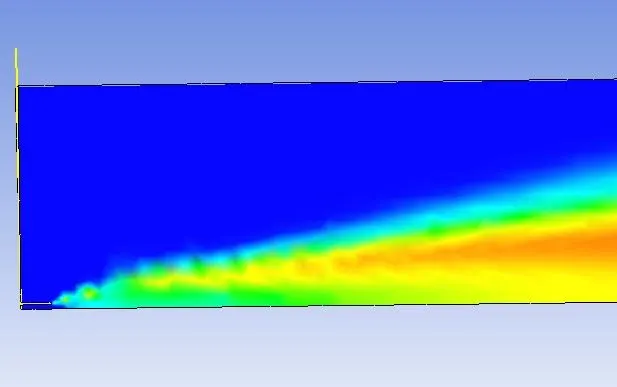
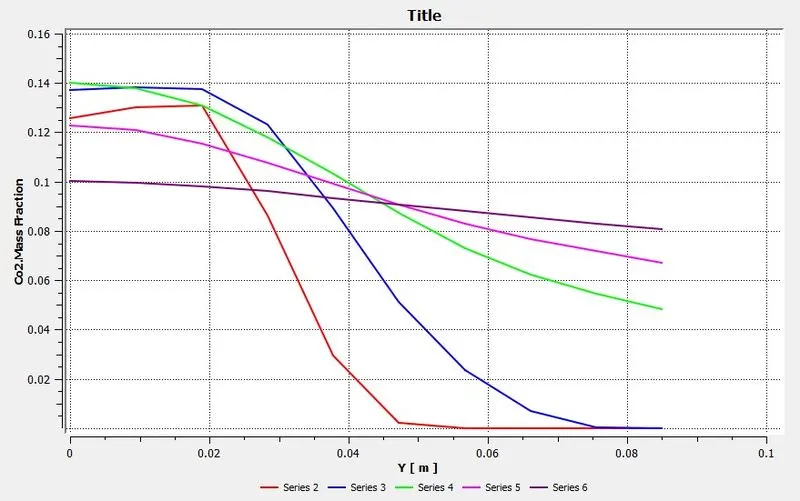
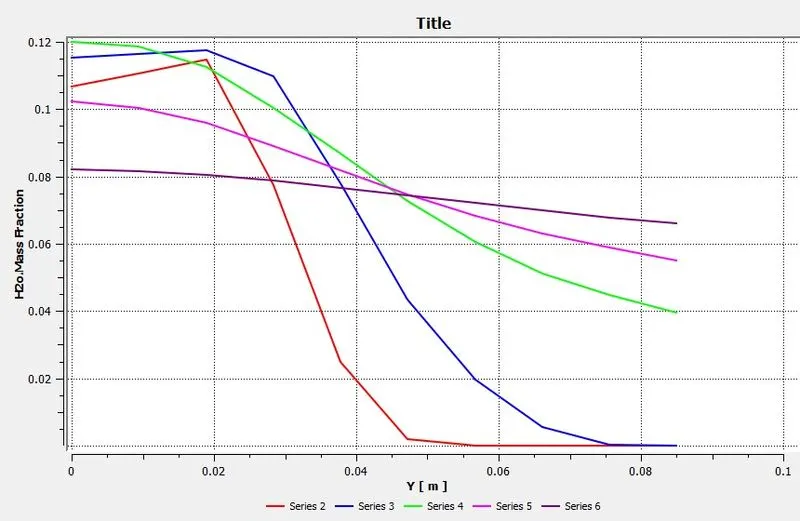
Contours and charts of different concentrations:
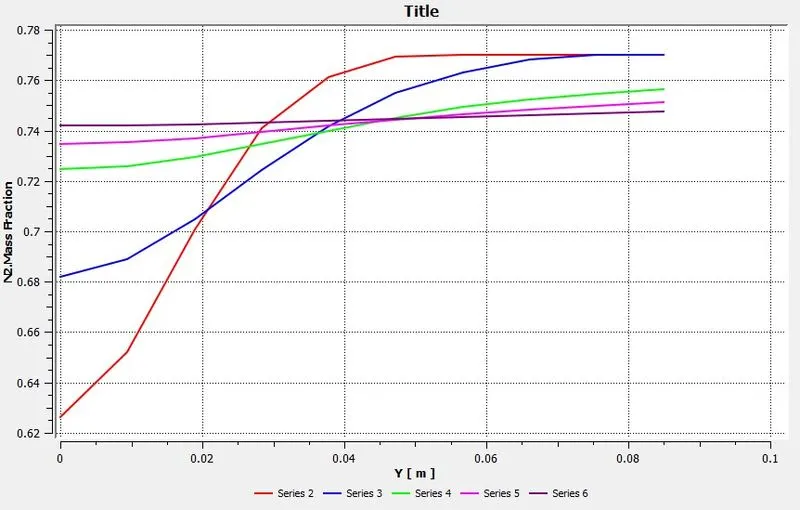
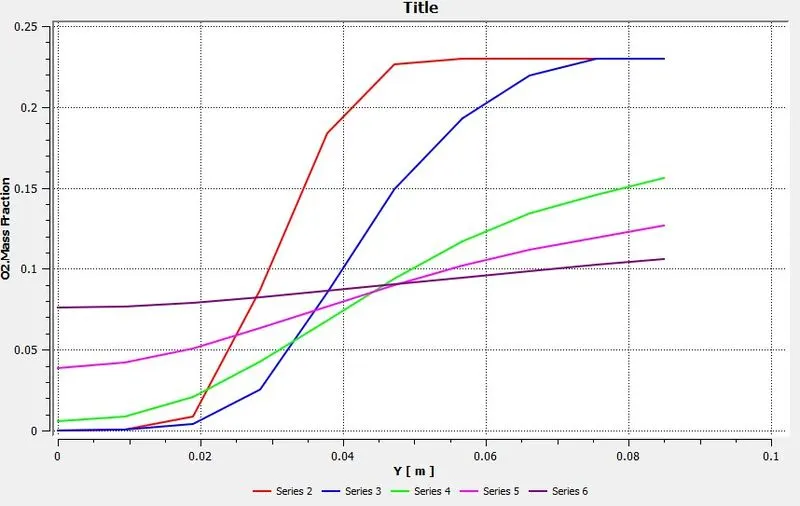
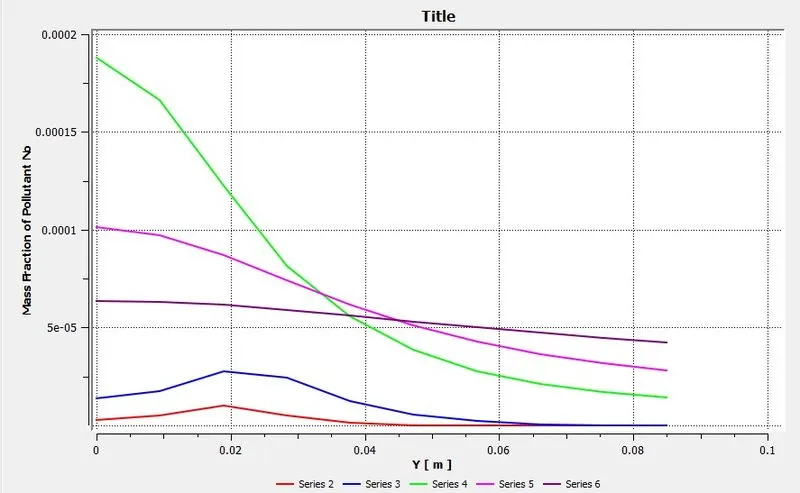
The Selection lines are selected at fixed locations which are-
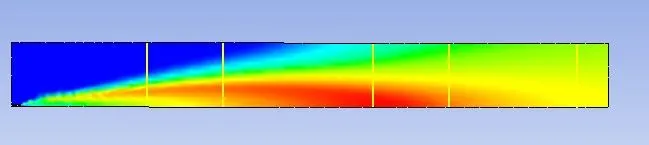
| Contour | Chart | |
| CH4 | 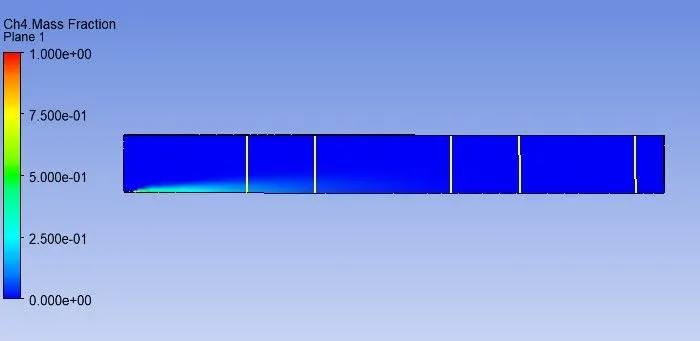 |
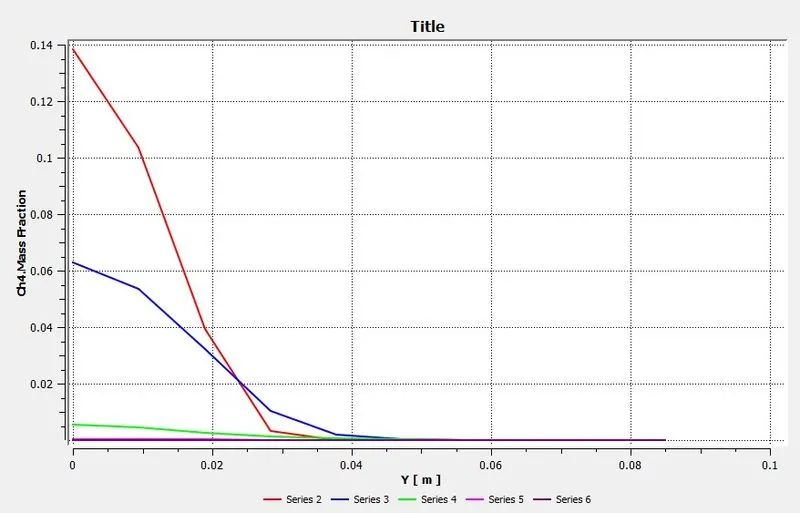 |
| CO2 | 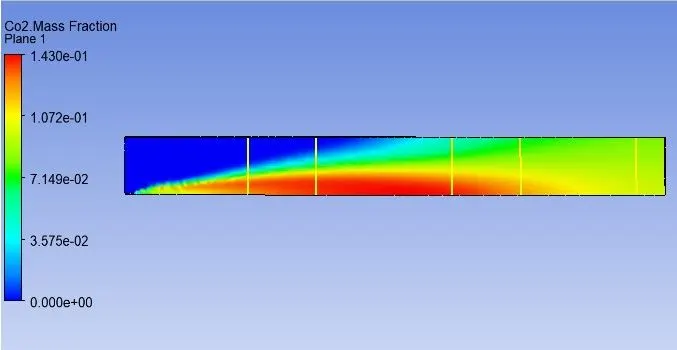 |
 |
| H2O | 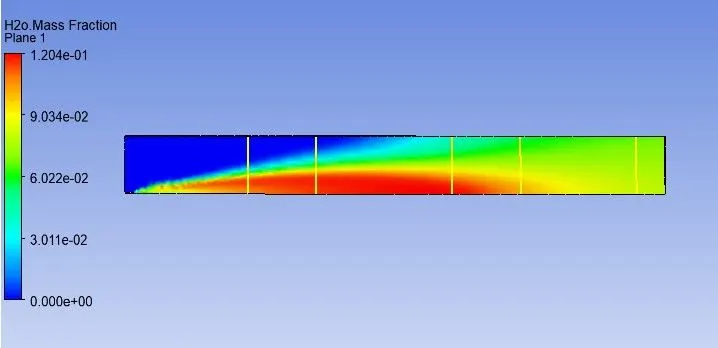 |
 |
| N2 | 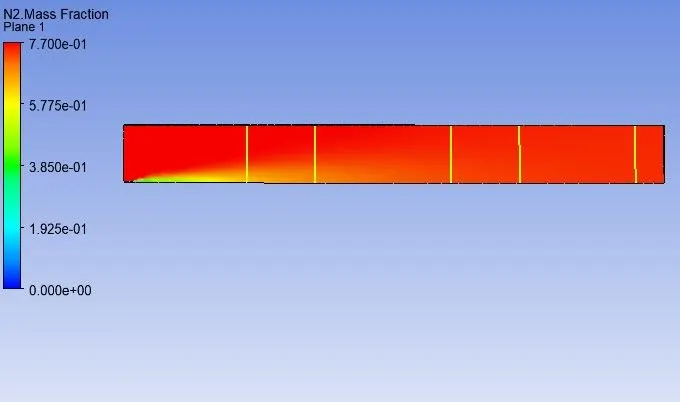 |
 |
| O2 | 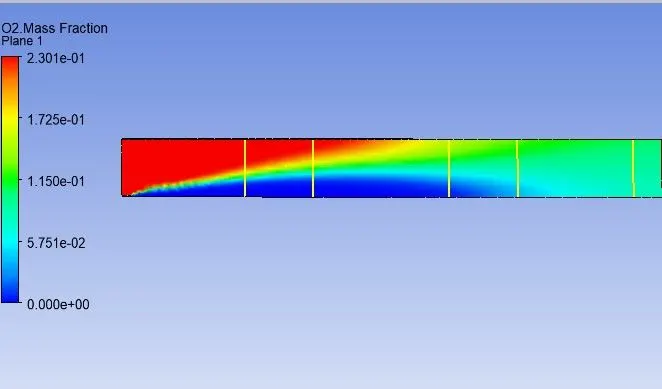 |
 |
| NOX | 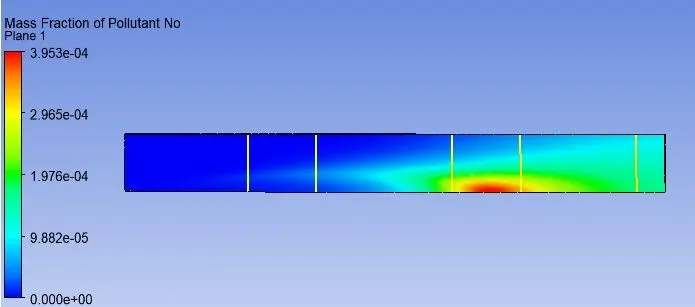 |
 |
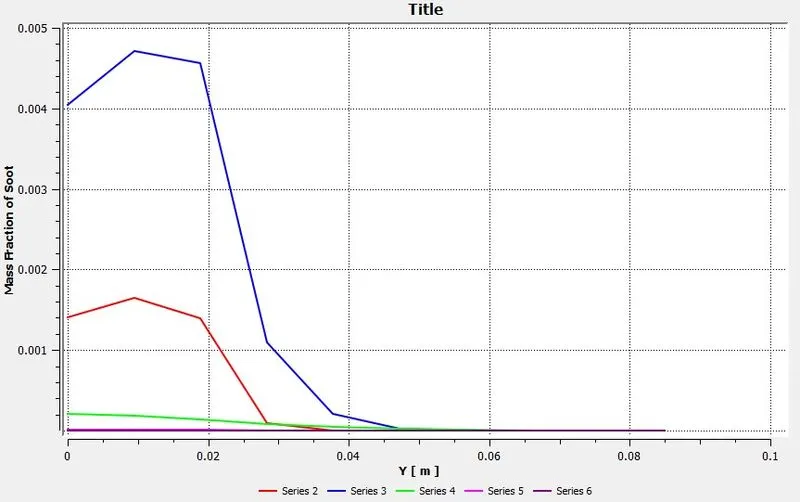
| SOOT | 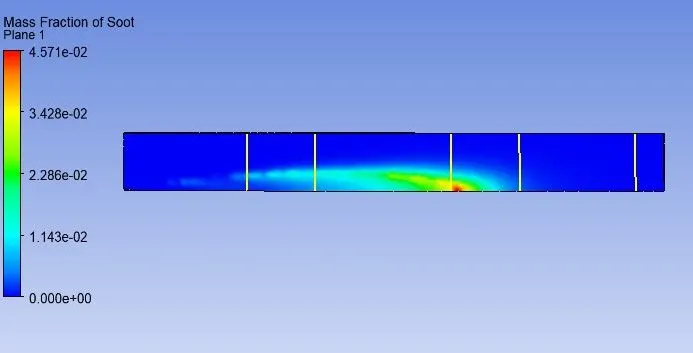 |
 |
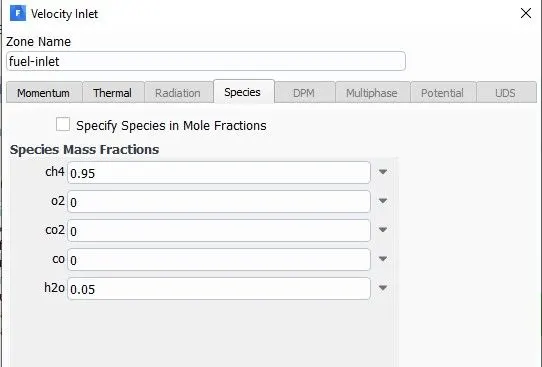
TASK 2: In this part, you need to add the water content in the fuel from 5% to 30% by mole and observe the effect of it on the results. It is necessary to provide line plots and contours to prove your claim.
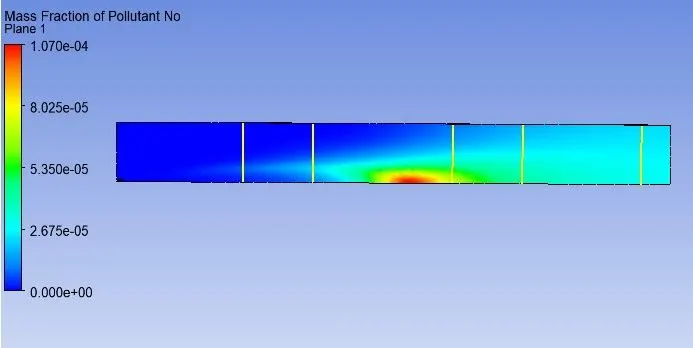
In order to obtain the allowed level of the NOx emission from marine engines, it is indispensable to filter the exhaust gas or inhibit the process of NOx formation in the combustion chamber. One of the ways to reduce NOx in exhaust gas is supplying water into the combustion chamber. The influence of water on the NOx reduction process during combustion results from two factors.
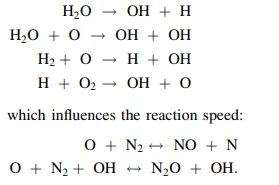
In this analysis similar setup is required but the only difference is that the NOx and Soot model is put on. as
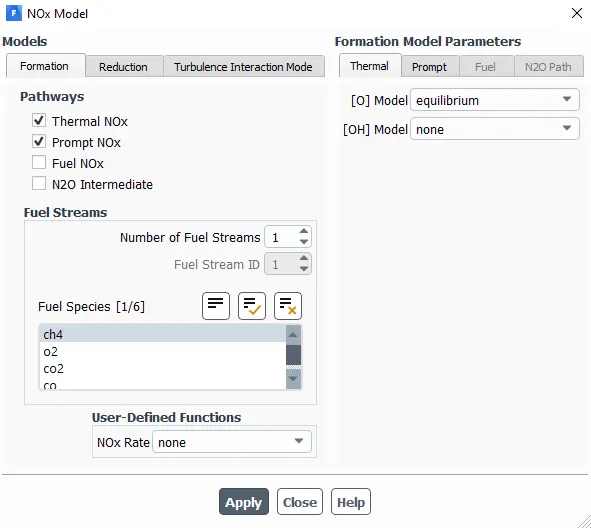
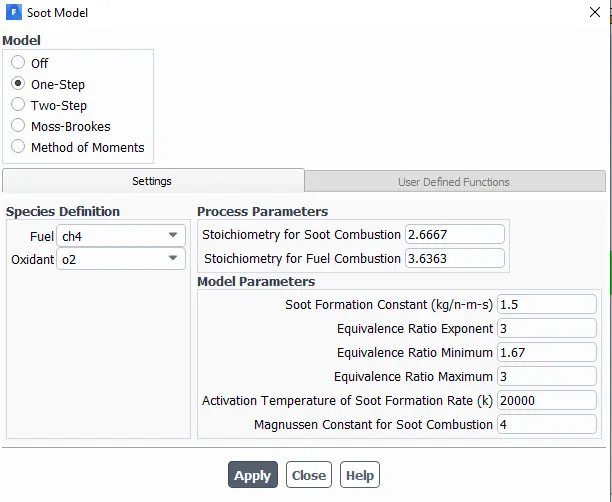
And the area weighted average report definition is created to observe the output.
1. 5% water addition:
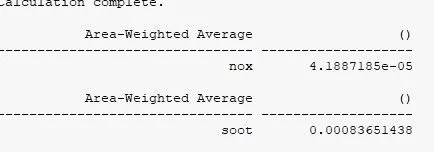
Avg. values:
NOx contour:
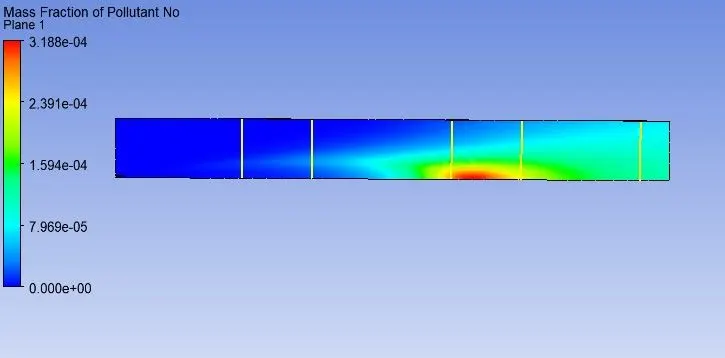
NOx chart:
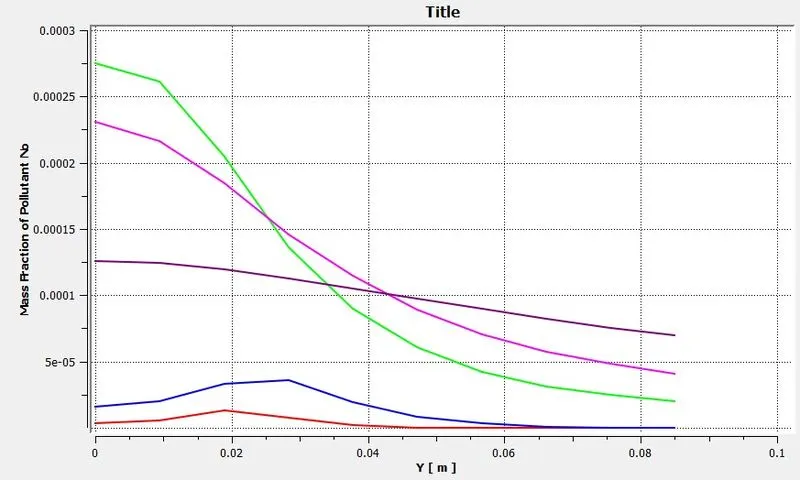
Soot contur:
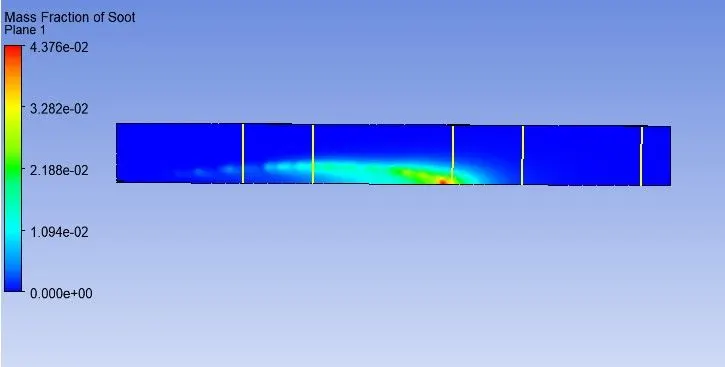
Soot chart:
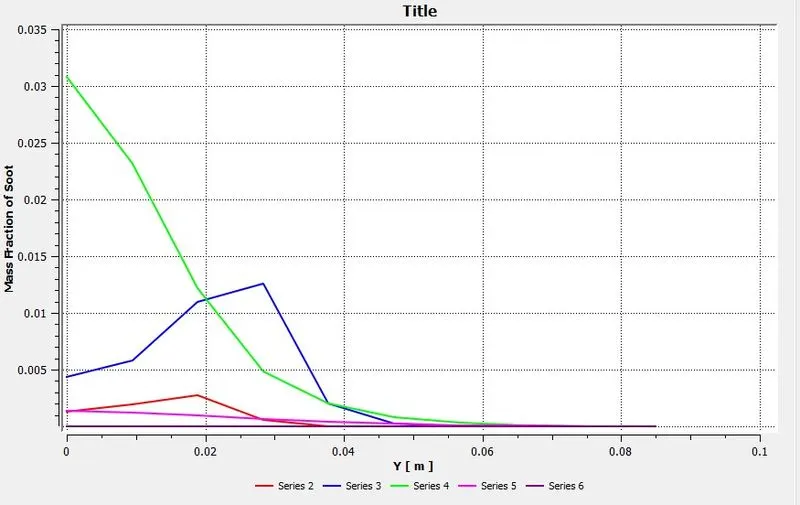
2. 15% water addition:
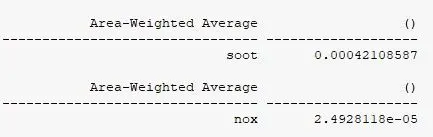
Avg. values:
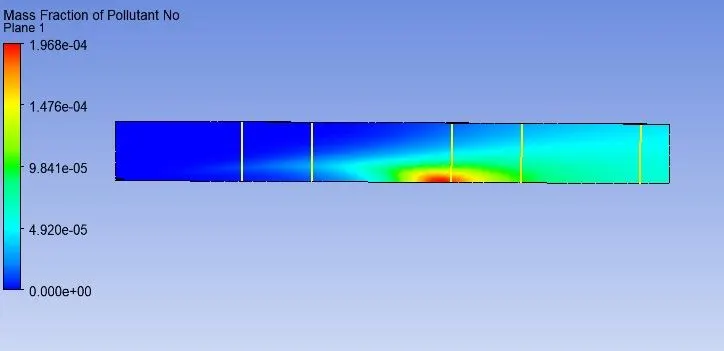
NOx contour:
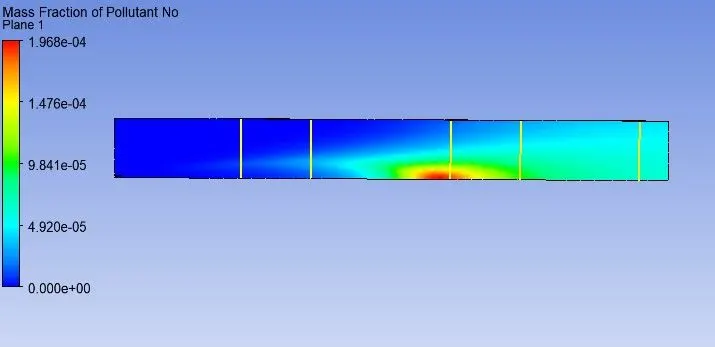
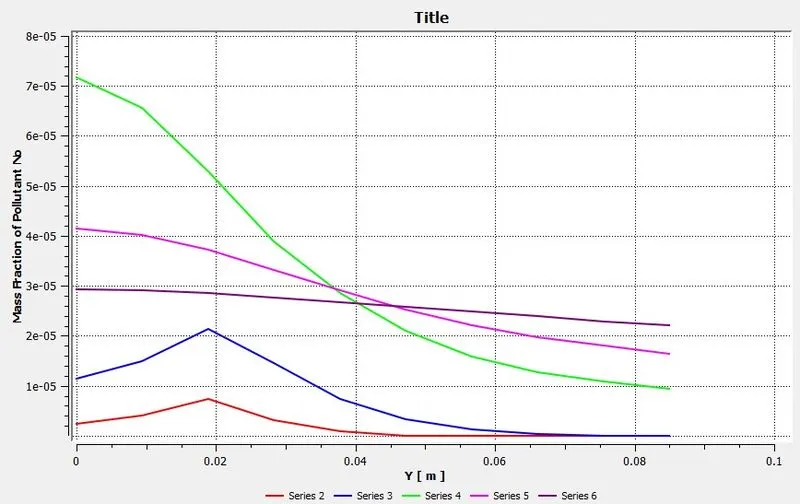
NOx chart:
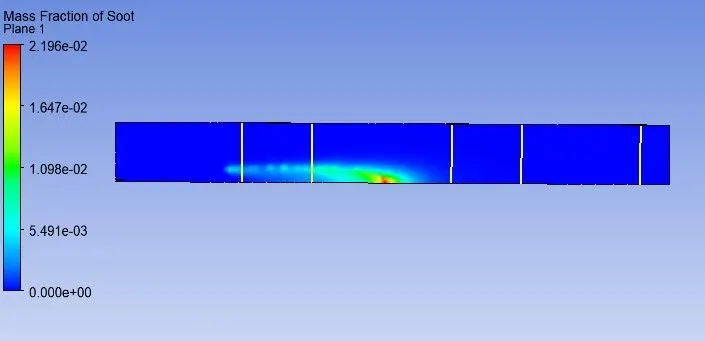
Soot contur:
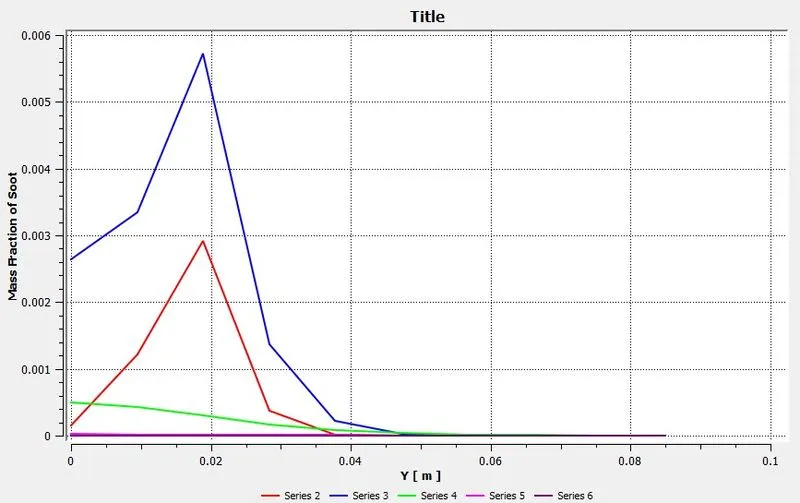
Soot chart:
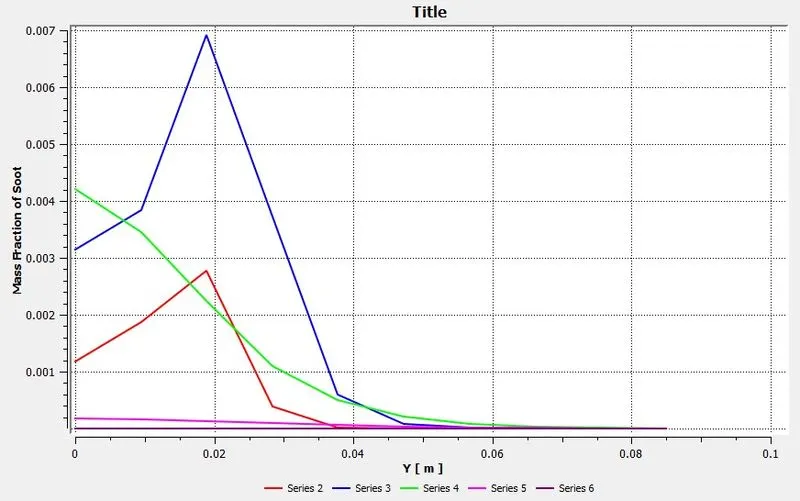
3. 25% water addition:
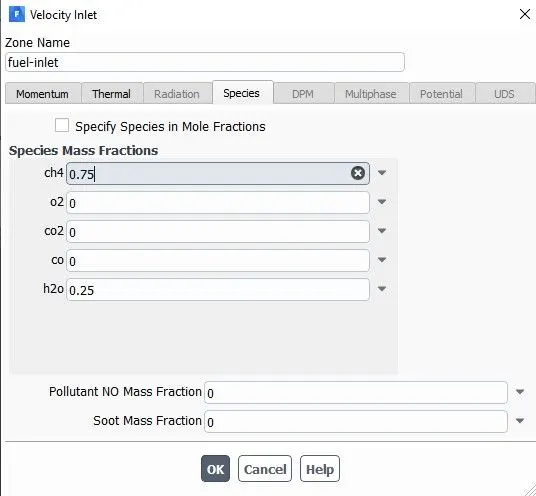
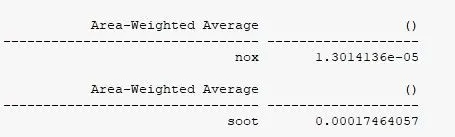
Avg. values:
NOx contour:
NOx chart:
Soot contur:
Soot chart:
4. 30% water addition:
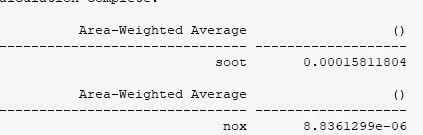
Avg. values:
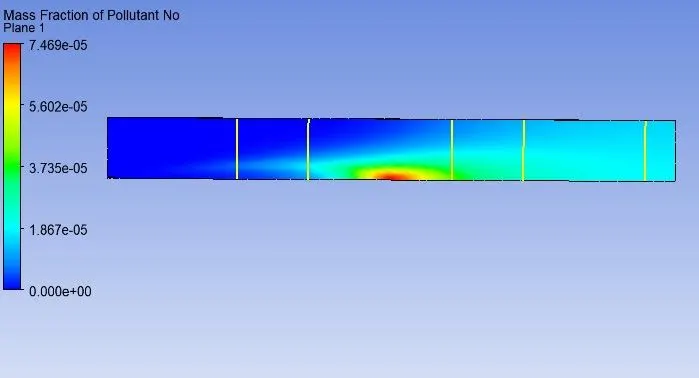
NOx contour:
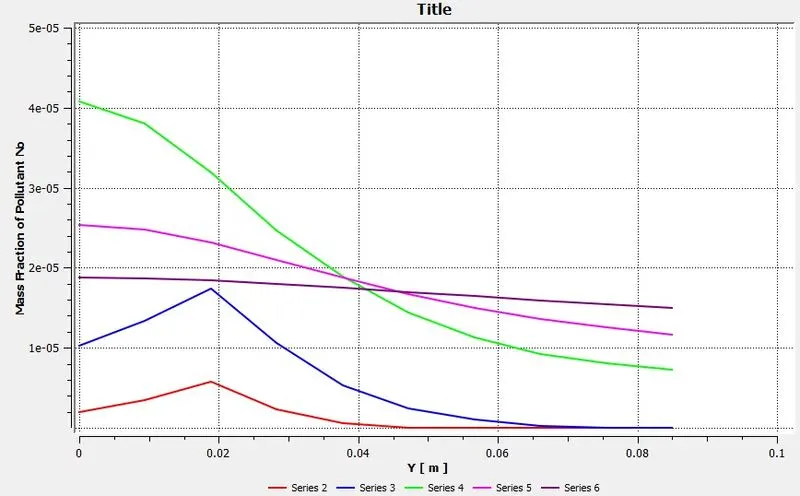
NOx chart:
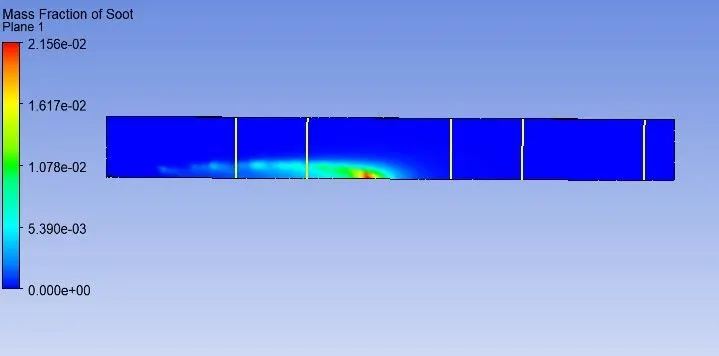
Soot contur:
Soot chart:
| NOx conc. | Soot conc. | |
| 5% water addition | 4.1887*e-05 | 0.00083651438 |
| 15% water addition | 2.49281*e-05 | 0.00042108587 |
| 25% water addition | 1.30141*e-05 | 0.00017464057 |
| 30% water addition | 8.83619*e-06 | 0.00015811804 |
From the above table it can be easily observed that the amount of pollutants leaving is decrasing with the increase in water content which is also stated by Chybowski et. all in their research. hence this research is verified by the above analysis.
Reference Research Paper:-
1. https://www.sciencedirect.com/science/article/pii/S1876610217337724
2. https://link.springer.com/article/10.1007/s00773-015-0303-8