Week 10 - Simulating Combustion of Natural Gas.
Introduction
Combustion is a high-temperature exothermic redox chemical reaction between a fuel (the reductant) and an oxidant, usually atmospheric oxygen, that produces oxidized, often gaseous products.
When the combustion is incomplete, various pollutants are formed, some pollutants are carbon dioxide, carbon monoxide, lead, nitric oxide.
Being the integral part of various engineering applications like: internal combustion engines, aircraft engines, rocket engines, furnaces, and power station combustors, combustion manifests itself as a wide domain during the design, analysis and performance characteristics stages of the above-mentioned applications.
With the added complexity of chemical kinetics and achieving reacting flow mixture environment, proper modeling physics has to be incorporated during computational fluid dynamic (CFD) simulations of combustion.
Theory
Computational fluid dynamics modeling of combustion calls upon the proper selection and implementation of a model suitable to faithfully represent the complex physical and chemical phenomenon associated with any combustion process.
The model should be competent enough to deliver information related to the species concentration, their volumetric generation or destruction rate and changes in the parameters of the
The model should be capable of solving the general transport equations for fluid flow and heat transfer as well as the additional equations of combustion chemistry and chemical kinetics incorporated into that as per the simulating environment desired
Model Used
The eddy dissipation model, Based on the work of Magnussen and Hjertager, is a turbulent-chemistry reaction model.
Most fuels are fast burning and the overall rate of reaction is controlled by turbulence mixing.
In the non-premixed flames, turbulence slowly mixes the fuel and oxidizer into the reaction zones where they burn quickly.
Combustion initiates whenever there is turbulence present in the flow. It does not need an ignition source to initiate the combustion.
Application
The mathematical models that describe chemical reaction kinetics provide chemists and chemical engineers with tools to better understand and describe chemical processesThese models can also be used in the design or modification of chemical reactors to optimize product yield, more efficiently separate products, and eliminate environmentally harmful by-products. When performing catalytic cracking of heavy hydrocarbons into gasoline and light gas, for example, kinetic models can be used to find the temperature and pressure at which the highest yield of heavy hydrocarbons into gasoline will occur.
Aim
- Perform a combustion simulation on the combustor model
- The fuel species is methane and the fluid is air, which contains a mixture of oxygen and nitrogen
- Plot the variation of the mass fraction of the different species’ in the
simulation using line probes at different locations of the combustor.
- Check the effect of adding the water in the fuel on pollutants such as Soot and NOx emissions
- Observe the effect of changing water composition in the fuel from 5% to 30%
Geometry
3D geometry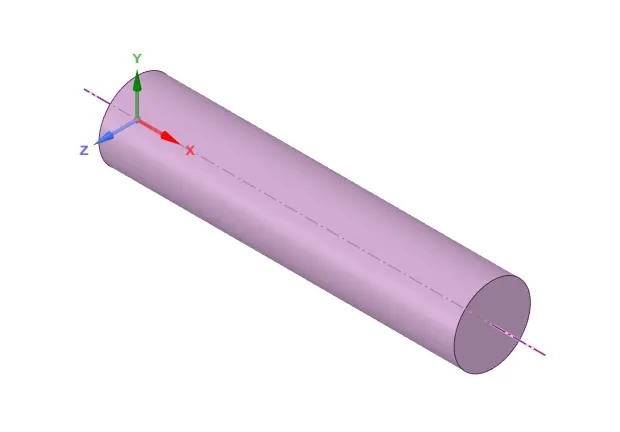
2D geometry

MESH
Details
Element Size : 2 mm
Nodes : 18065
Elements: 36118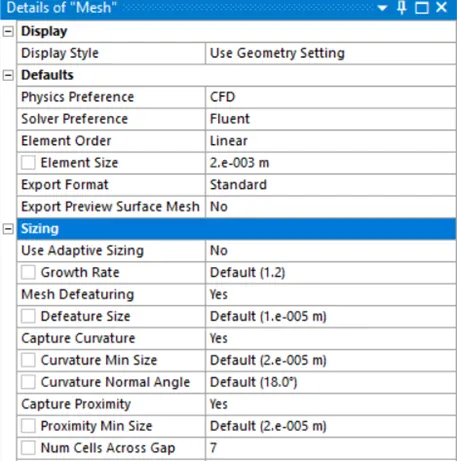
Mesh Images
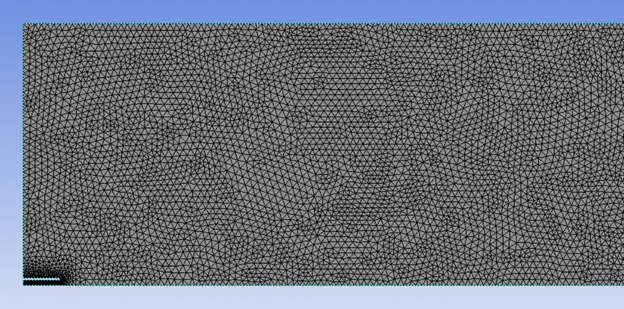
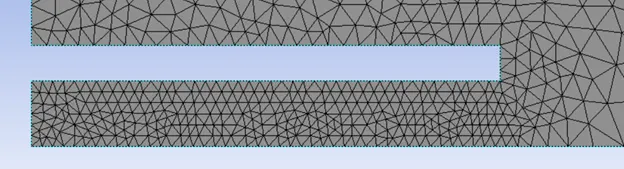
Mesh Quality 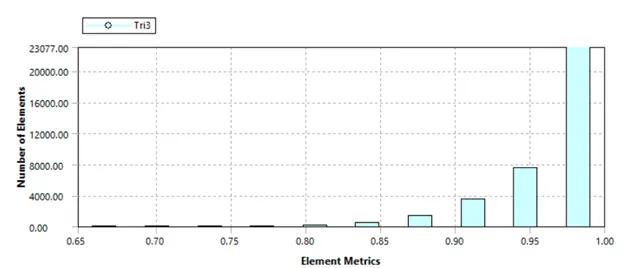
SOLVER SETUP
Solver : Pressure Based, Steady State
2D Space: Axisymmetric
Models
Energy Equations: ON
Viscous Model: Standard K-Epsilon with standard wall functions
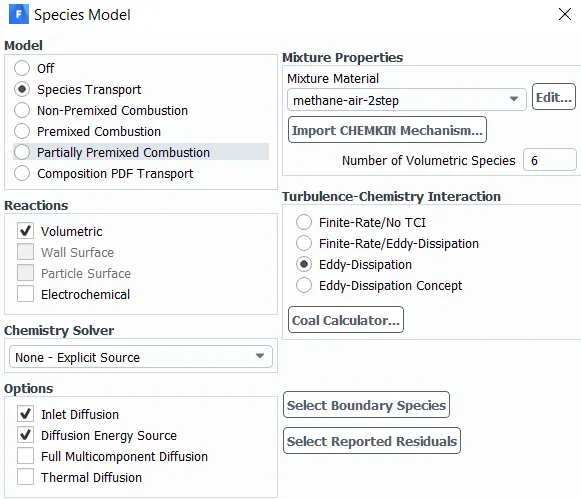
Species
Model: Species Transport
Mixture Properties: Methane - air 2 step
Reactions: Volumetric
Options: Inlet diffusion, Diffusion energy source
Turbulence Chemistry Interaction: Eddy Dissipation
Nox Model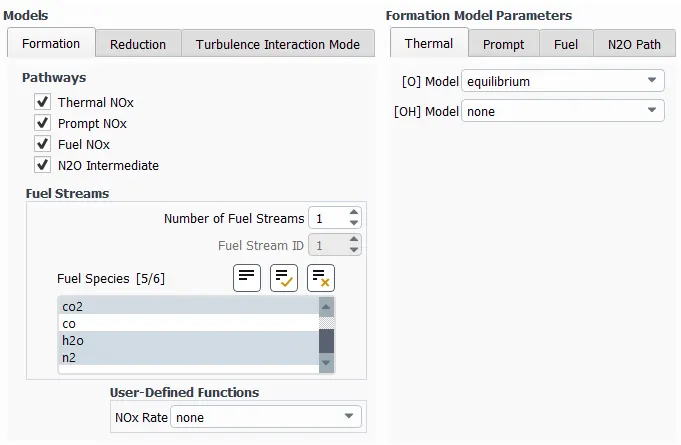
Soot Model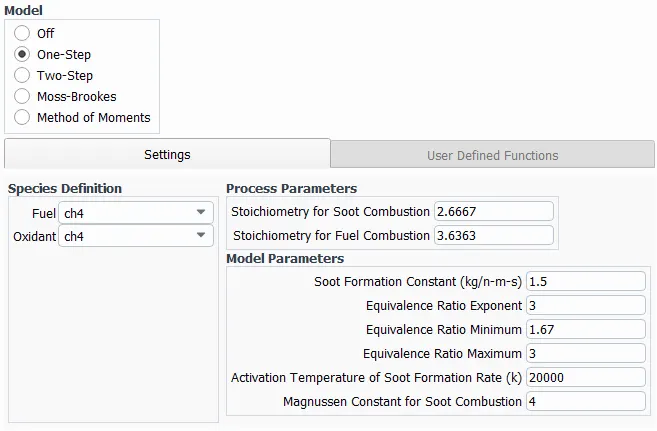
Boundary Conditions
Air Inlet
Velocity: 0.5 m/s
Temperature: 300K
Species mass fraction: O2=0.23
Fuel Inlet
Velocity: 80 m/s
Temperature: 300K
Species Mole Fraction:
CH4 = Parameter 1 = 1
H20 = Parameter 2 = 0
Parameter 1 decreases by 0.05 with each case
Parameter 2 increases by 0.05 with each case
Initialization : Hybrid
No of iterations : 700
POST PROCESSING
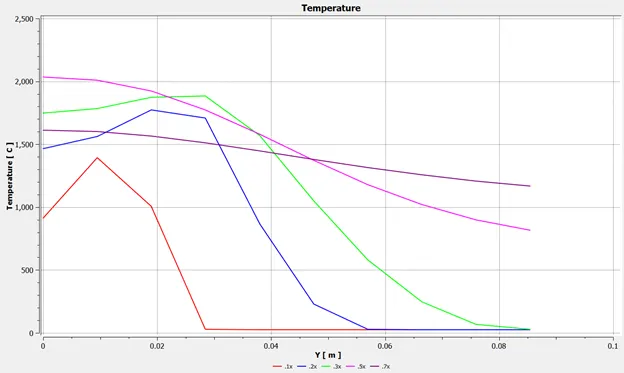
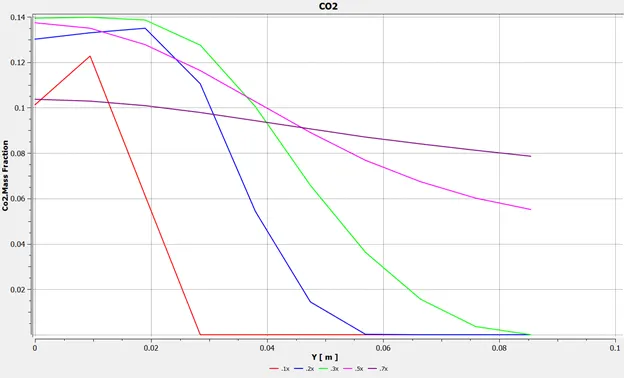
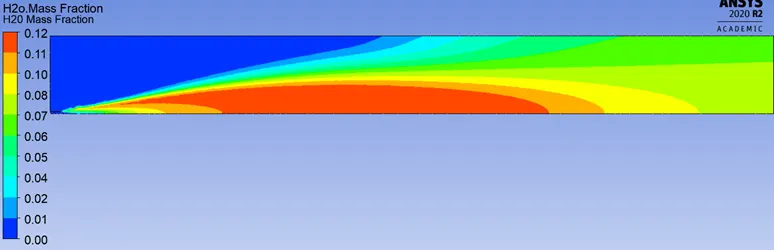
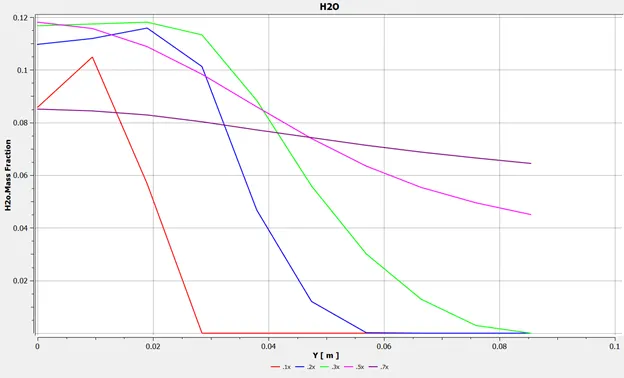
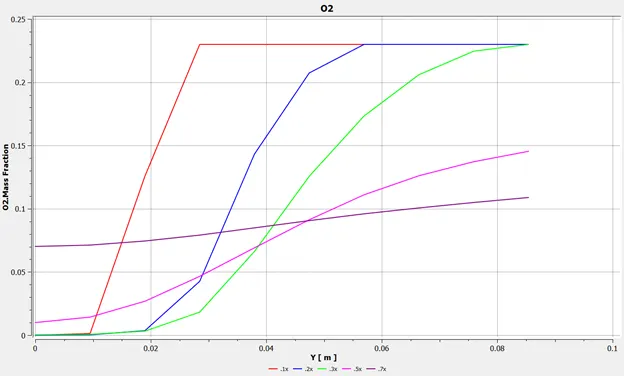
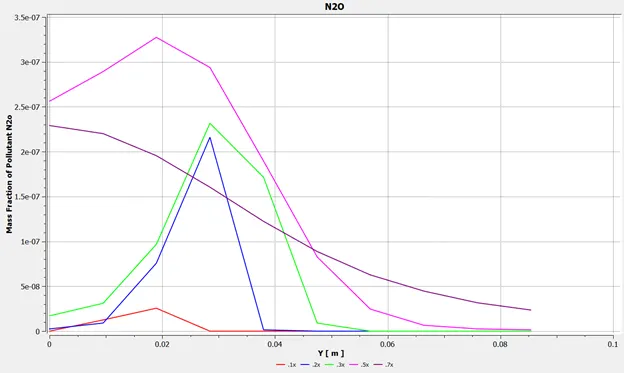
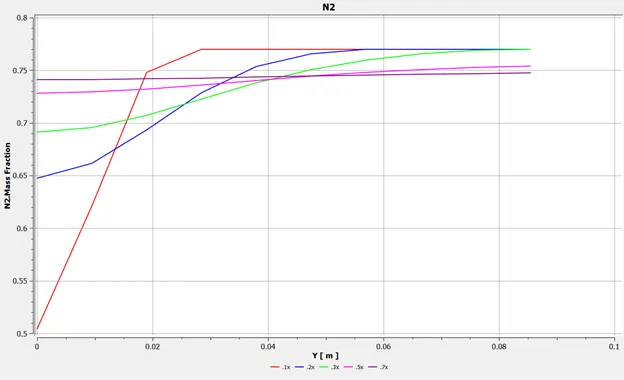
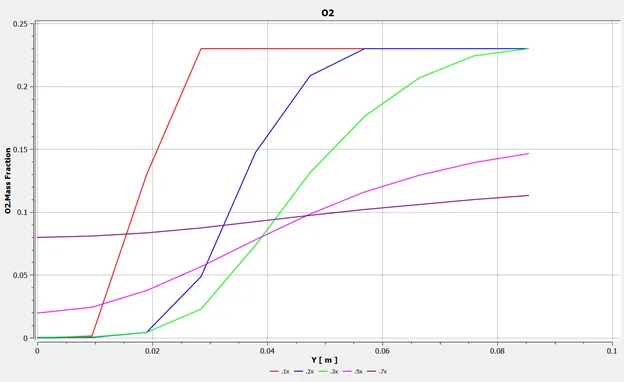
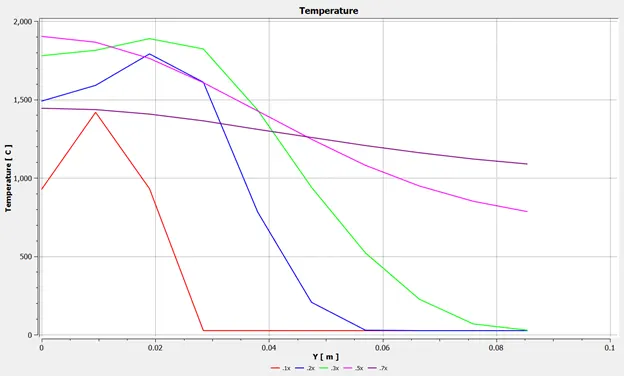
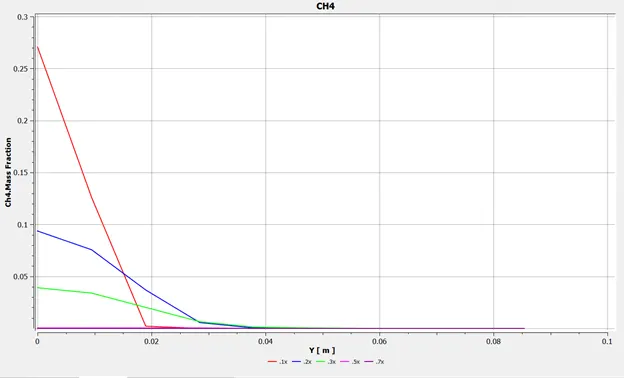
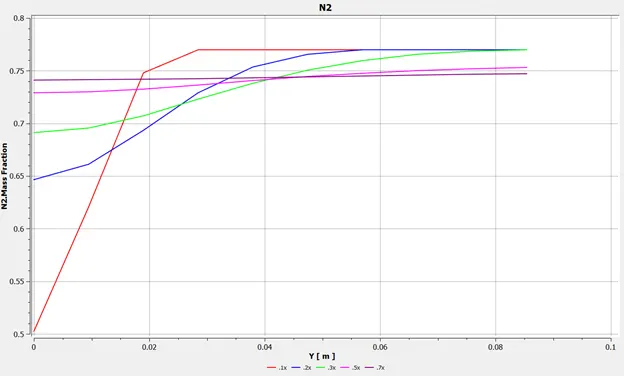
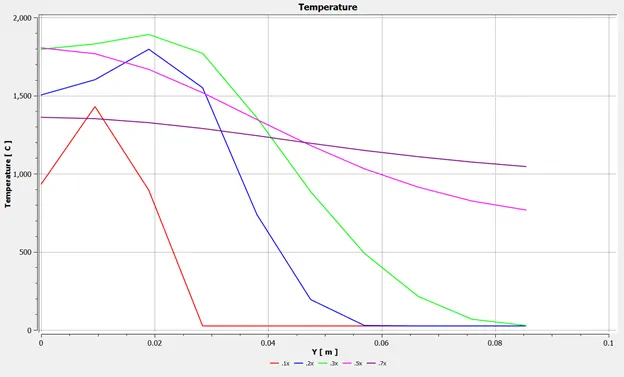
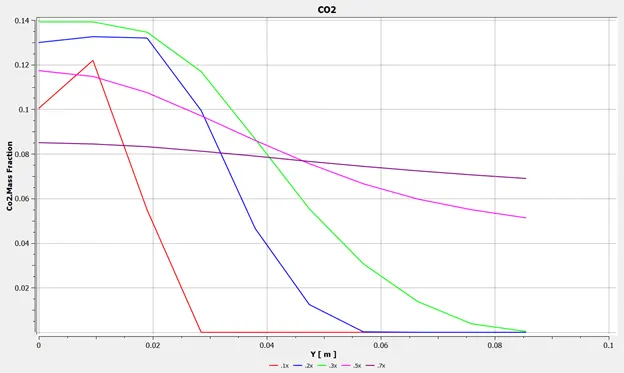
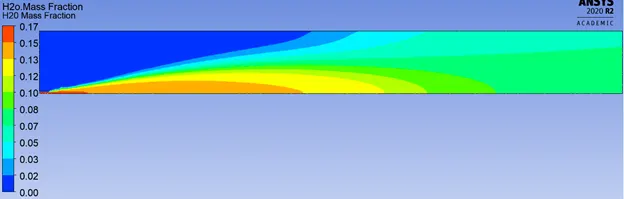
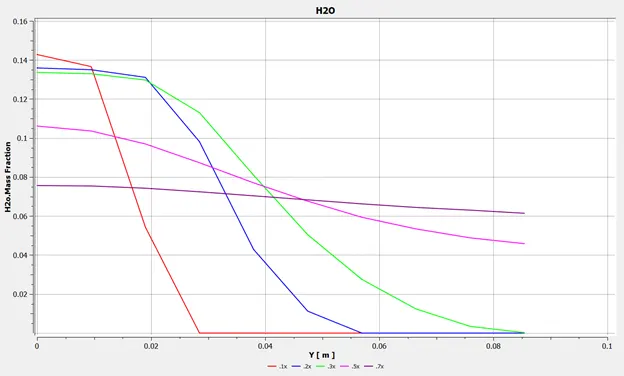
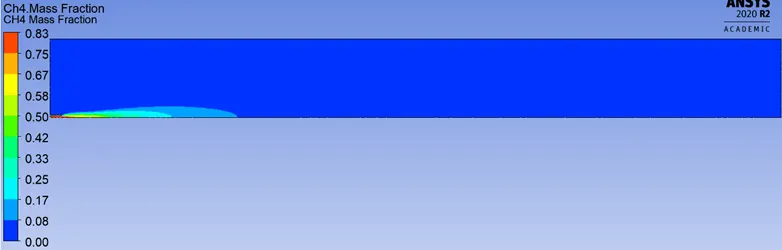
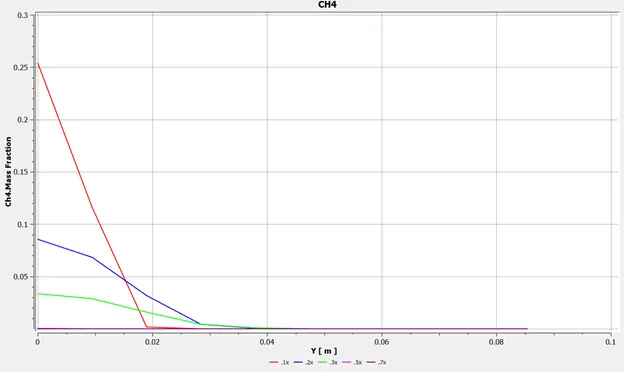
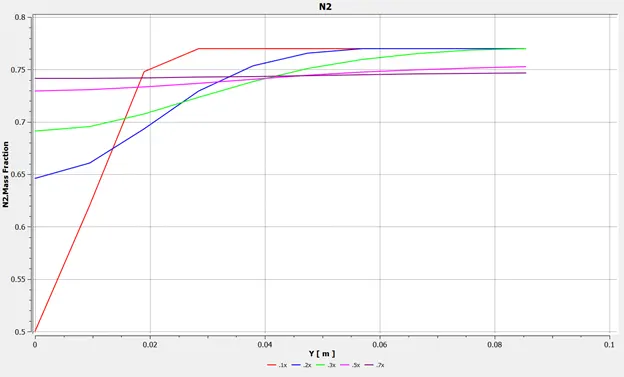
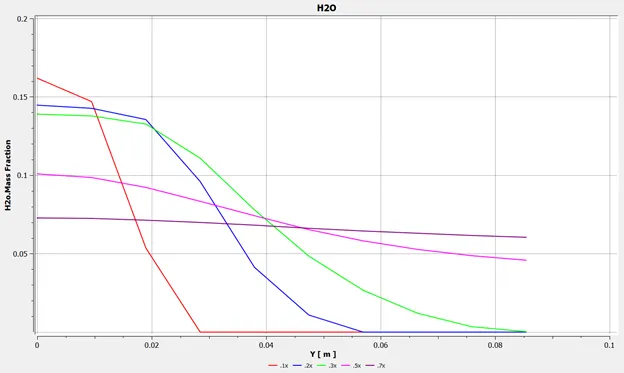
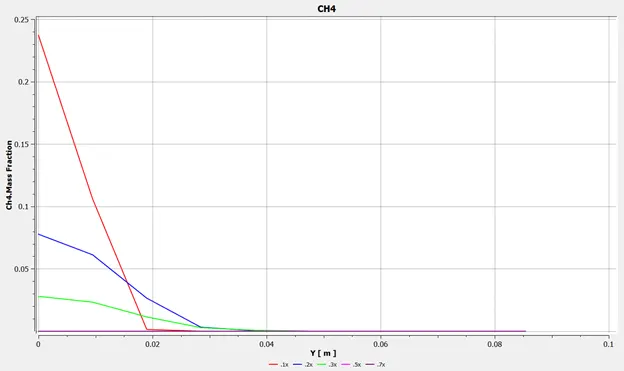
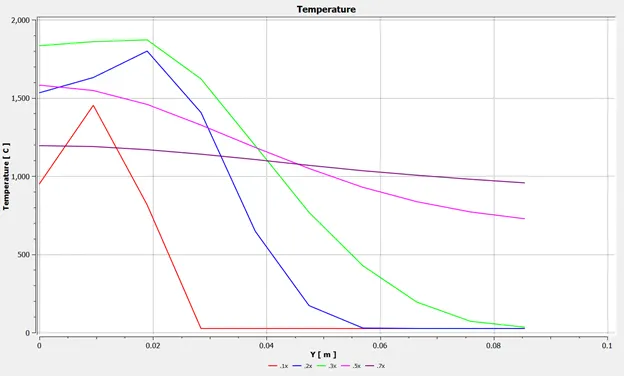
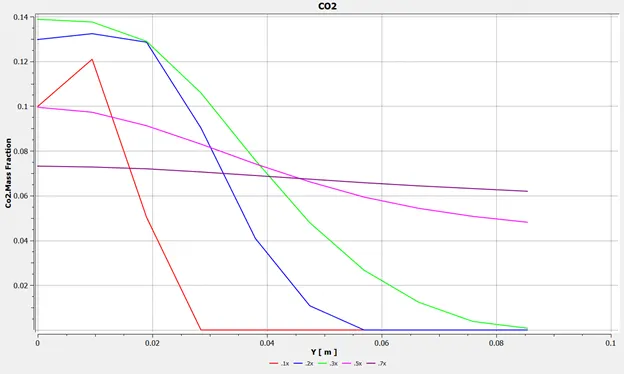
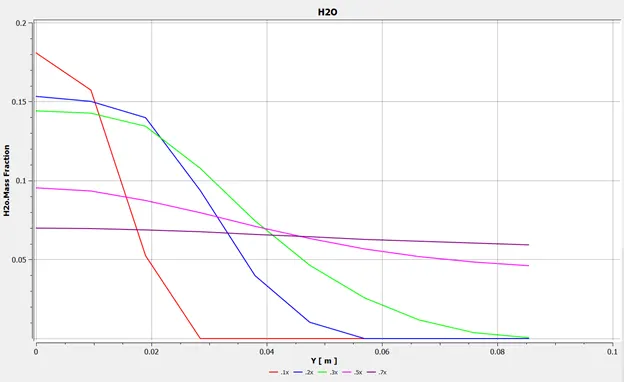
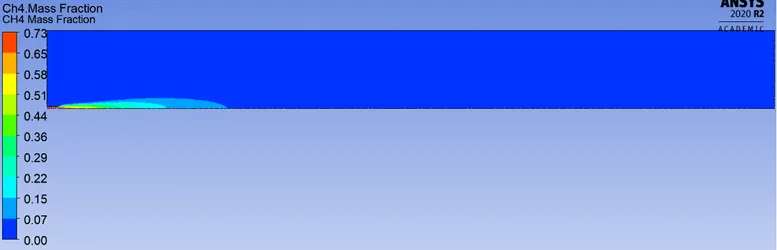
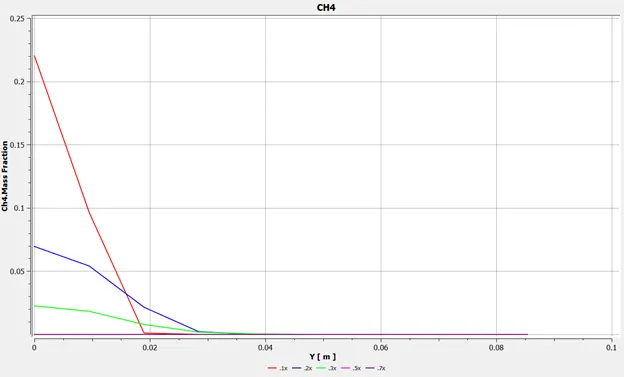
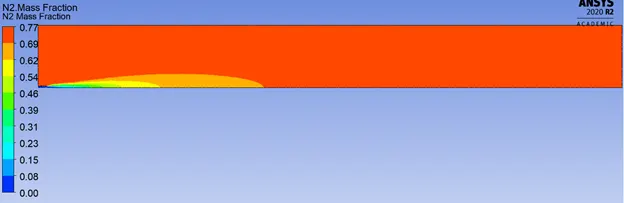
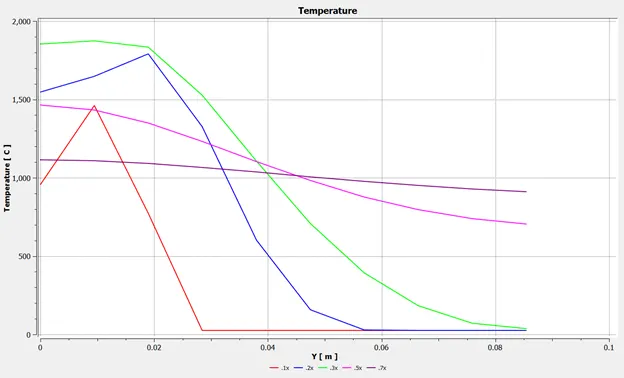
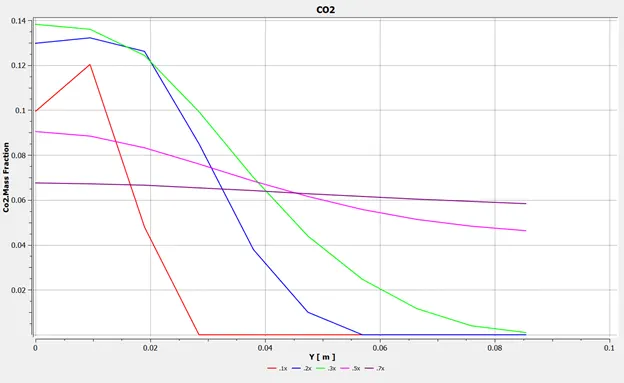
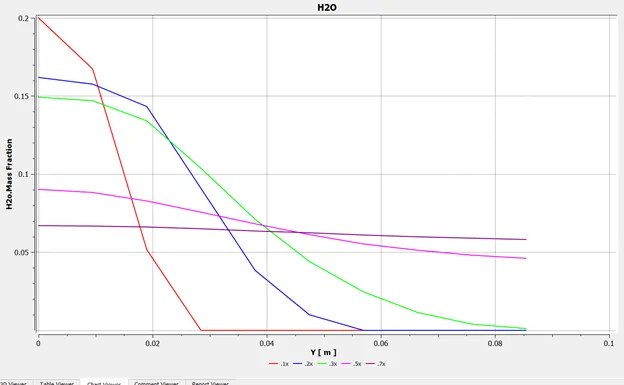
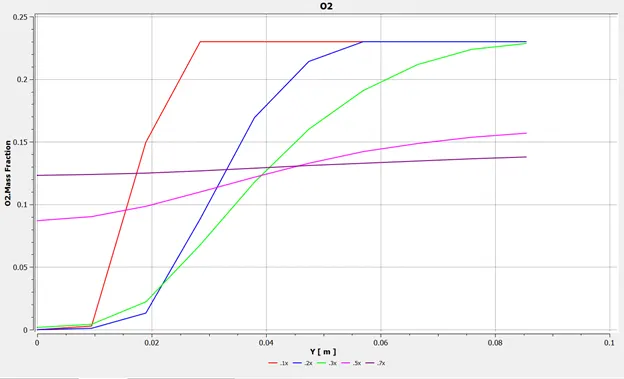
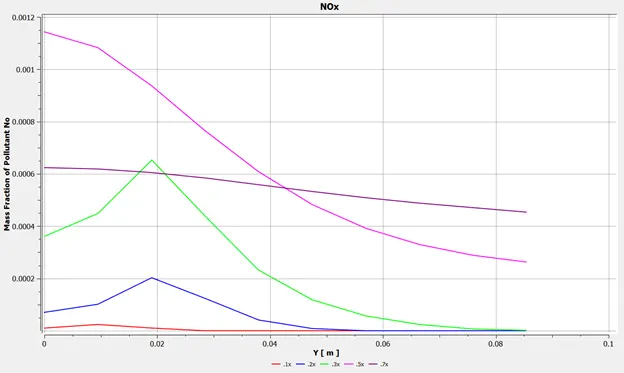
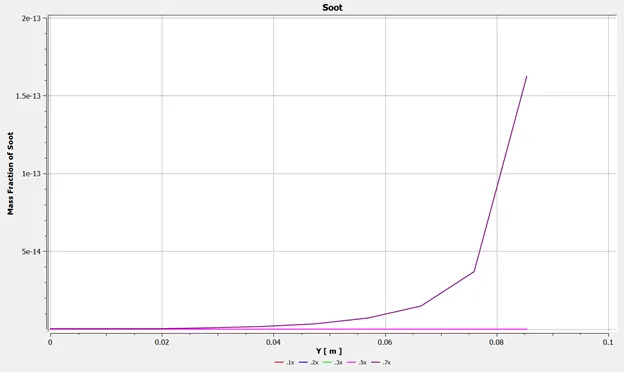
Line Probes are set up at .1x,.2x,.3x,.5x and .7x. Where x is the total length.
They are used to study the variations of the mass fractions of the Reactants, Products and Temperature on these lines
RESULTS
CASE 1
CH4- 100% , Water(H2O) – 0%
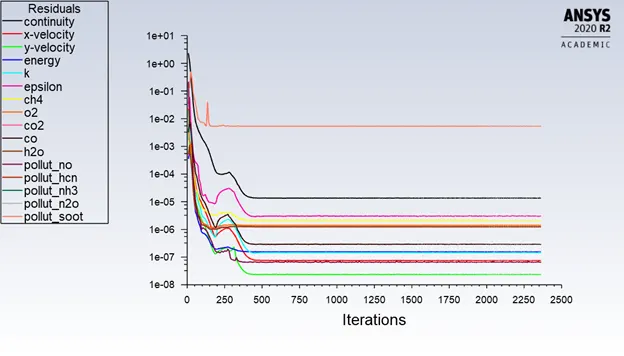
Residuals
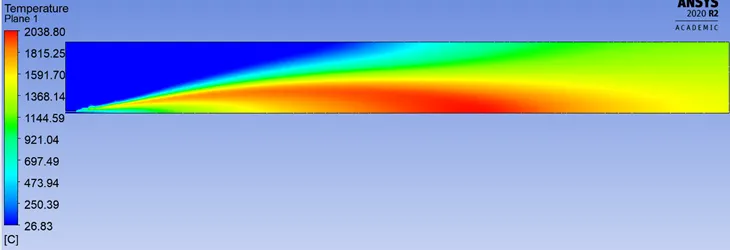
Temperature
Contour
Plot
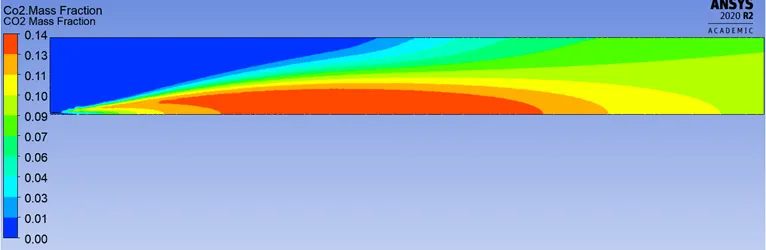
CO2 Mass Fraction
Contour
Plot
H20 Mass Fraction
Contour
Plot
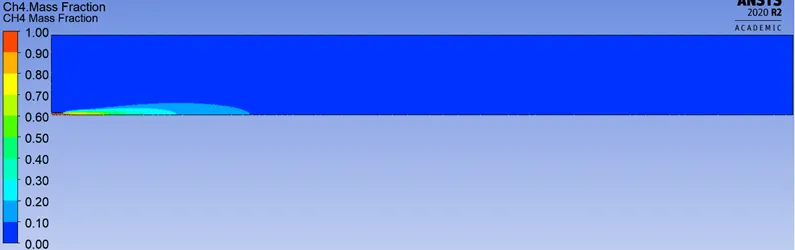
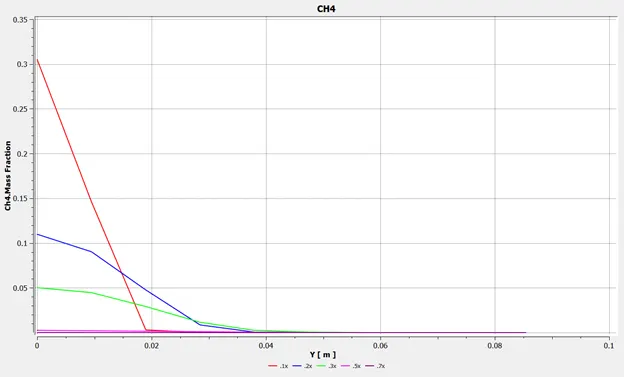
CH4 Mass Fraction
Contour
Plot
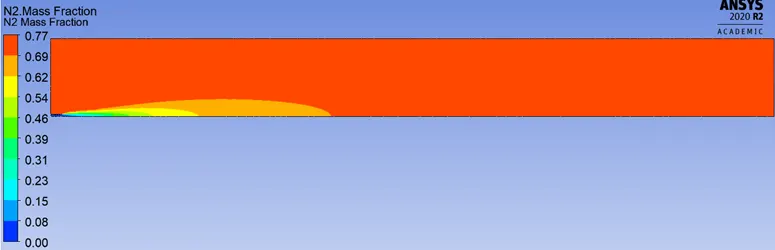
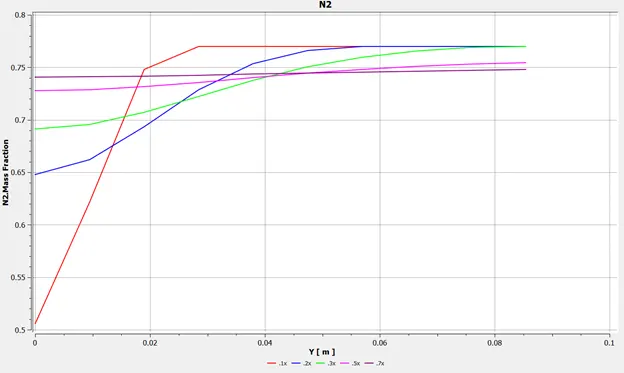
N2 Mass Fraction
Contour
Plot
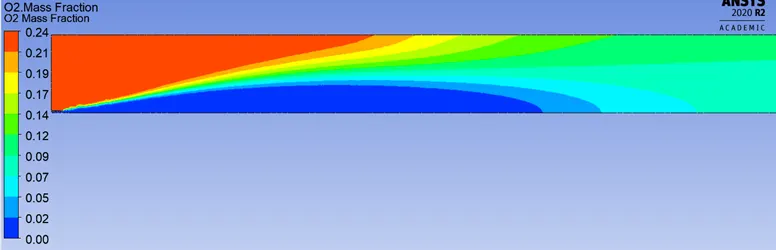
O2 Mass Fraction
Contour
Plot
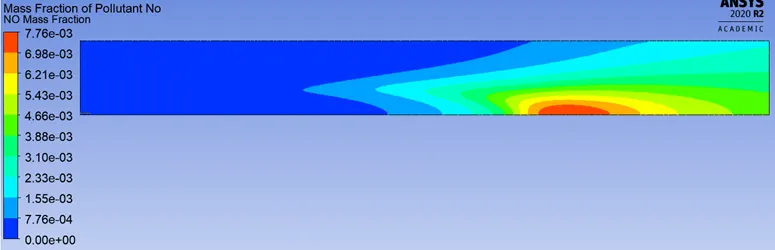
NOx Mass Fraction(No)
Contour
Plot
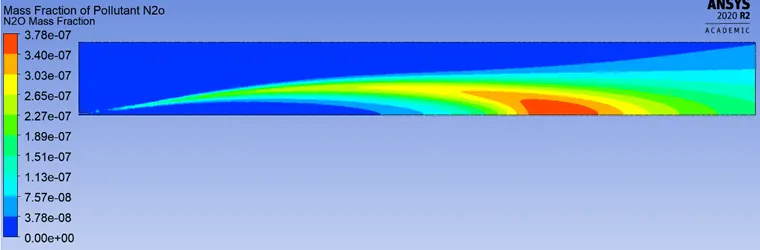
NOx(N20)
Contour
Plot
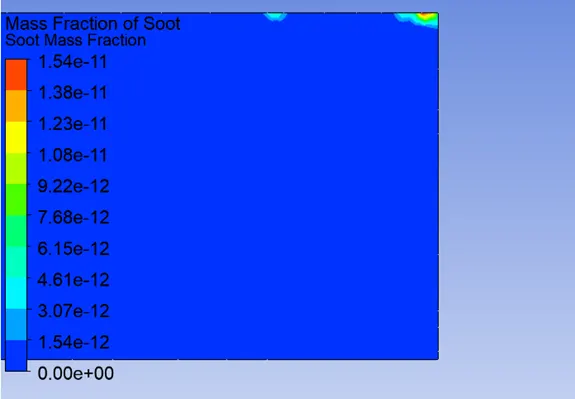
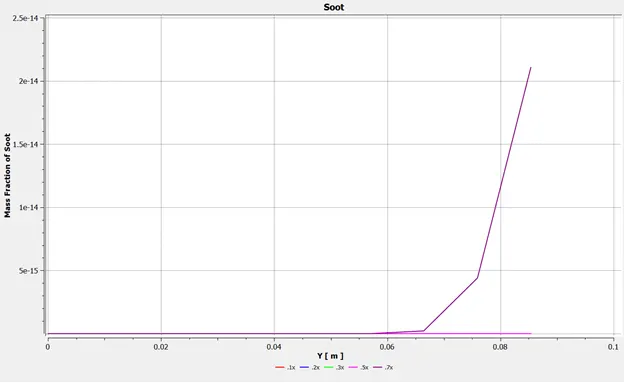
Soot Mass Fraction
Contour
Plot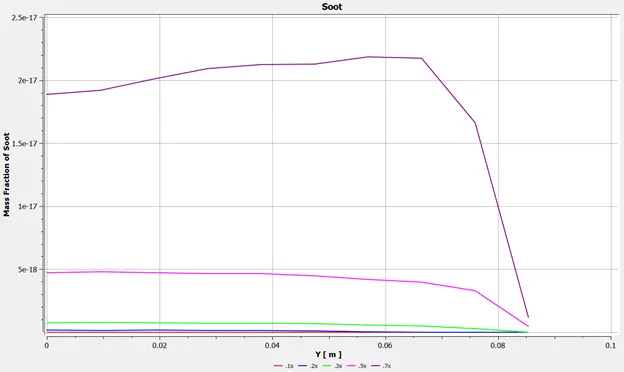
CASE 2
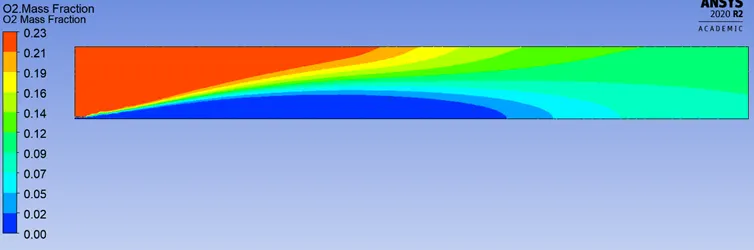
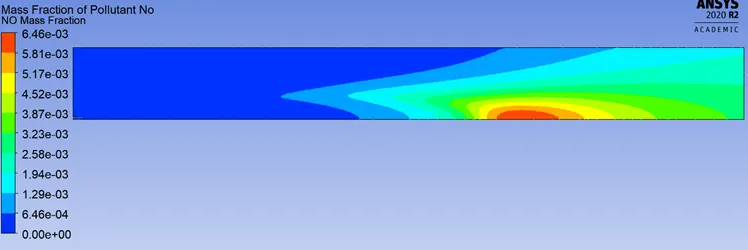
CH4- 95% , Water(H2O) – 5%
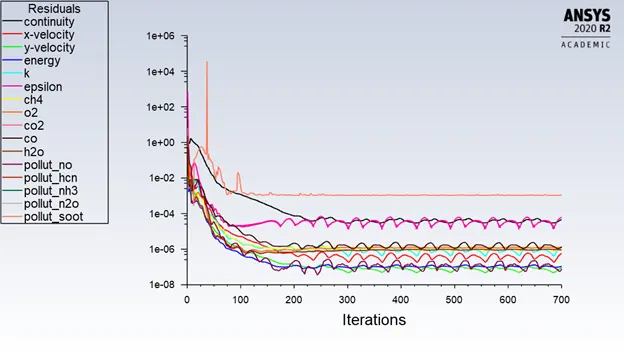
Residuals
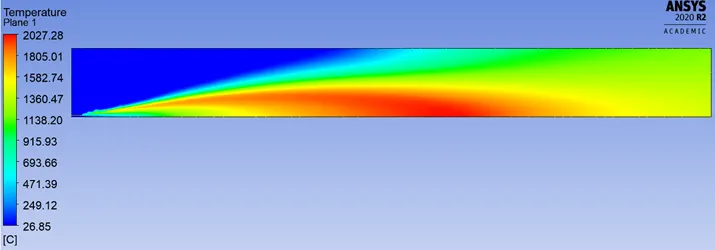
Temperature
Contour
Plot
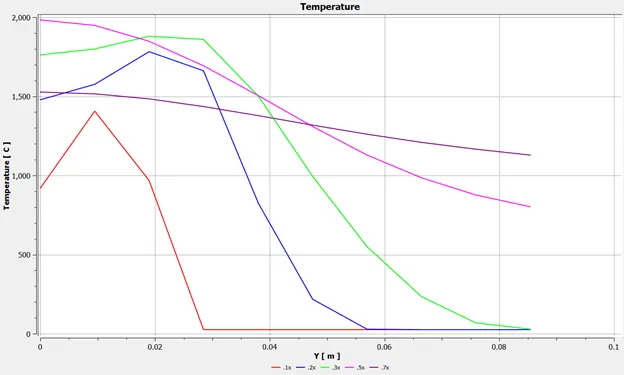
CO2 Mass Fraction
Contour
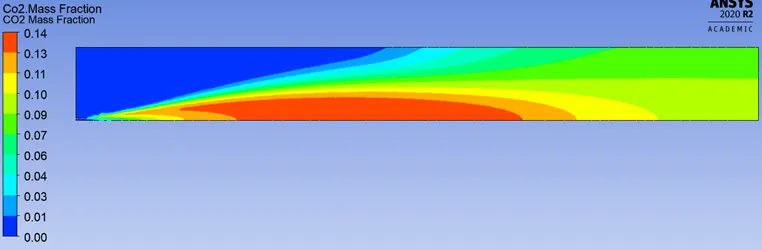
Plot
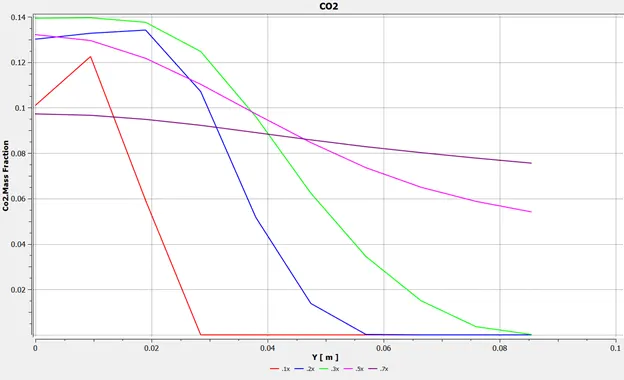
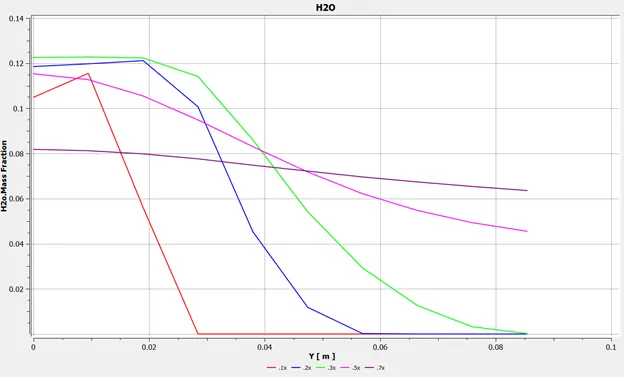
H20 Mass Fraction
Contour
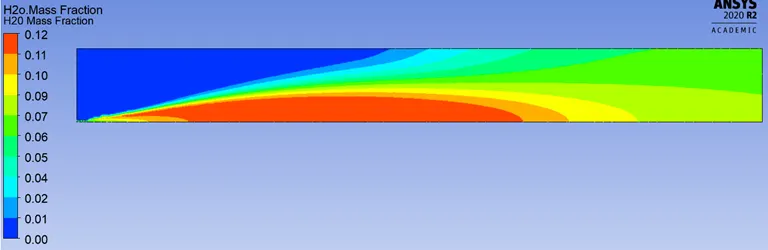
Plot
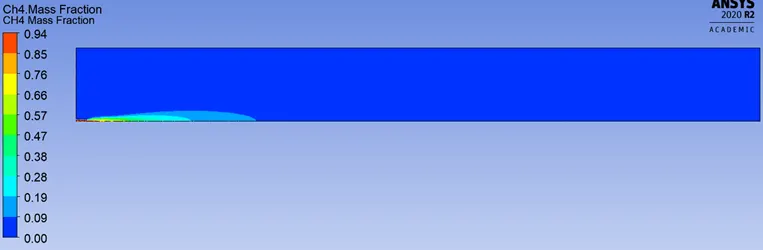
CH4 Mass Fraction
Contour
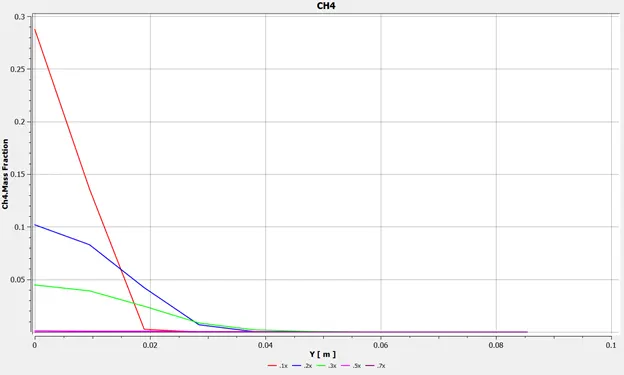
Plot
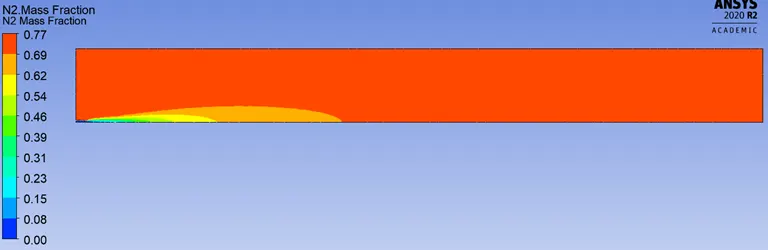
N2 Mass Fraction
Contour
Plot
O2 Mass Fraction
Contour
Plot
NOx Mass Fraction(NO)
Contour
Plot
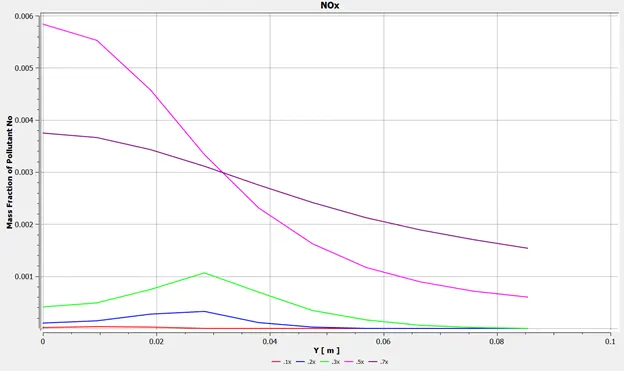
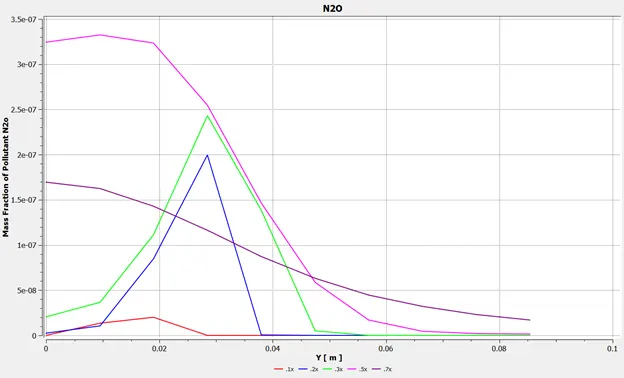
NOx Mass Fraction(N2O)
Contour
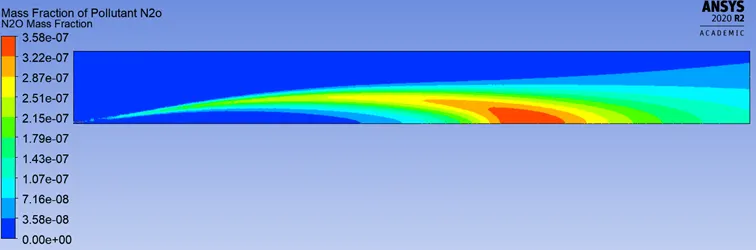
Plot
Soot Mass Fraction
Contour
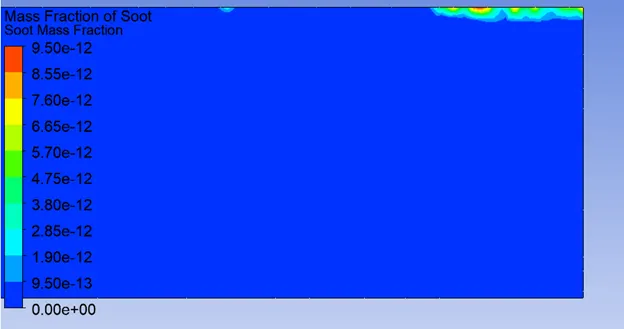
Plot
CASE 3
CH4- 90% , Water(H2O) – 10%
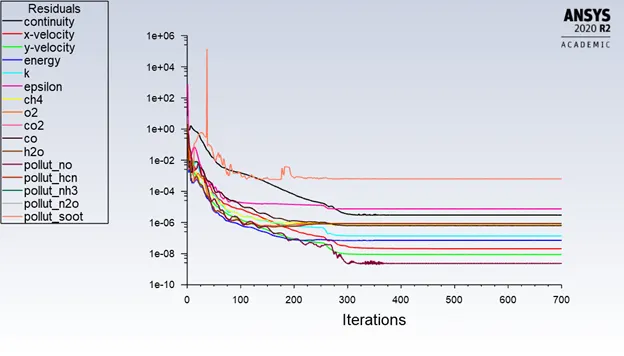
Residuals
Temperature
Contour
Plot
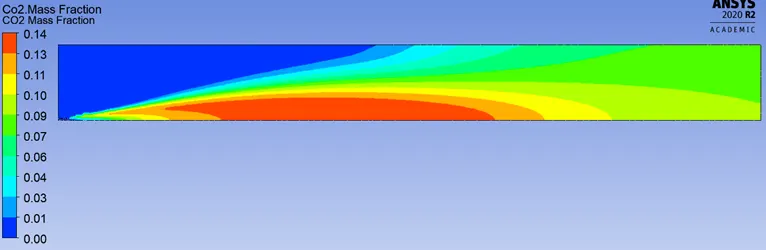
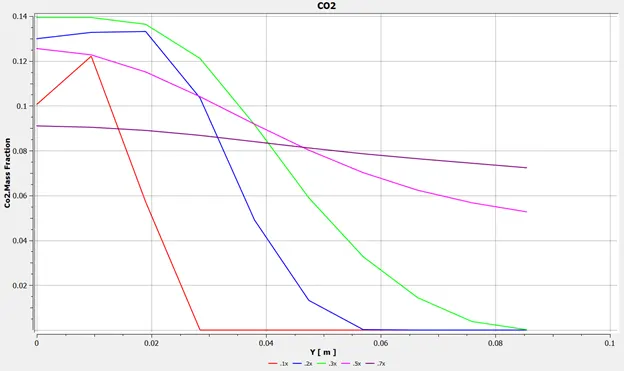
CO2 Mass Fraction
Contour
Plot
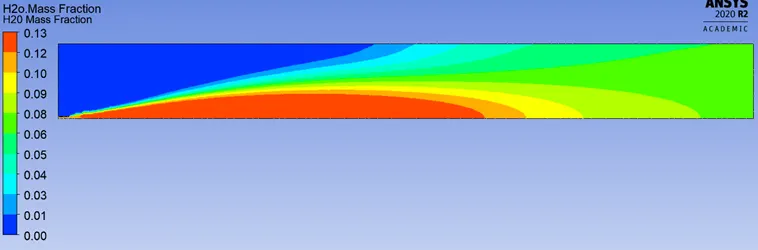
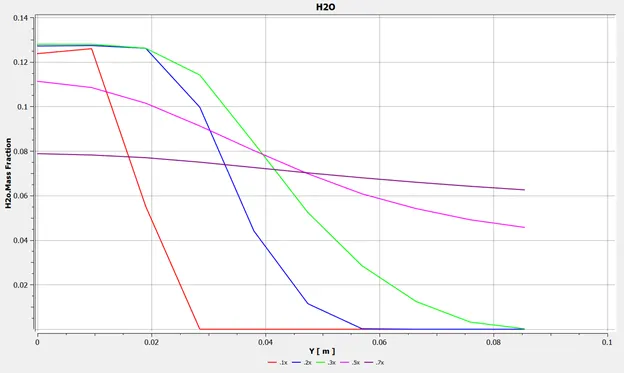
H20 Mass Fraction
Contour
Plot
CH4 Mass Fraction
Contour
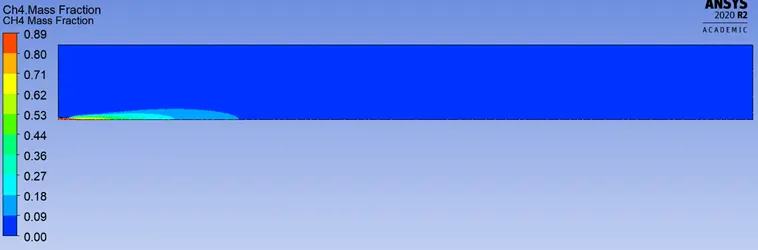
Plot
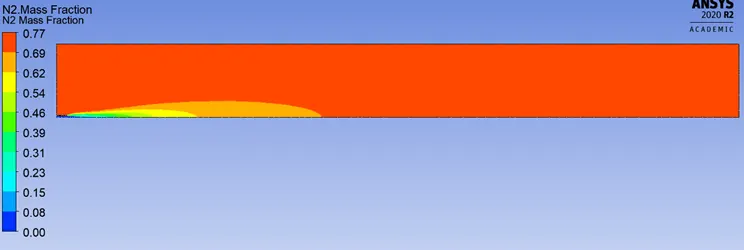
N2 Mass Fraction
Contour
Plot
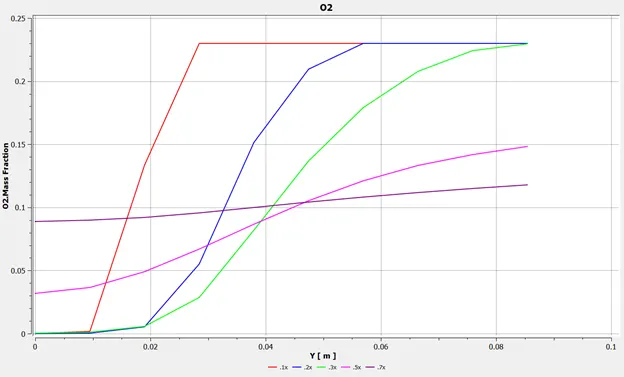
O2 Mass Fraction
Contour
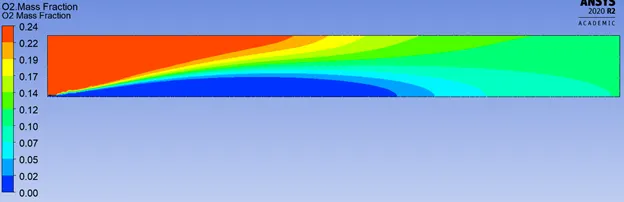
Plot
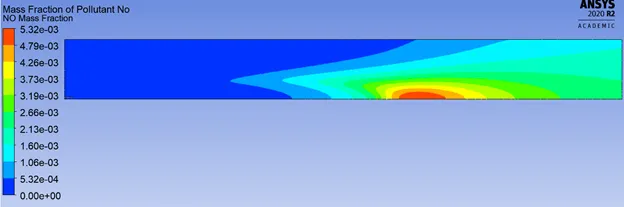
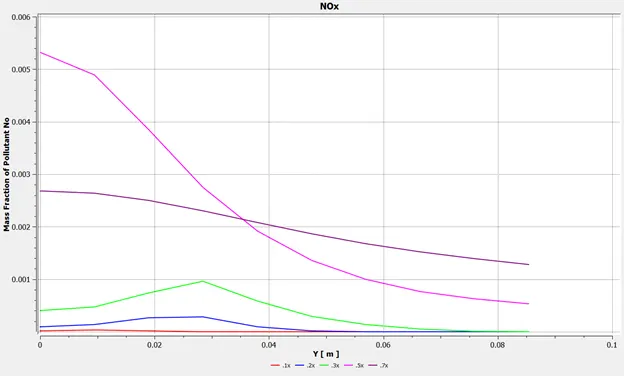
NOx Mass Fraction (NO)
Contour
Plot
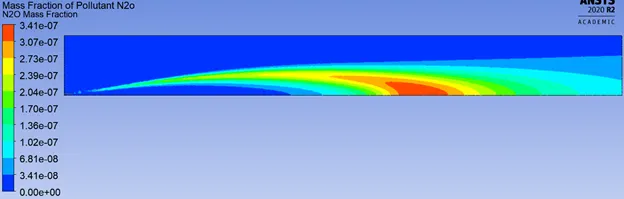
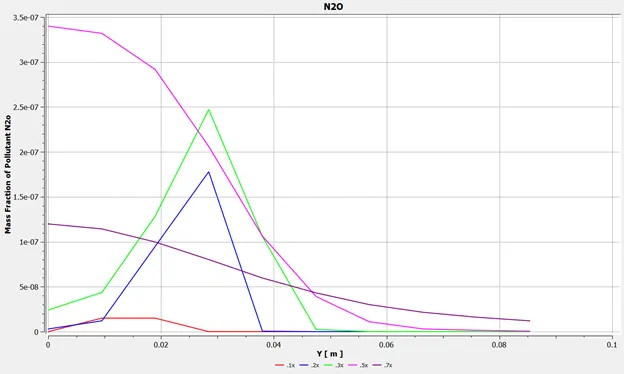
NOx Mass Fraction(N2O)
Contour
Plot
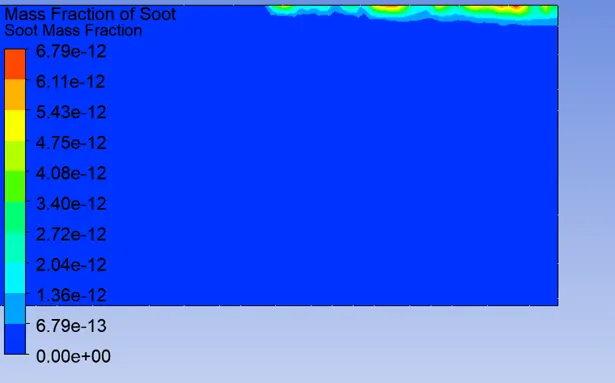
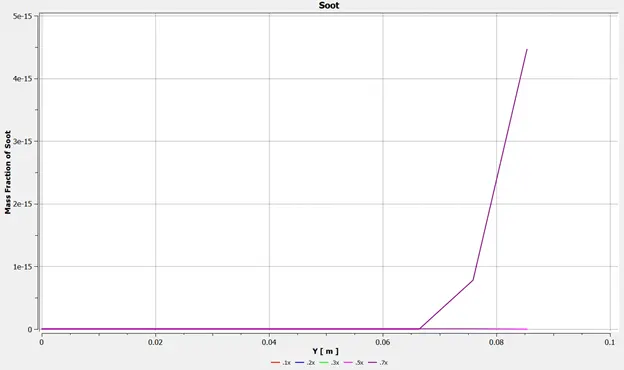
Soot Mass Fraction
Contour
Plot
CASE 4
CH4- 85% , Water(H2O) – 15%
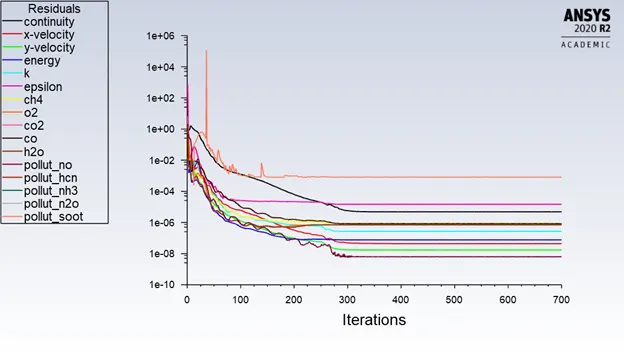
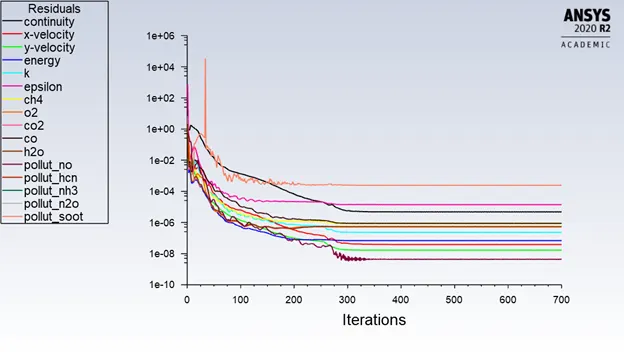
Residuals
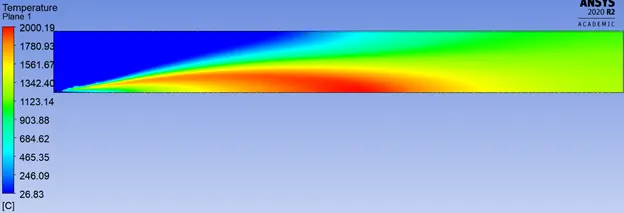
Temperature
Contour
Plot
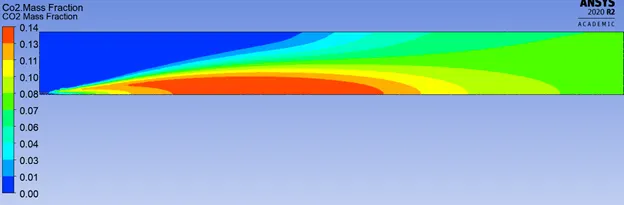
CO2 Mass Fraction
Contour
Plot
H20 Mass Fraction
Contour
Plot
CH4 Mass Fraction
Contour
Plot
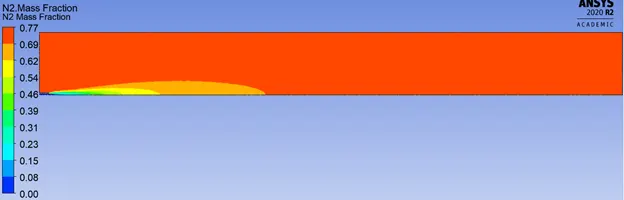
N2 Mass Fraction
Contour
Plot
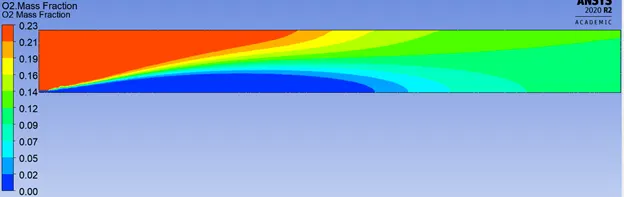
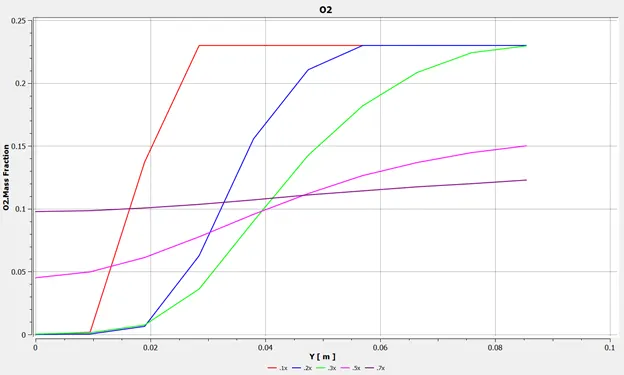
O2 Mass Fraction
Contour
Plot
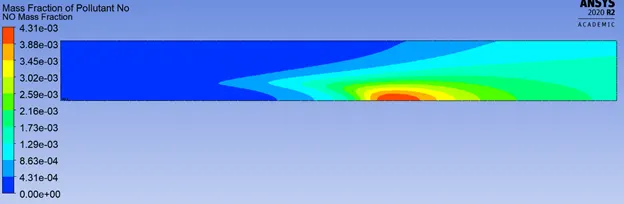
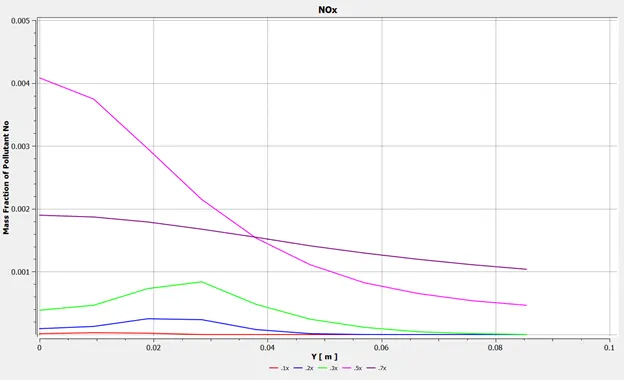
NOx Mass Fraction(NO)
Contour
Plot
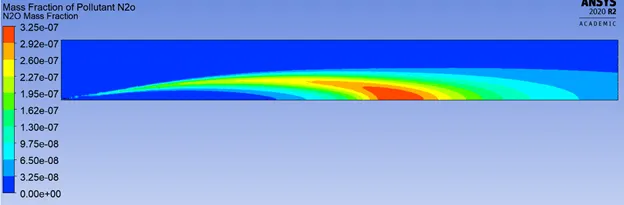
NOx Mass Fraction (N2O)
Contour
Plot
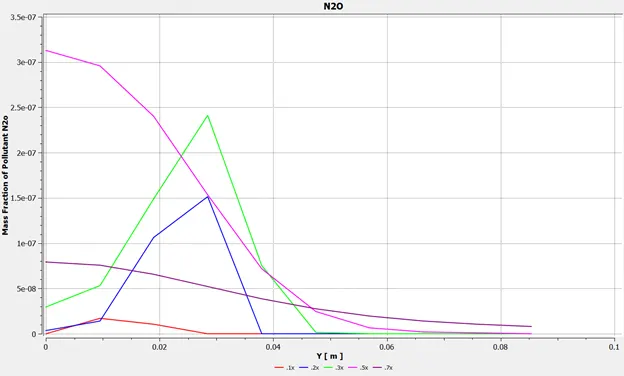
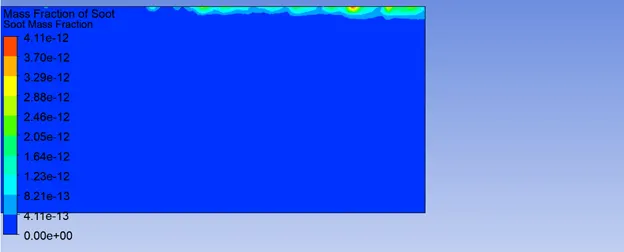
Soot Mass Fraction
Contour
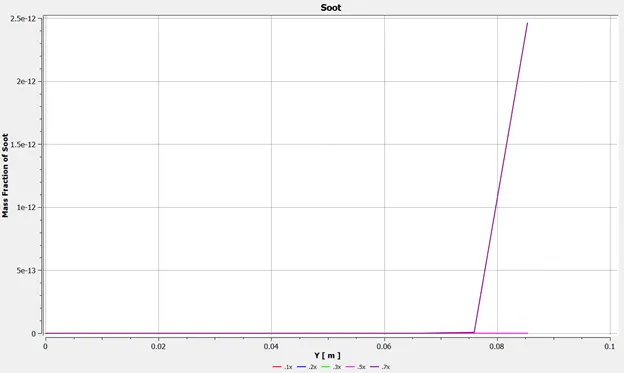
Plot
CASE 5
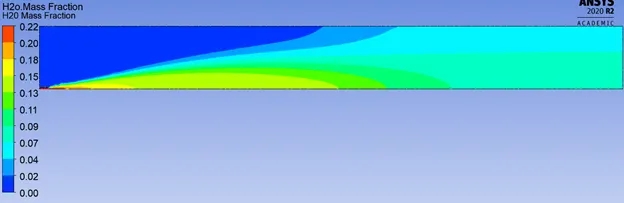
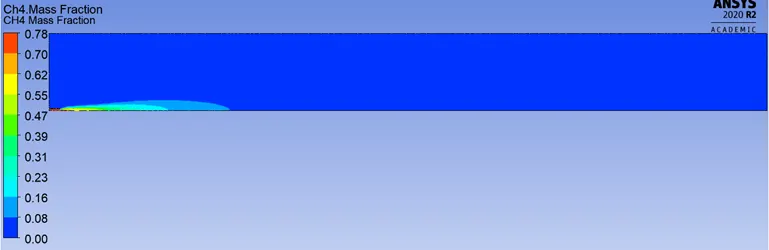
CH4- 80% , Water(H2O) – 20%
Residuals
Temperature
Contour
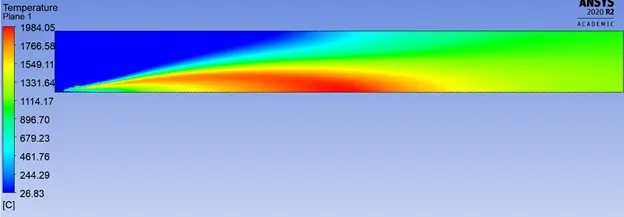
Plot
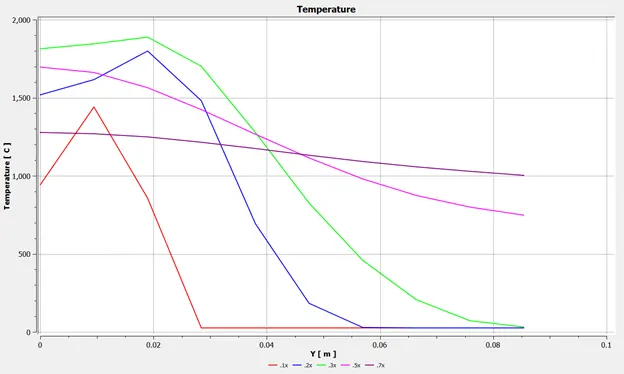
CO2 Mass Fraction
Contour
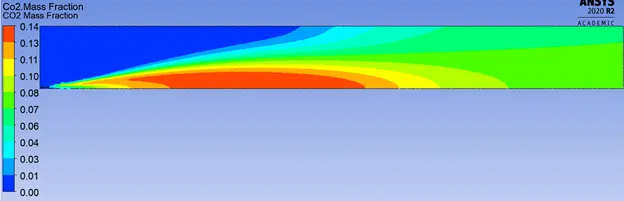
Plot
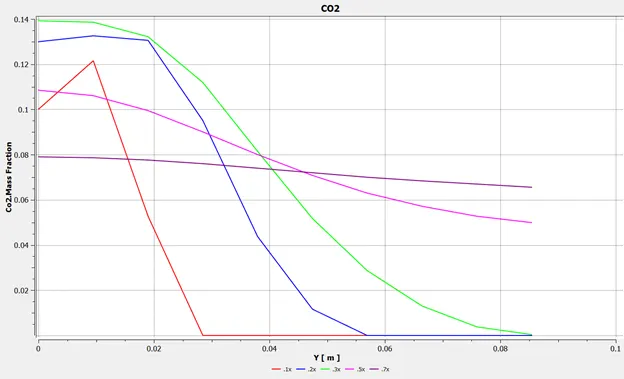
H20 Mass Fraction
Contour
Plot
CH4 Mass Fraction
Contour
Plot
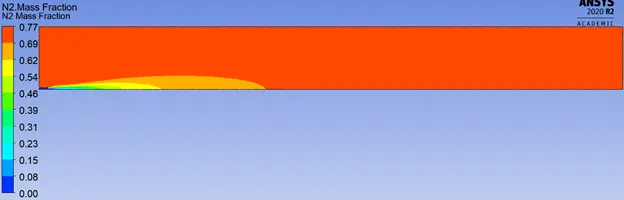
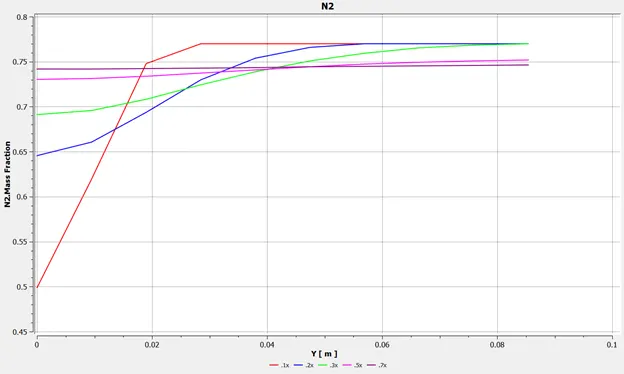
N2 Mass Fraction
Contour
Plot
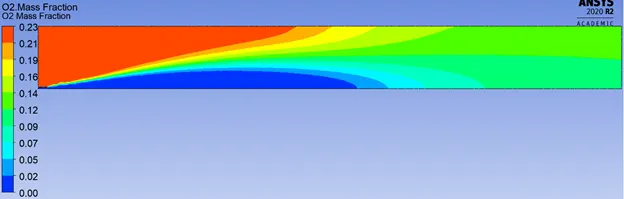
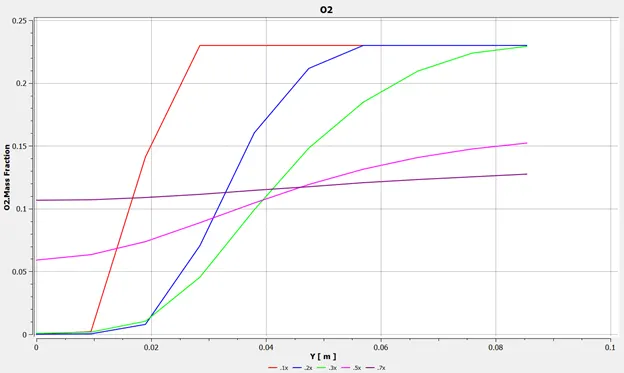
O2 Mass Fraction
Contour
Plot
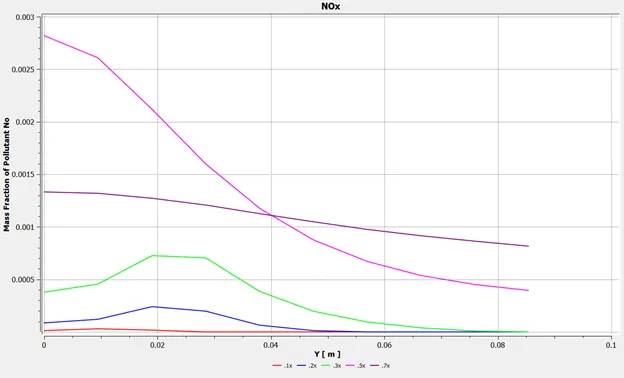
NOx Mass Fraction (NO)
Contour
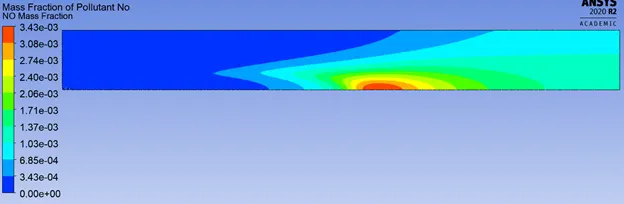
Plot
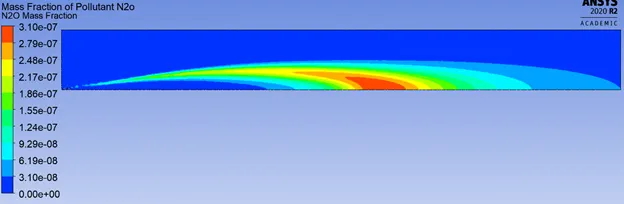
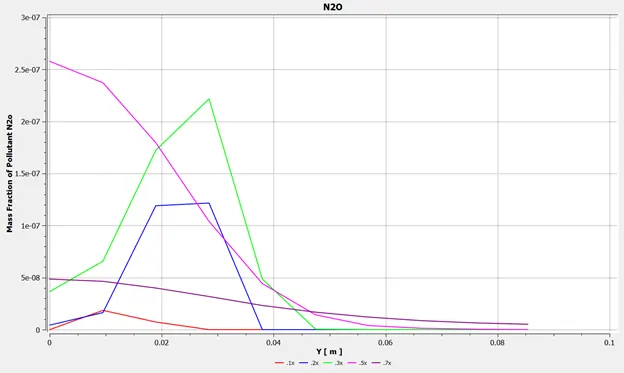
NOx Mass Fraction (N2O)
Contour
Plot
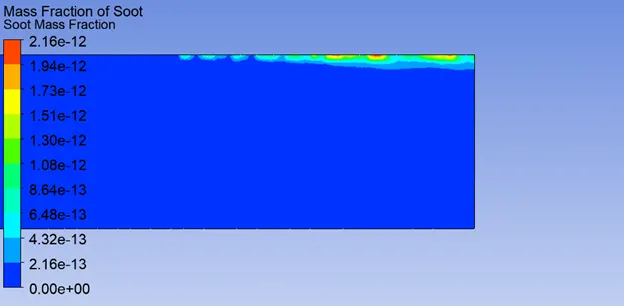
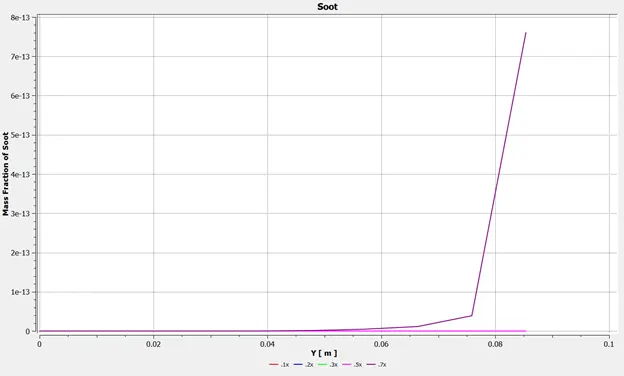
Soot Mass Fraction
Contour
Plot
CASE 6
CH4- 75%, Water (H2O) – 25%
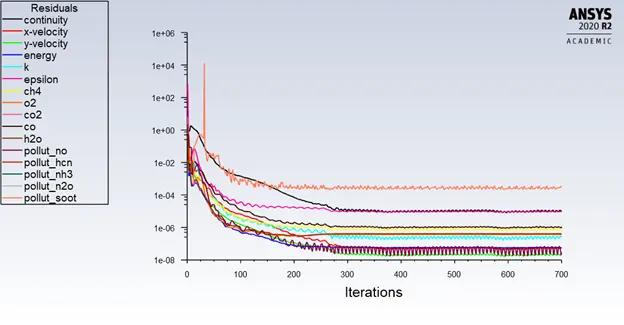
Residuals
Temperature
Contour
Plot
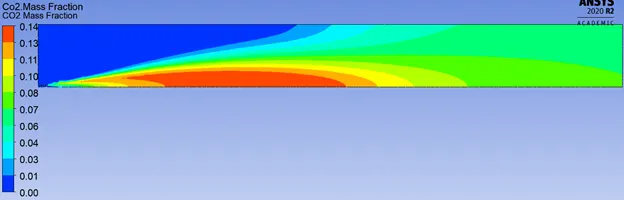
CO2 Mass Fraction
Contour
Plot
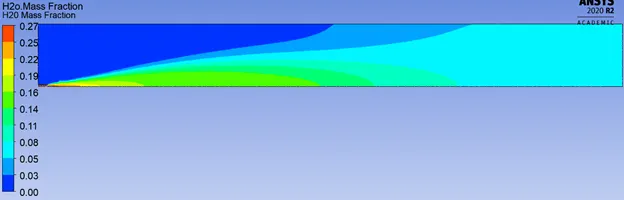
H20 Mass Fraction
Contour
Plot
CH4 Mass Fraction
Contour
Plot
N2 Mass Fraction
Contour
Plot
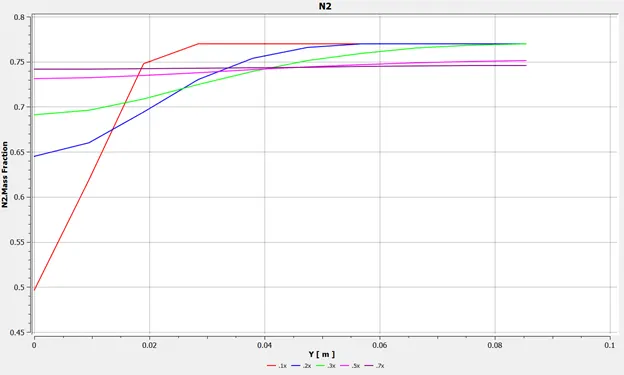
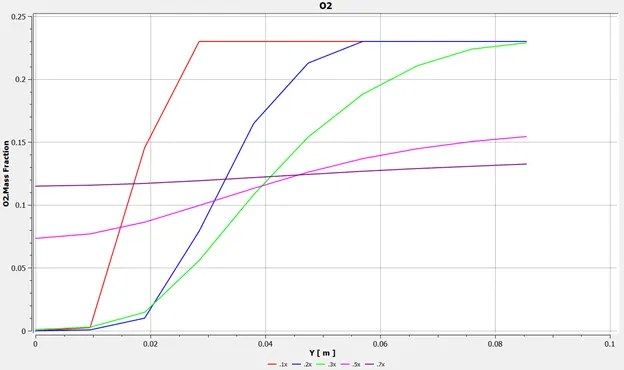
O2 Mass Fraction
Contour
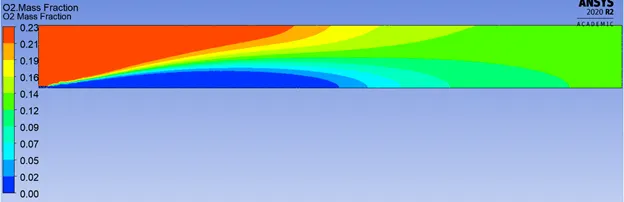
Plot
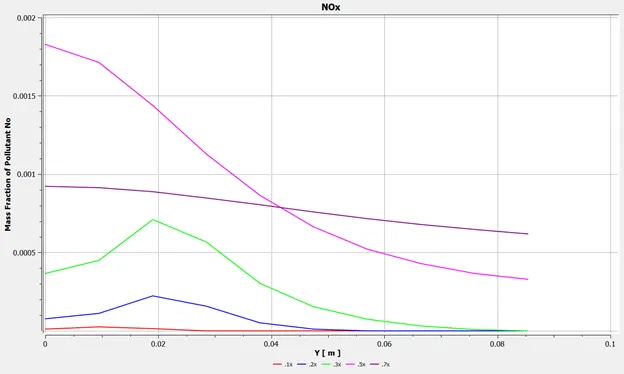
NOx Mass Fraction (NO)
Contour
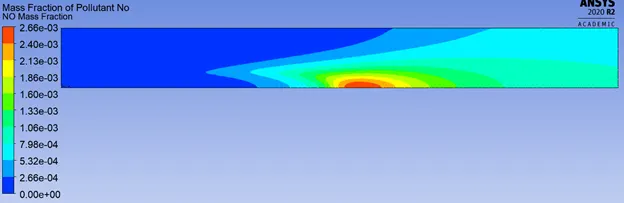
Plot
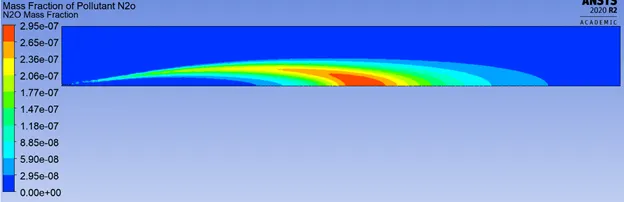
NOx Mass Fraction (N2O)
Contour
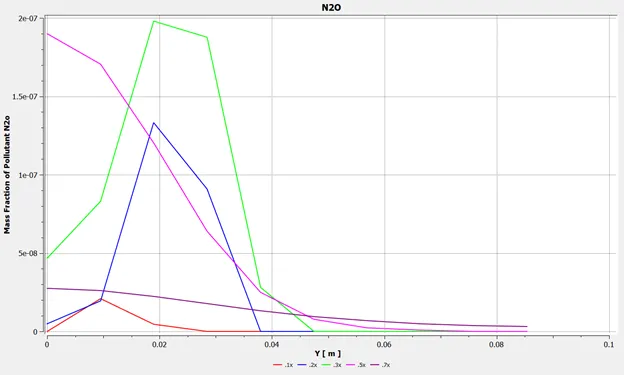
Plot
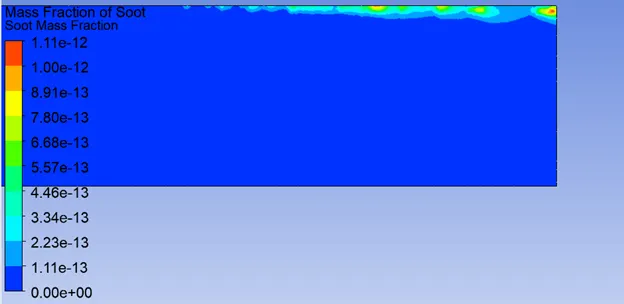
Soot Mass Fraction
Contour
Plot
CASE 7
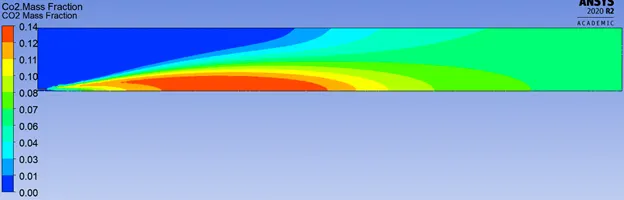
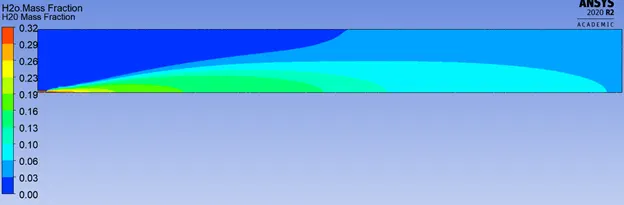
CH4- 70%, Water (H2O) – 30%
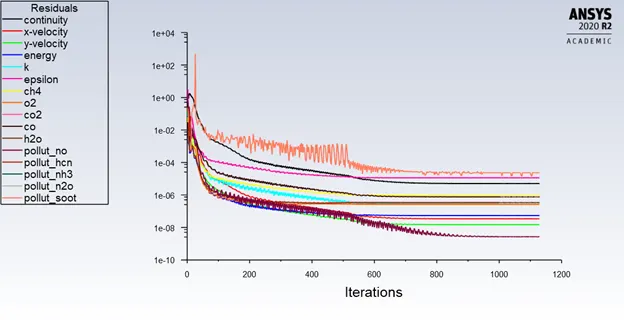
Residuals
Temperature
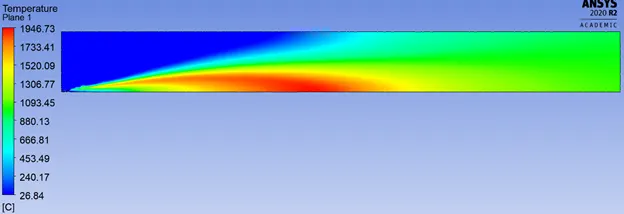
Contour
Plot
CO2 Mass Fraction
Contour
Plot
H20 Mass Fraction
Contour
Plot
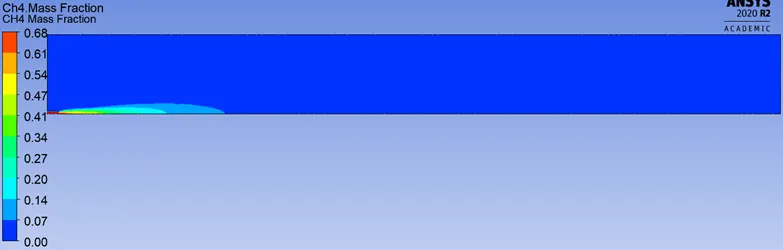
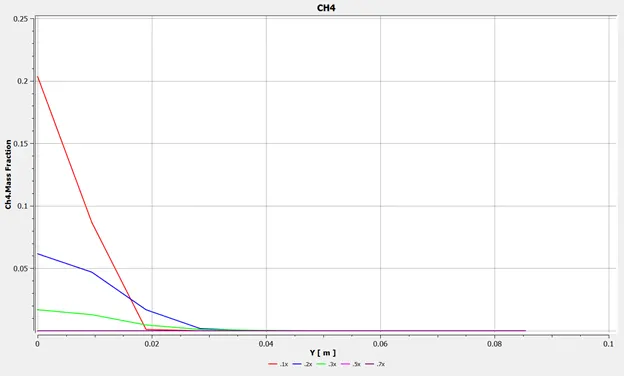
CH4 Mass Fraction
Contour
Plot
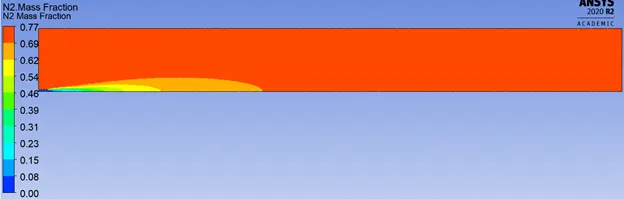
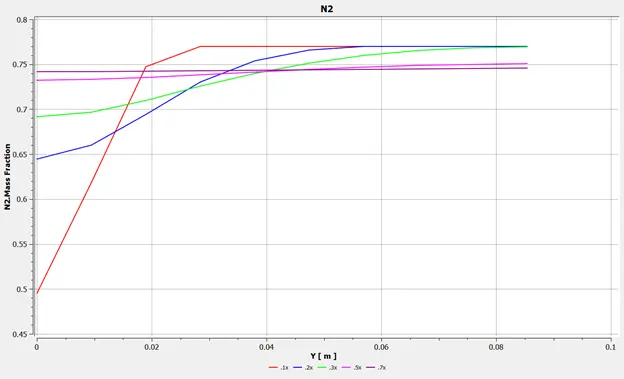
N2 Mass Fraction
Contour
Plot
O2 Mass Fraction
Contour
Plot
NOx Mass Fraction (NO)
Contour
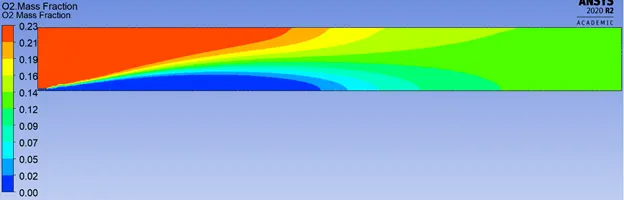
Plot
NOx Mass Fraction (N2O)
Contour
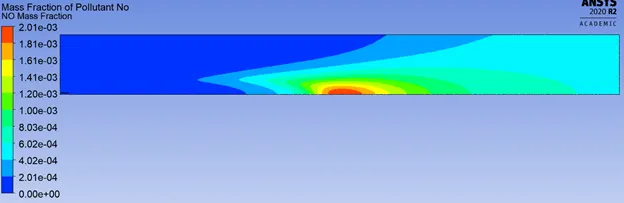
Plot
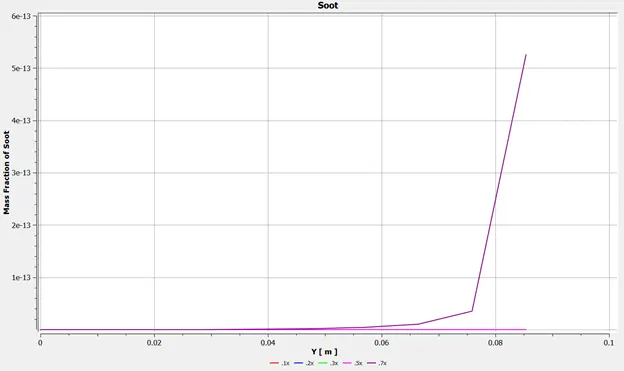
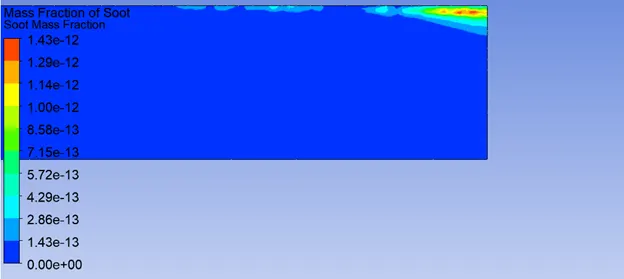
Soot Mass Fraction
Contour
Plot
OBSERVATIONS
|
Case |
Ratio of Methane and water |
Temp |
Mass Fraction |
|||||||
|
CH4 |
H20 |
CO2 |
O2 |
N2 |
NO |
N2O |
Soot |
|||
|
1 |
1:00 |
2038.8 |
1 |
0.120 |
0.143 |
0.23 |
0.77 |
7.76E-03 |
3.78E-07 |
1.54E-11 |
|
2 |
.95 : .05 |
2027.28 |
0.944 |
0.124 |
0.142 |
0.23 |
0.77 |
6.45E-03 |
3.58E-07 |
9.50E-12 |
|
3 |
.90 : .10 |
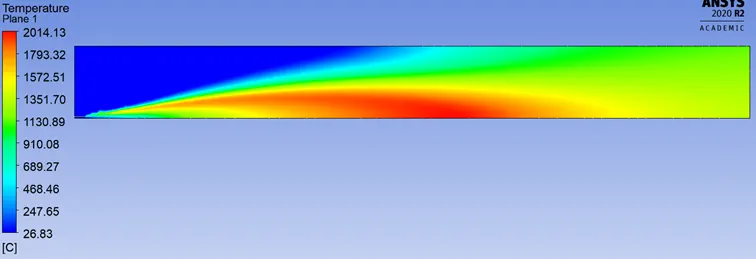
2014.13 |
0.889 |
0.128 |
0.142 |
0.24 |
0.77 |
5.30E-03 |
3.40E-07 |
6.79E-12 |
|
4 |
.85 : .15 |
2000.19 |
0.834 |
0.165 |
0.14 |
0.23 |
0.77 |
4.31E-03 |
3.25E-07 |
4.11E-12 |
|
5 |
.80 : .20 |
1984.05 |
0.78 |
0.219 |
0.14 |
0.23 |
0.77 |
3.42E-03 |
3.10E-07 |
2.16E-12 |
|
6 |
.75 : .25 |
1966.48 |
0.728 |
0.272 |
0.139 |
0.23 |
0.77 |
2.66E-03 |
2.95E-07 |
1.11E-12 |
|
7 |
.70 : .30 |
1946.73 |
0.675 |
0.325 |
0.138 |
0.23 |
0.77 |
2.00E-03 |
2.80E-07 |
1.43E-12 |
INFERENCES
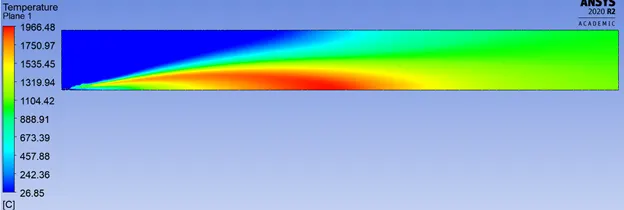
The addition of water to the fuel mix reduces the maximum temperature of combustion from 2038.8 C to 1946.73 C as the percentage of water increases from 5% to 30%
The mass fractions of oxides of nitrogen reduce as the percentage of water increases
The mass fraction of soot is higher for a 100% methane case but reduces the percentage of water increases, however after the percentage of water crosses 25% the mass fraction of soot increases.