Week 10 - Simulating Combustion of Natural Gas.
Aim
Perform a combustion simulation on the given combustor geometry using Methane and air to evaluate the mass fractions of the various species and emissions along the combustor. Further, increase the water content of the fuel and evaluate the decrease in emissions if any.
Introduction
Combustion processes which often take place with fuel and oxidiser can be segregated into many stages. Each stage of the combustion process leads to the creation of intermediate species until ultimately reaching the end products of combustion. This step-by-step combustion process can be simulated using a simple single-step global reaction or a detailed multi-step reaction process containing hundreds of reactions and species. Choosing the right model for the problem can be done based on the scope of the problem, desired fidelity and computational budget.
Emissions are a crucial part of combustion and should also be modelled while performing combustion analysis. Emissions can be in the form of oxides of Nitrogen predominantly (NO) and Carbon Monoxide (CO), and soot which is the particulate matter of unburnt carbon created during combustion. Reduction of emissions and soot is highly desired in the combustion process and may require changes in combustor design or fuel/air composition to achieve it. One such method discussed by Chybowski et al [1], is the addition of water into the fuel inlet which is a feasible way of reducing NOx without altering the combustor design.
In the current analysis, the combustion of methane in air is simulated in the given combustor geometry to evaluate the mass fractions of CO2, H2O, CH4, N2, O2, NOx emissions & Soot formation along the combustor. Additionally, water is added along with the fuel at the inlet in mole fraction percentages of 5%, 10%, 15%, 20%, 25% and 30% to evaluate the reduction NOx and soot emissions.
Method
Geometry and Fluid Domain
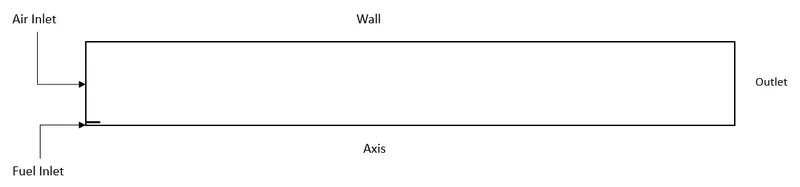
The given simplified geometry of the combustor can be seen in the schematic below. The axial length of the combustor is 0.79m and its height is 0.085m. The height of the fuel inlet is 0.00165m and the air inlet is 0.082m. 2D Axisymmetric simulations were performed on the simplified geometry.
Mesh Generation
A structured quadrilateral mesh was generated for the fluid domain with sizings of 5.5e-3m. The fuel inlet is meshed with at least 3 cells along its height. The image below shows the mesh on the lower left quadrant of the fluid volume.


Combustion Model
The two-step methane-air model developed by Franzelli et al [2], was chosen for this analysis. This model has 6 species and 2 reactions and is known to capture the intermediate species well compared to more complex models. The chemical kinetics mechanism can be seen in the table below.
| S. No. | Reaction | Pre-Exponential Factor | Activation Energy (J/kgmol) | Temperature Exponent |
| 1 | `CH_4 + 1.5 O_2 <=> CO + 2H_2O` | 5.012e+11 | 2e+8 | 0 |
| 2 | `CO + 0.5O2 <=> CO_2` | 2.239e+12 | 1.7e+8 | 0 |
Solver and Boundary Condition
All simulations were conducted on ANSYS Fluent 2022 R2. The air and fuel inlets were set to a velocity inlet boundary condition. The air inlet was set to a velocity of 0.5m/s, a temperature of 300K and a mass fraction of `O_2` species of 0.23. The fuel inlet was set to a velocity of 80m/s and a temperature of 300K.
The mass fraction of the `CH_4` and `H_2O` species in the fuel inlet for the various mole fraction percentages of water in the fuel can be seen in the table below.
| Species |
0% Water |
5% Water |
10% Water |
15% Water |
20% Water |
25% Water |
30% Water |
| `CH_4`- Mass Fraction | 1 | 0.9442 | 0.889 | 0.835 | 0.781 | 0.728 | 0.675 |
| `H_2O`- Mass Fraction | 0 | 0.0558 | 0.11 | 0.165 | 0.219 | 0.272 | 0.325 |
A pressure outlet boundary condition was set at the outlet with 0 gauge pressure relative to the atmosphere. All walls were set to no-slip condition and an axis boundary condition was set to the axis boundary.
The steady-state pressure-based PV coupled scheme was used to discretize the flow parameters. The energy equation was enabled for the simulations. Turbulence was modelled using the two equation K-Omega SST turbulence model. Combustion reactions were modelled by the volumetric species transport model with diffusion energy source enabled. The Eddy dissipation method was used to model the turbulence-chemistry interactions. The density of the species was estimated using the incompressible ideal gas law and the specific heat capacity was estimated by the mixing law. Thermal and Prompt NOx estimations were enabled to predict the NOx generation due to oxidation of atmospheric nitrogen and the high-speed reactions at the flame front respectively. The one-step soot model was used to predict the presence of soot in the domain due to combustion.
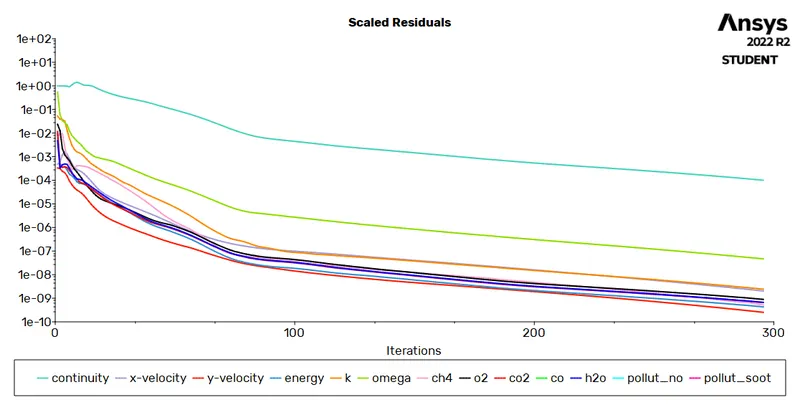
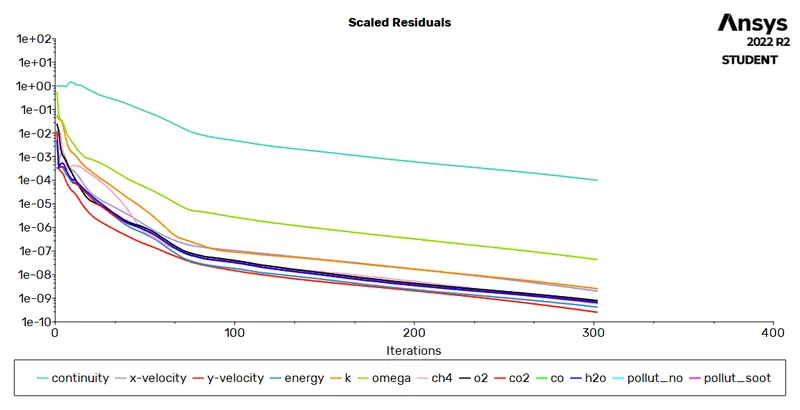
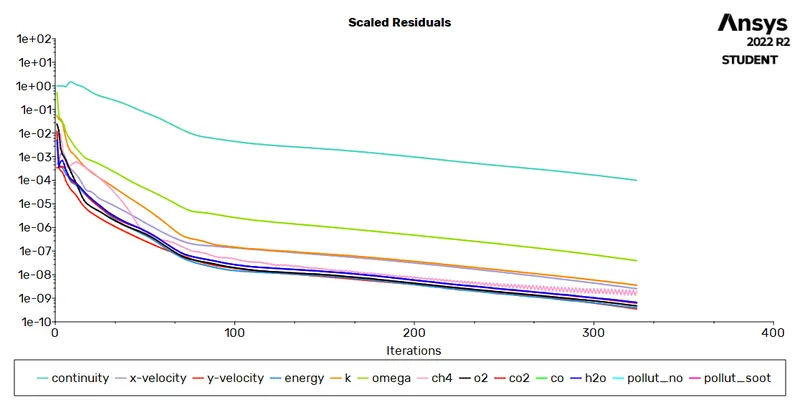
The second order scheme was used to estimate the pressure and the second order upwind scheme was used to estimate momentum, energy, turbulence parameters and the species. The solution was initialized by a hybrid initialization. The simulation was run with pseudo transient time stepping with an automatic global conservative length scale. Convergence was ensured by monitoring the scaled residuals to reach below 1e-4. Simulations typically took around 300 iterations to achieve convergence.
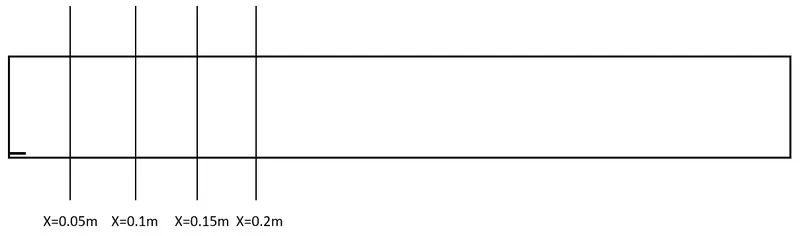
Line probes at locations x=0.05m, 0.1m, 0.15m, and 0.2m were created to measure the profiles of the mass fractions of the various species as shown in the schematic below.
Results
Part 1: 0% Mole Fraction of Water in Fuel
The image below shows the scaled residuals of the simulation to ensure solution convergence.
The mass fraction profiles at the line probes for the various species can be seen below.
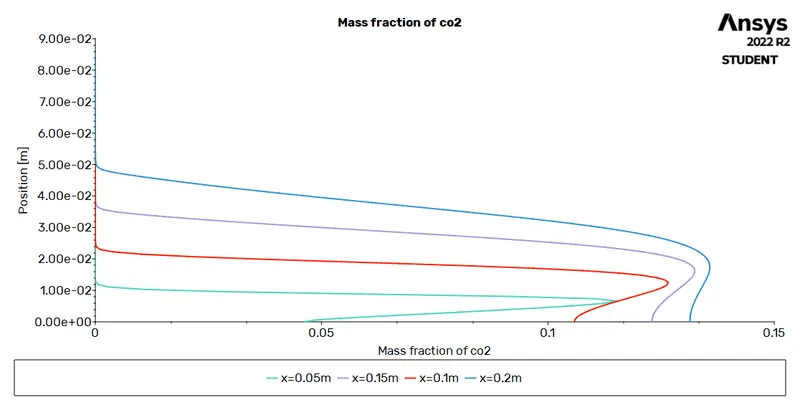
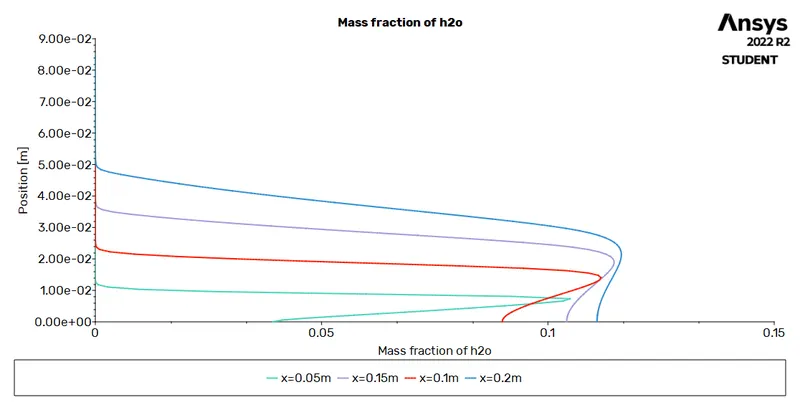
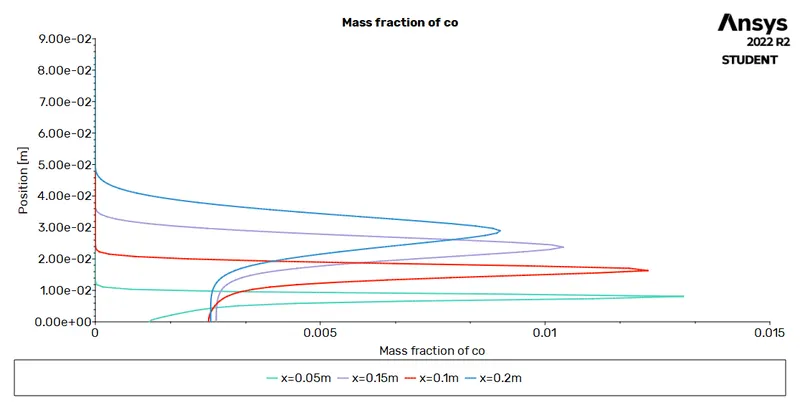
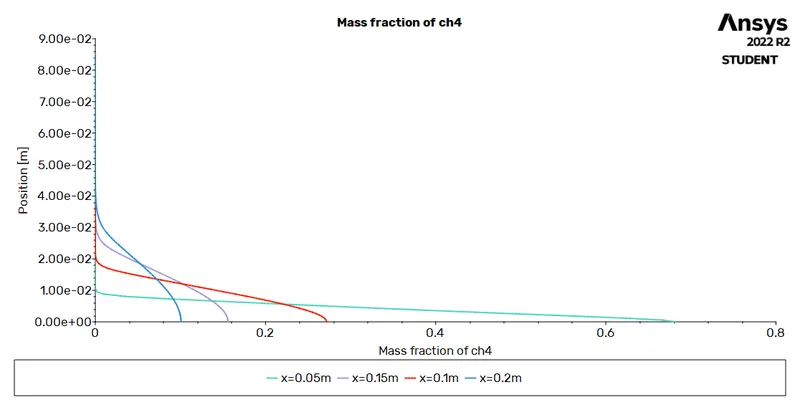
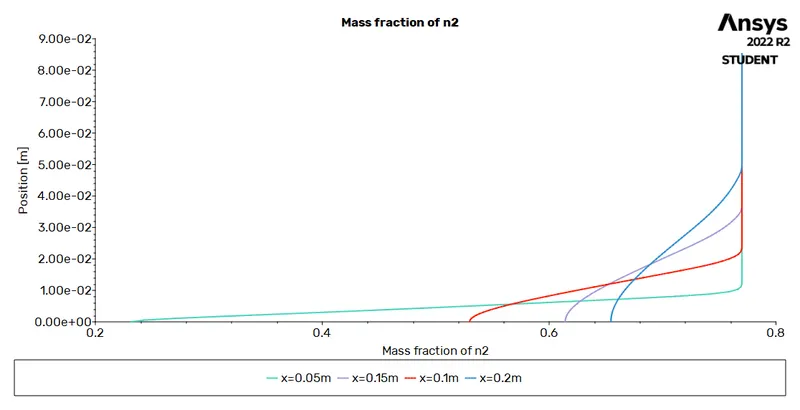
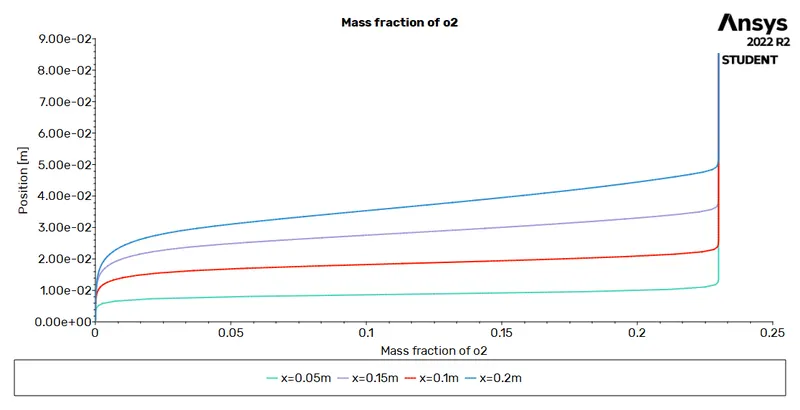
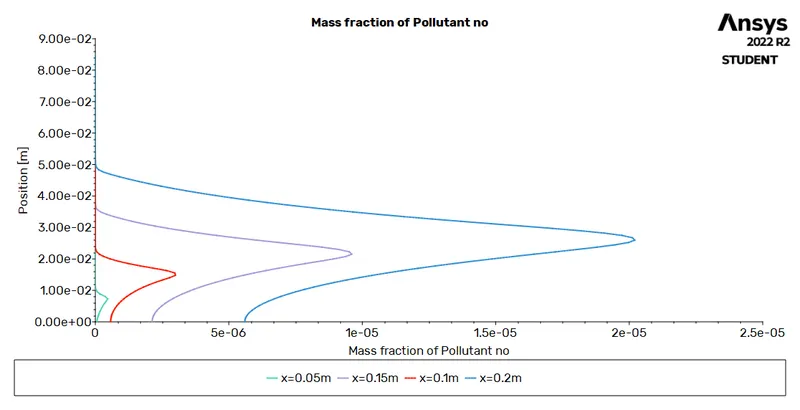
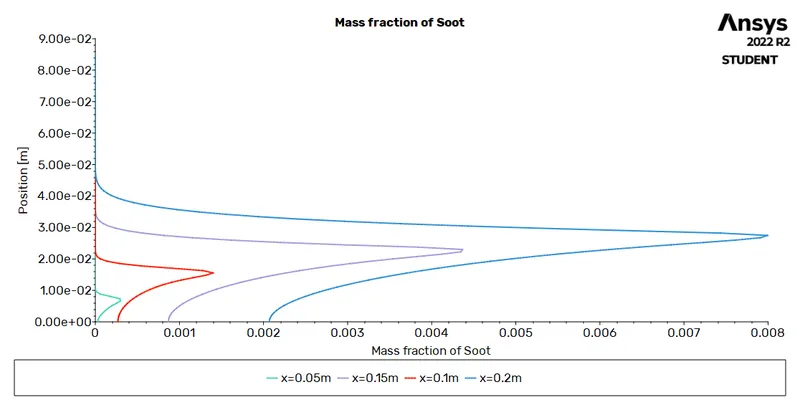
From the above profiles, it is clear that the mass fraction of the final products `CO_2` and `H_2O` get higher downstream of the combustor. This is due to the reactions taking place along the length of the combustor which leads to the accumulation of the reaction products. The mass fraction of the intermediate species `CO` is seen to diminish downstream of the combustor and can be attributed to the generation of the final reaction products as the various reactions occur in the combustor. Mass fractions of NO and Soot are seen to increase downstream of the combustor as well
Part 2: Addition of Water to the fuel
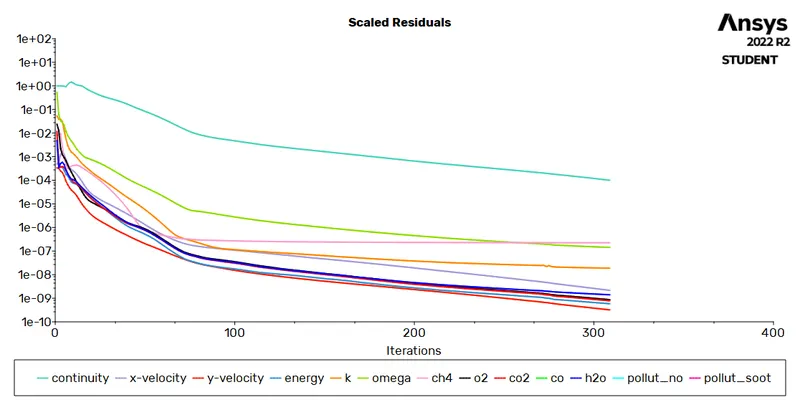
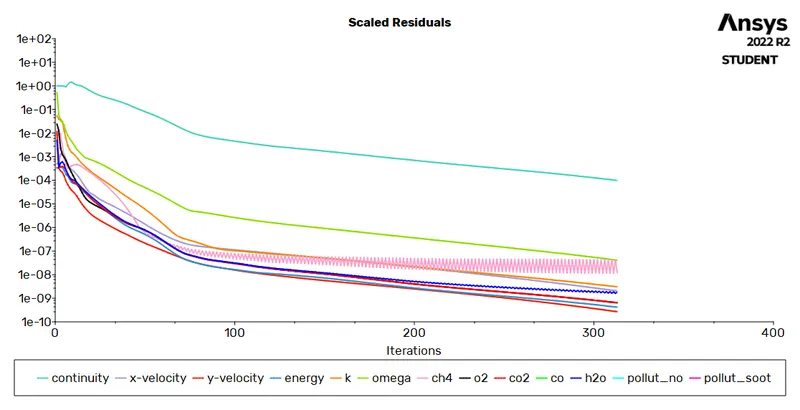
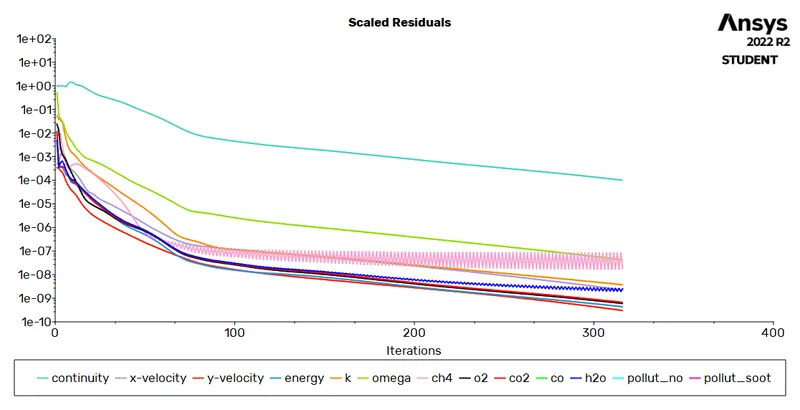
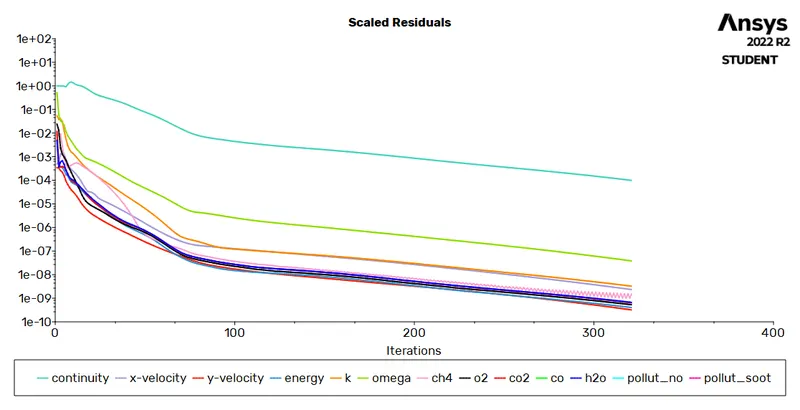
The following images show the scaled residuals of the various cases to ensure convergence of the solution.
5% water
10% water
15% water
20% water
25% water
30% water
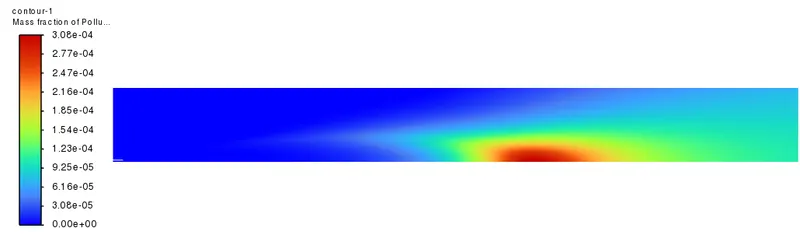
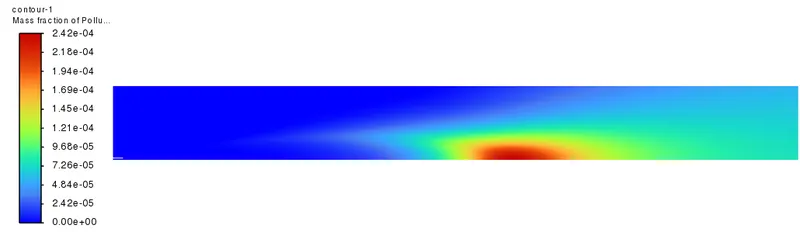
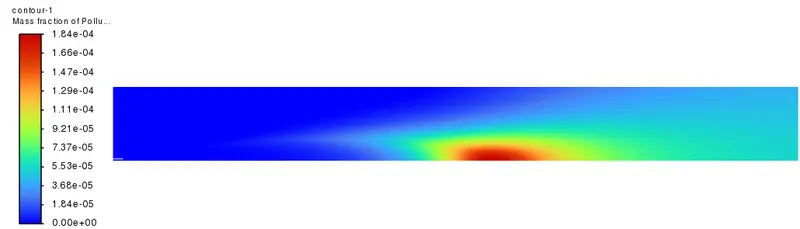
The images below illustrate the mass fractions of NO for the various percentages of water in the fuel.
5% water
10% water
15% water
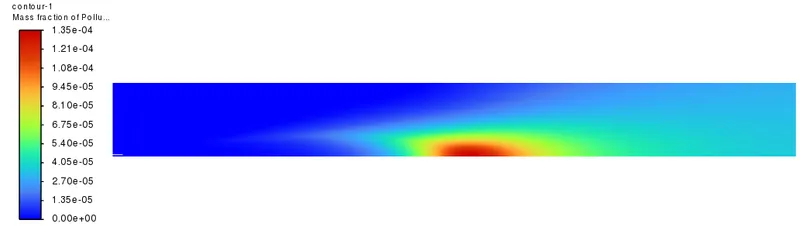
20% water
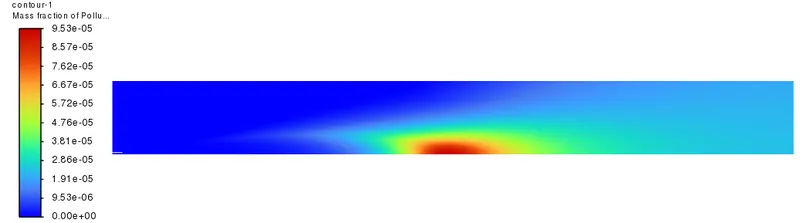
25% water
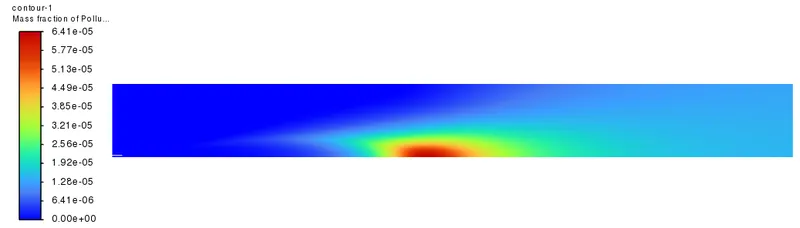
30% water
From the images above, the distribution of the NO is similar in all the cases however the mass fraction value of NO is seen to decrease steadily with an increase in the percentage of water in the fuel.
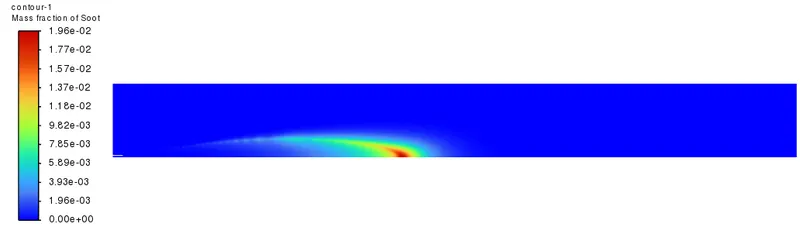
The images below illustrate the mass fractions of Soot for the various percentages of water in the fuel.
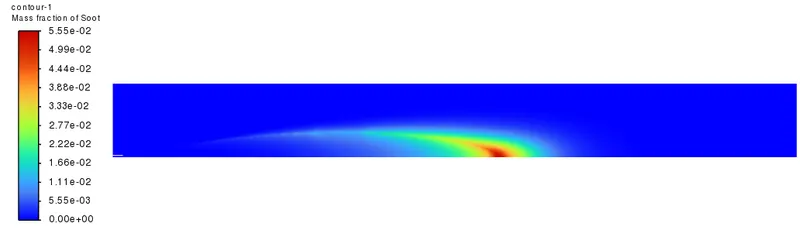
5% water
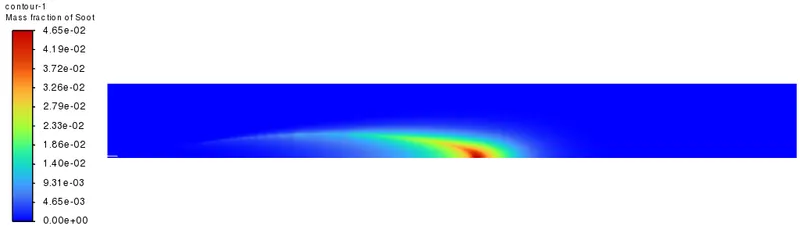
10% water
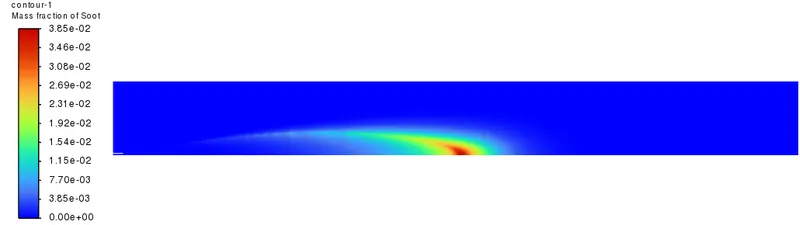
15% water
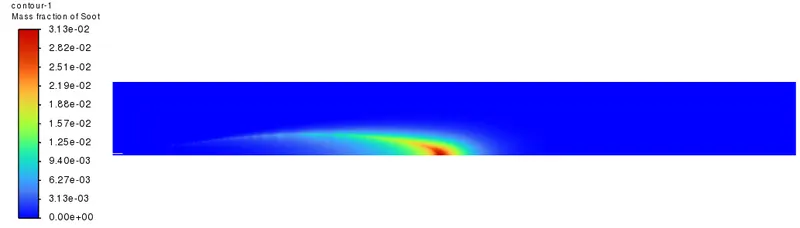
20% water
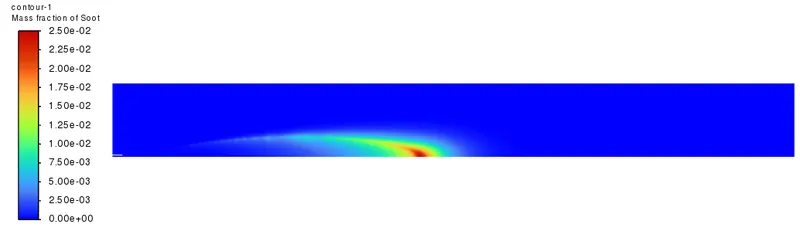
25% water
30% water
Similar to the distribution of the NO, the distribution of the soot is the same for all the cases however the mass fraction value of the Soot decreases significantly with the increase in the percentage of water in the fuel.
The images below illustrate the profiles of the Mass fraction of NO and Soot at the outlet for various percentages of `H_2O ` in the fuel.
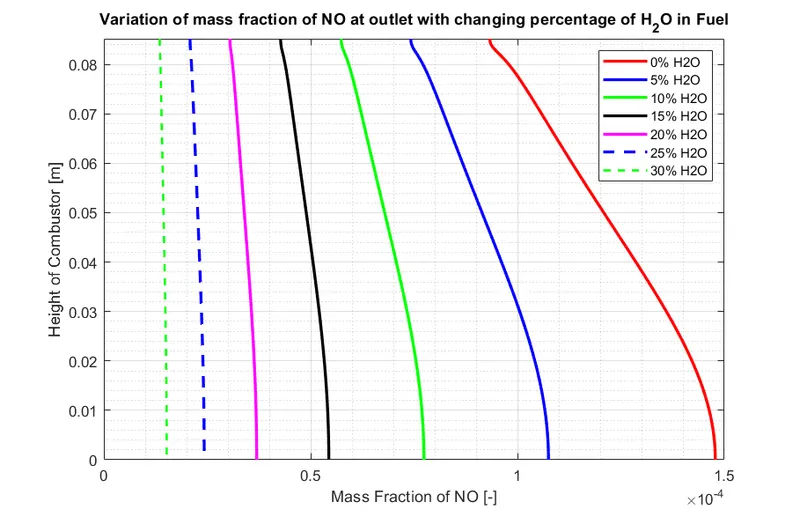
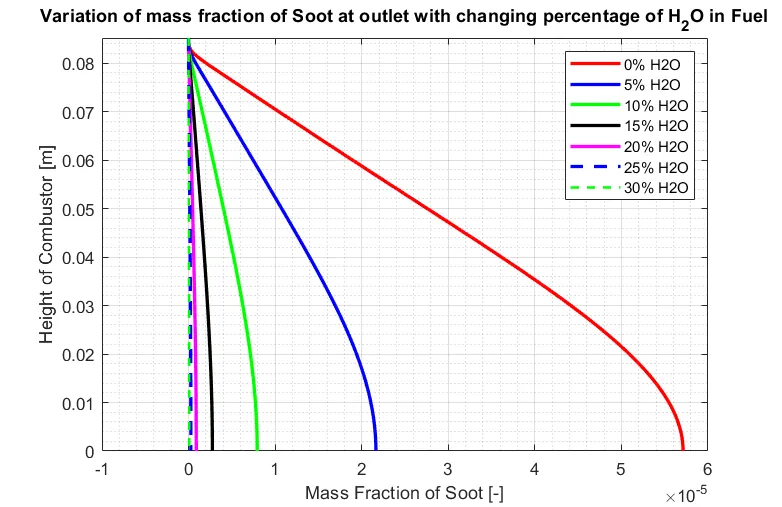
From the plots, it is clear that the mass fraction of NO and soot are seen to decrease with the addition of water to the fuel as reflected in contours seen previously.
To estimate the temperature generated by the combustion process, the area-weighted average of temperature at the outlet is plotted for the increasing water percentage in the fuel as seen below.
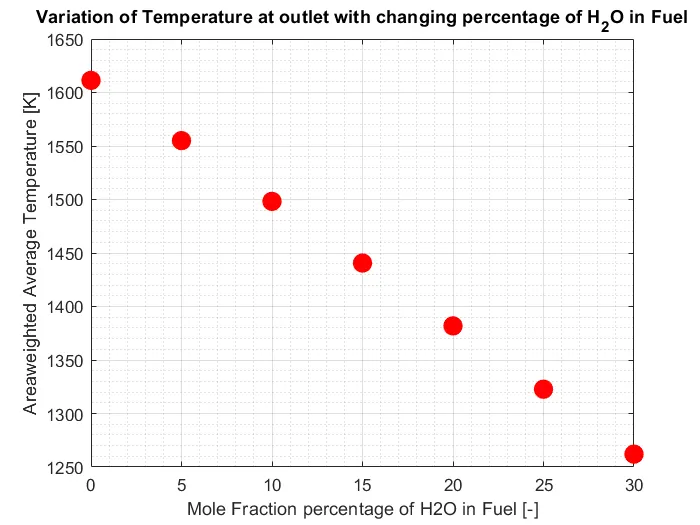
From the above image, the temperature at the outlet is seen to decrease with increasing water content in the fuel. This decrease in temperature will adversely affect the performance and efficiency of the combustor and thus discourages the addition of water to the fuel. From the current study, 10% water in the fuel shows significant improvement in the reduction of emissions while still maintaining a high outlet temperature to not compromise on combustor performance. Therefore, a 10% water mole fraction in the fuel can be deemed an optimal design point in the current configuration.
Conclusion
Combustion simulations were performed on the given combustor geometry using the methane-air mixture to investigate the mass fractions of the various species and emissions along the combustor. An additional study to reduce emissions was conducted by adding water to the fuel during combustion. This method was seen to be successful in reducing the emissions, however significant drop in the outlet temperature was observed with increasing water content in the fuel. A 10% water mole fraction in the fuel was seen to be an optimal design point to maintain the efficient working of the combustor and significantly reduce emissions.
References
- Chybowski, L., Laskowski, R. & Gawdzińska, K. An overview of systems supplying water into the combustion chamber of diesel engines to decrease the amount of nitrogen oxides in exhaust gas. J Mar Sci Technol 20, 393–405 (2015). https://doi.org/10.1007/s00773-015-0303-8.
- Benedetta Franzelli, Eleonore Riber, Laurent Y.M. Gicquel, Thierry Poinsot, Large Eddy Simulation of combustion instabilities in a lean partially premixed swirled flame, Combustion and Flame, Volume 159, Issue 2, 2012, Pages 621-637, ISSN 0010-2180, https://doi.org/10.1016/j.combustflame.2011.08.004.