Simulating Combustion of Natural Gas.
In this project, combustion of Methane will be simulated in a simple combustion chamber using Ansys Fluent.
Introduction
Combustion in my opinion is one of the most important process in the development of human-kind. Tons of our daily life operations and consumables won’t be available, if combustion wasn’t possible. Thus, it is important to study this really hot science of combustion.
In a very simple way, combustion is burning in presence of oxidizing agent, usually oxygen.
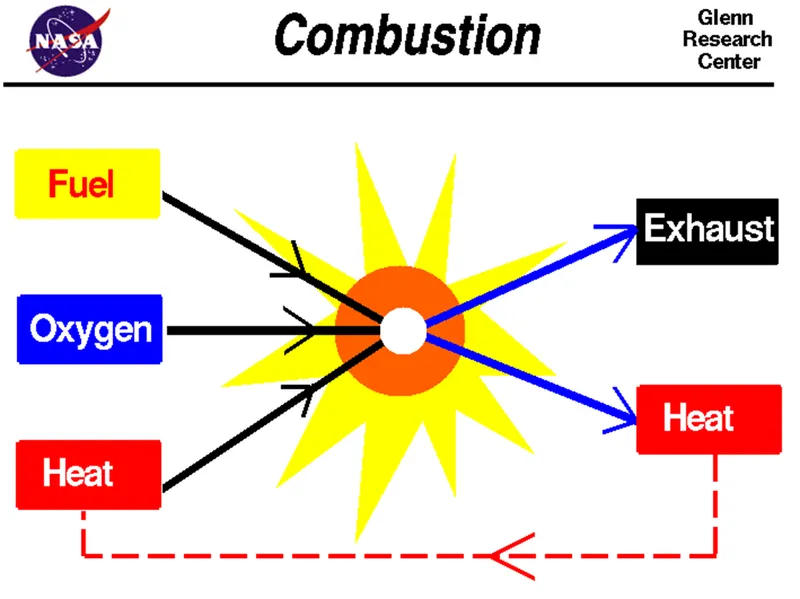
In a much more scientific way, Combustion, with rare exceptions, is a complex chemical process involving many steps that depend on the properties of the combustible substance. It is initiated by external factors such as heat, light, and sparks. The reaction sets in as the mixture of combustibles attains the ignition temperature. The combustion spreads from the ignition source to the adjacent layer of gas mixture; in turn, each point of the burning layer serves as an ignition source for the next adjacent layer, and so on. Combustion terminates when equilibrium is achieved between the total heat energies of the reactants and the total heat energies of the products. Most reactions terminate when what is called thermal equilibrium has been attained—i.e., when the energy of the reactants equals the energy of the products.
For a detail on the history, science, classification, applications, importance of combustion, read this blog on Britannica by Victor Nikolaevich Kondratiev.
Ansys Fluent
- Geometry
The geometry used for combustion chamber is a very simple cylindrical body, with fuel being released close to the axis.
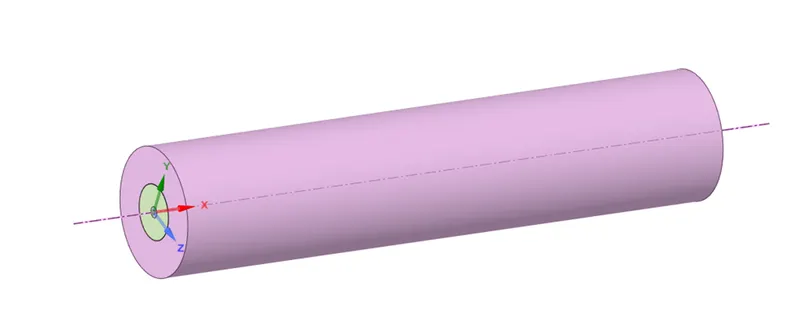
Computationally, simulating such a model directly will be too expensive because of the number of cells required to create a reasonable quality mesh to obtain good results. Since, the model is axis-symmetric, i.e., symmetric around the axis, we simplify the above cylindrical chamber to a rectangular chamber, and the results can be mimicked. This simplification comes at its own costs. Doing so, resists the movement of the gases in the third dimension. Since combustion is a highly turbulent flow, there is a fair chance that the flow is always 3-Dimensional. The results might not agree with the actual experimental data.
It wouldn’t be a big problem for us, as we are not looking at the quantitative data in this project. Our aim is to understand the pattern of combustion, its growth and the by-products produced.

Note – Always try to keep the axi-symmetric axis on x-axis.
- Meshing
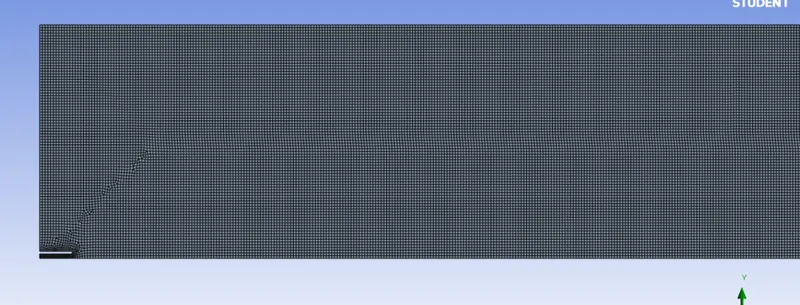
How fine the mesh should be is the choice of user. In this case, around 80000 elements/cells have been used.
Tips
- Switching on the proximity would be an ideal option to capture the effects under the fuel injector.
- Since the model is rectangular and does not have any internal irregularities, a hexahedral mesh would be the best option.
- Give appropriate named selections.
- Case Set-up
- 2D Space - Axisymmetry - Enabled (since we are using Axisymmetry)
- Viscous model - K-Epsilon (Any turbulent model should work fine)
- Steady state simulation (Interested in final state, rather than the process)
- Energy - Enabled (Since we are dealing with combustion, which obviously includes heat)
- Pressure based (incompressible flow)
- Gravity - Disabled (Optional)
- Species - Enable species transport
- Enable volumetric in reactions
- Enable inlet diffusion
- Mixture material – Methane and air
- Turbulence chemistry interaction - Eddy Dissipation
A fixed rate method is used when the exact starting point of ignition is to be studied. It is an expensive method. The Eddy Dissipation method is used when the final contours are of more interest than the ignition point. In this case, there is no ignition system or spot. Rather the cells whose k to epsilon ratio is higher than a specified value, automatically ignites.
- Air inlet - Species - Oxygen, mole fraction = 0.23, velocity = 0.5m/s
- Fuel inlet – Species – Methane, mole fraction = 1, velocity = 80m/s
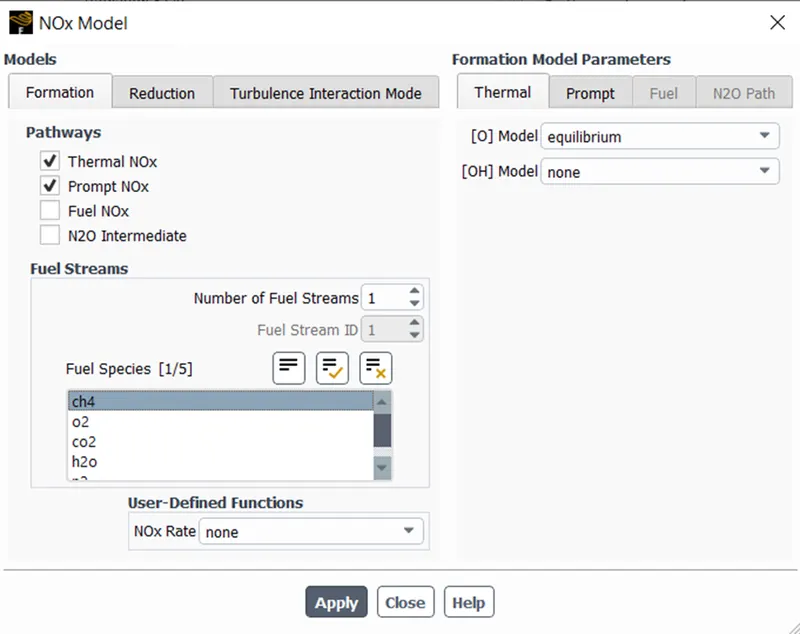
Ideally, in these cases, Nitrogen is inert in nature. But, sometimes at high temperatures, Nitrogen disassociates into atomic Nitrogen and reacts with oxygen to form NO and NO2. This is a major pollutant and is responsible for Acid rain.
- Nox settings (Type nox in search bar to find this setting)
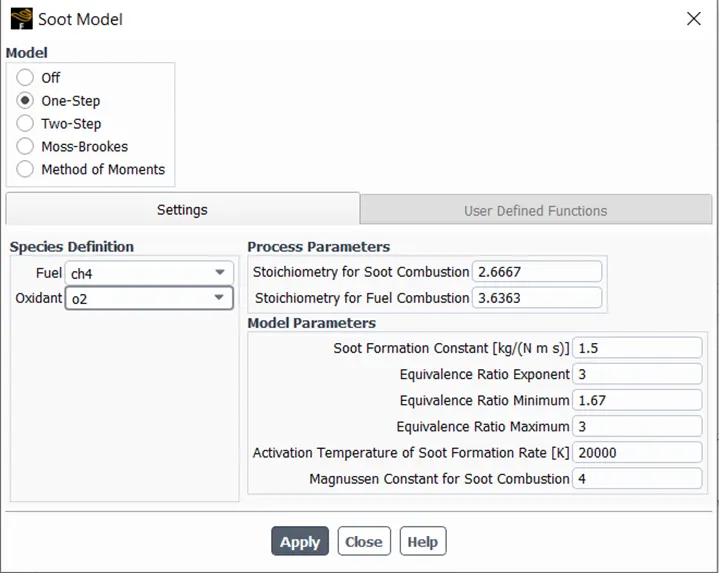
Sooth is a higher hydrocarbon and is a by-product of combustion. It alone is responsible for 1/4th of pollutants across the globe.
- Sooth settings (Type soot in search bar to find this setting)
Results
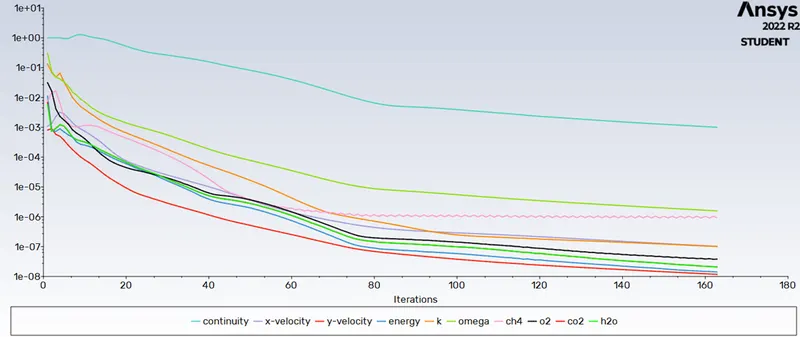
The solution converged at 163 iterations without any error. This is also reflected from residuals and other contours shown below.
- Residuals
- Velocity Contour
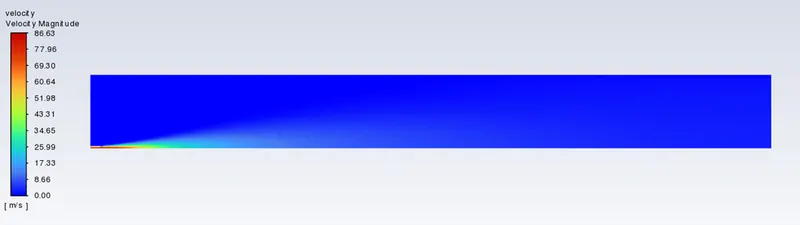
One, including me, would expect that at every cell where combustion occurs, there would be a rise in velocity. But this doesn’t seem to be the case. There is an instantaneous rise in velocity right after the fuel inlet. But it just keeps falling and gets stagnated, the velocity contour shows zero velocity at almost every place downstream.
I have no clue what might be the reason for this, please let me know what you think about this in the comments section.
- Temperature Contours
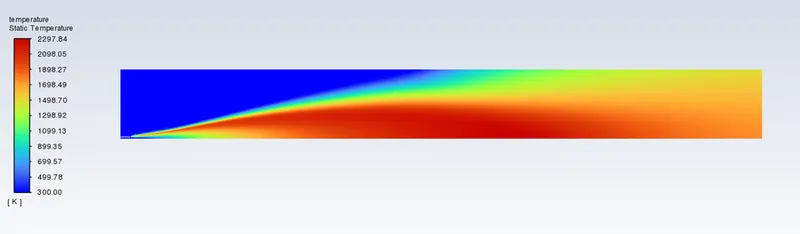
A neat thermal steady uniform boundary layer can be seen and the temperature at the outlet is uniform.
- O2 Mass Fraction (Reactant)
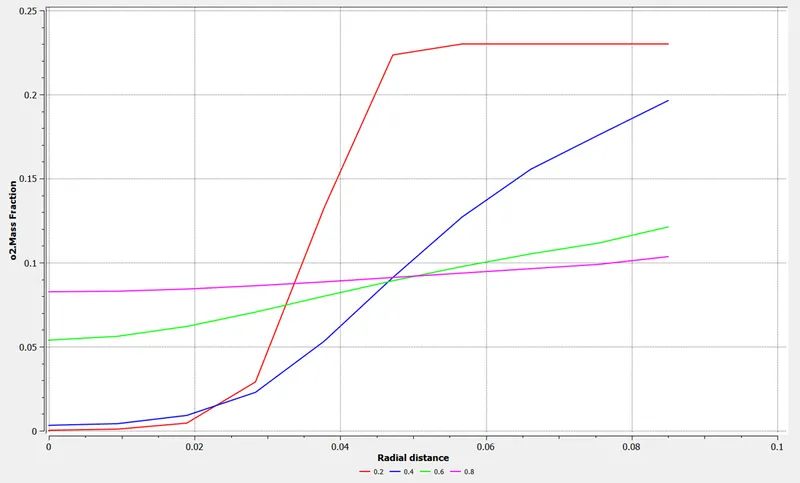
This chart represents Mass fraction of Substance along the radial direction at 4 different locations. The locations being 0.2m, 0.4m, 0.6m and 0.8m away from the inlet.
Closer to the inlet, the oxygen concentration is pretty low near the axis. This is understandable because there is a fuel inlet at that spot. But, as we move away from the inlet, it is noticeable that the oxygen concentration is considerably dropped. This is because it has been burned away.
- CH4 Mass Fraction (Reactant)
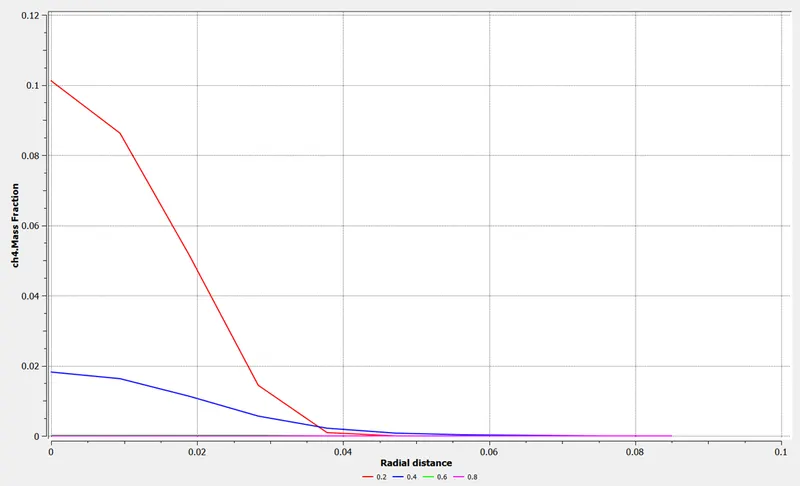
CH4 concentration is very high close to the axis and inlet. This is obviously because of the fuel inlet. As we move downstream Methane gets combusted very rapidly and its concentration becomes almost zero.
- CO2 Mass fraction (Product)
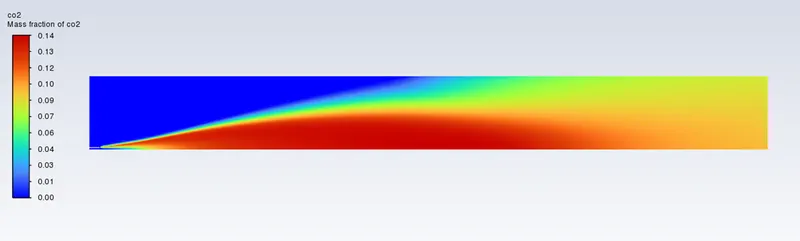
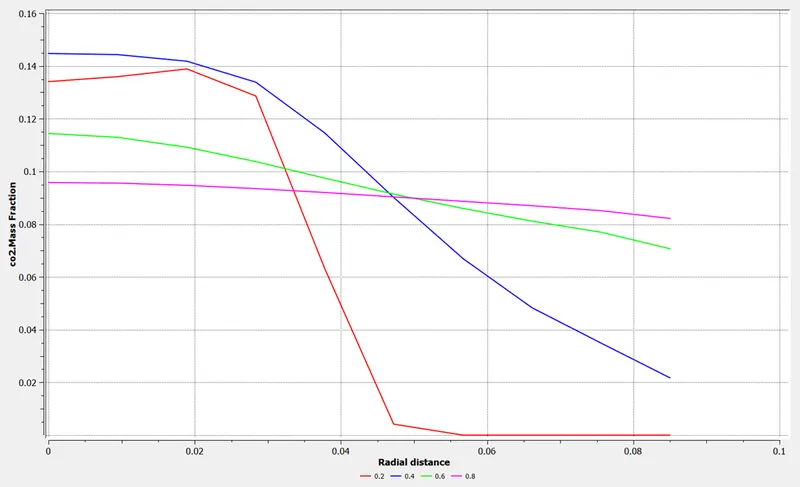
The chart perfectly matches the contours. The Co2 concentration is high near the axis until first half of the combustion chamber. As we move downstream, the Co2 concentration becomes uniform along the radial direction.
- H2O Mass fraction (Product)
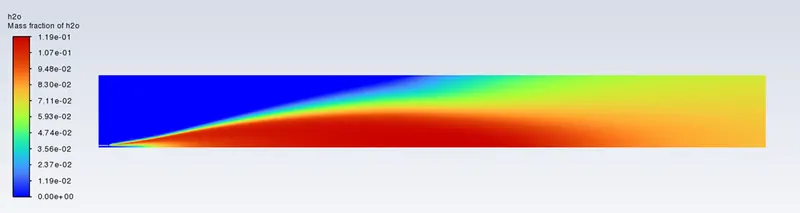
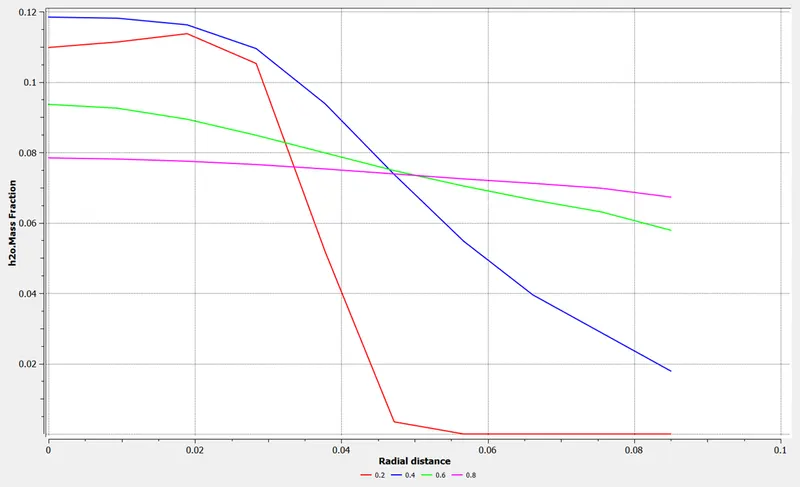
This chart represents Mass fraction of H2o along the radial direction at 4 different locations. The locations being 0.2m, 0.4m, 0.6m and 0.8m away from the inlet.
The chart perfectly matches the contours. The H2o concentration is high near the axis until first half of the combustion chamber. As we move downstream, the H2o concentration becomes uniform along the radial direction.
- Nox pollutant and Soot contours
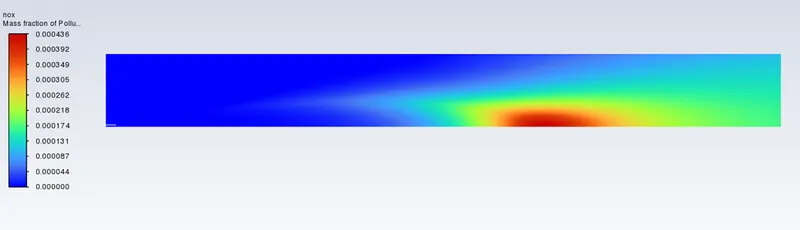
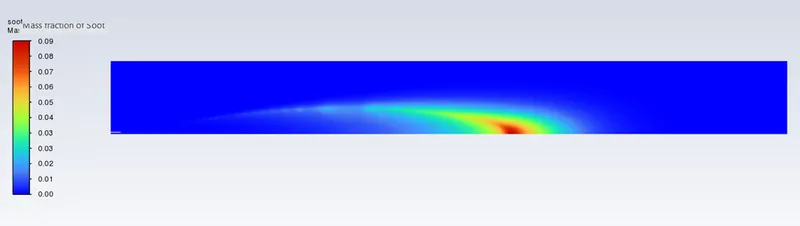
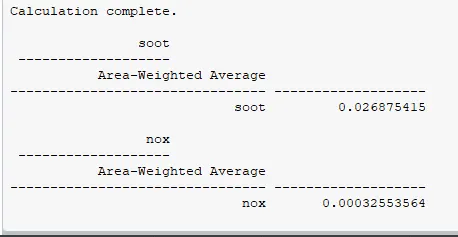
The above contours are quite interesting because of the specificity of the location of soot and pollutant formation. This is because of the high temperature combined with availability of the primary intermediate and end products of the initial reaction. The high temperatures disassociate Nitrogen molecule into atomic Nitrogen, which then forms Nitrogen oxide and Nitrogen Dioxide. Traces of Nitric acid might also form, which gets combusted again. Carbon dioxide, water and intermediate products can further react and form higher Hydrocarbons, which become soot.
The formation of soot and Nox have very harful effects on environment like acid rains, reduced visibility, poisoning etc.. Governements around the globe have set regulations for the maximum amount of soot that can be released by the IC Engines or any combustion chamber for that regard. How do we reduce Soot formation?
- After-Treatment devices like strainers, trappers etc.
- Treatment inside the chamber.
Soot trapping is not a very effecient way, because soot is still formed but is not freely released. Instead it gets settled up and then is supposed to be discarded safely.
Instead treatments inside the combustion chamber are better at reducing soot formation int he first place. This can be done by altering the fuel mixture. One simple way is adding water into fuel. Intrestingly, water injection is used as an after burning techinque in Gas-Turbine Engines.
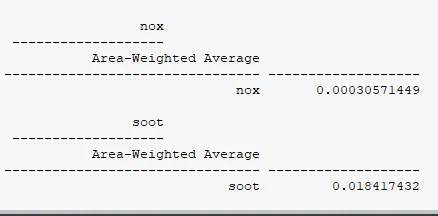
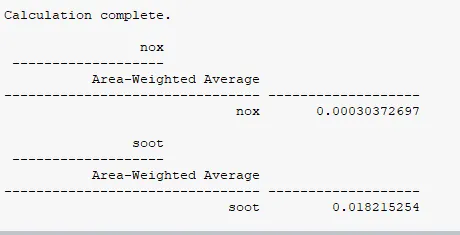
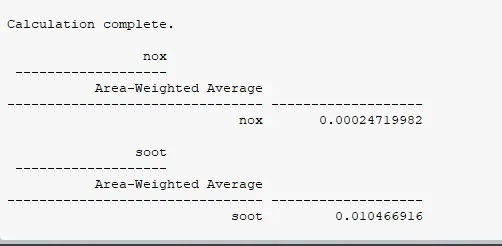
CH4 with various concentrations of water
- 5%
- 10%
- 15%
- 20%
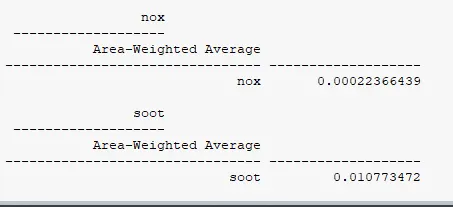
- 25%
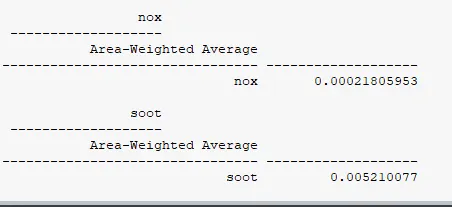
- Cumulative Data

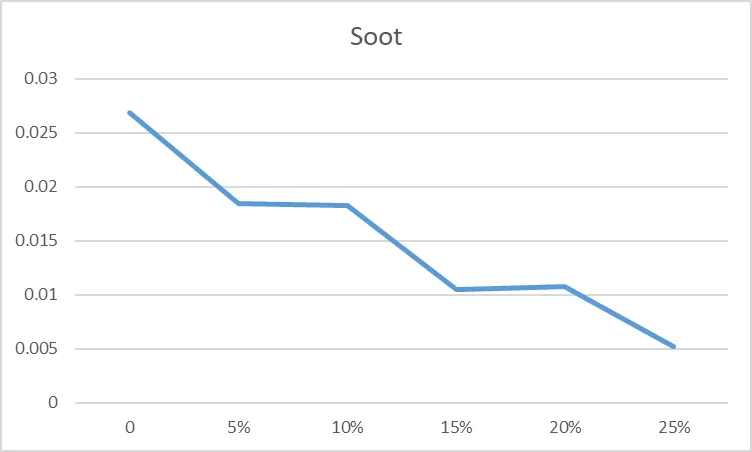
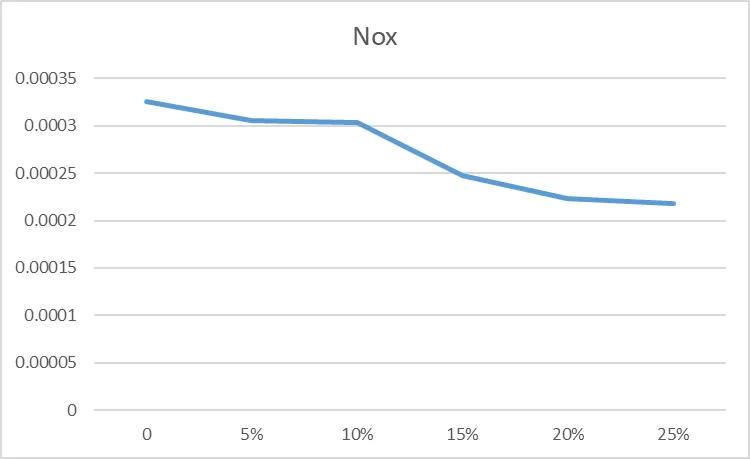
From the above graphs, it is evident that on addition of water to Methane, the soot and Nox concentration decreases. Further, it can also be seen that as the water content increases, the soot and Nox conent reduces.
Conclusion
- Closer to the inlet, the oxygen concentration is pretty low near the axis. This is understandable because there is a fuel inlet at that spot. But, as we move away from the inlet, it is noticeable that the oxygen concentration is considerably dropped. This is because it has been burned away.
- CH4 concentration is very high close to the axis and inlet. This is obviously because of the fuel inlet. As we move downstream Methane gets combusted very rapidly and its concentration becomes almost zero.
- The H2o concentration is high near the axis until first half of the combustion chamber. As we move downstream, the H2o concentration becomes uniform along the radial direction.
- High temeprature and incomplete combustion can cause formation of soot and Nox pollutants, which are harmful for the environment.
- The concentration of these substances can be reduced by injecting water in the fuel. This is becuase, water molecules are disassociated into hydrogen and oxyegen atoms. This increases the availability of oxygen, thus favouring complete combustion. Also, water can act as a coolant.
- As the water content is raised, the pollutant and soot concetration reduces.