Week 10 - Simulating Combustion of Natural Gas.
Simulation combustion of Natural Gas
Aim:
To perform a simulation on the combustion of Natural Gas.
Objective:
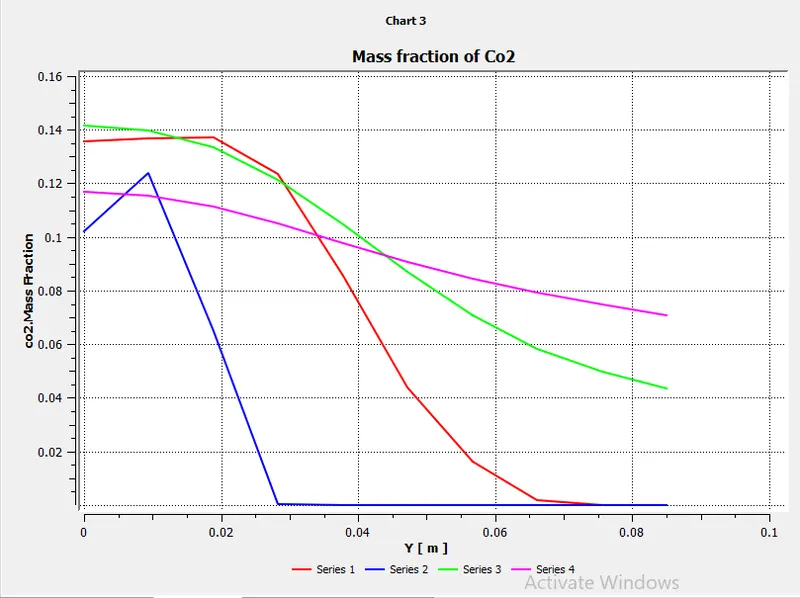
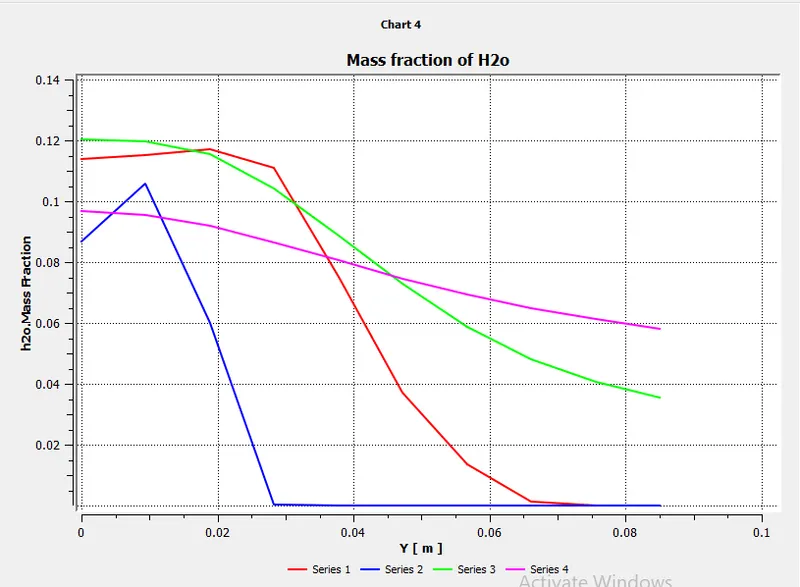
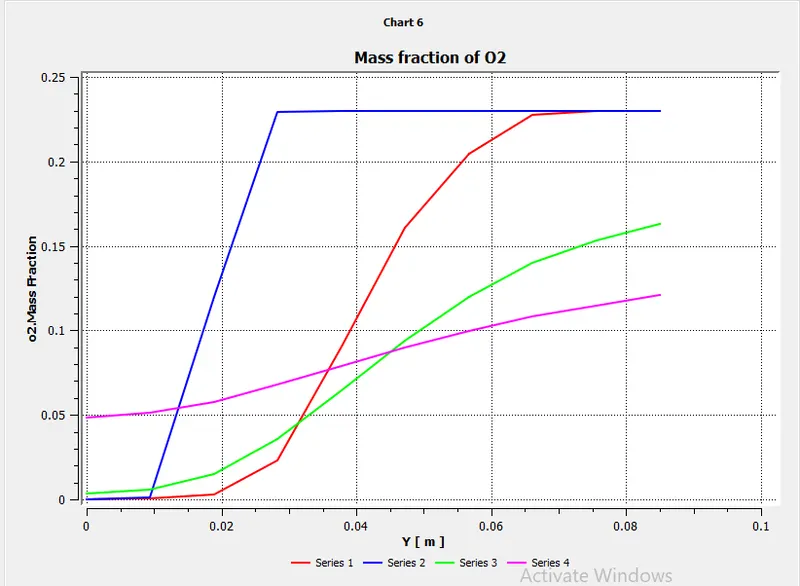
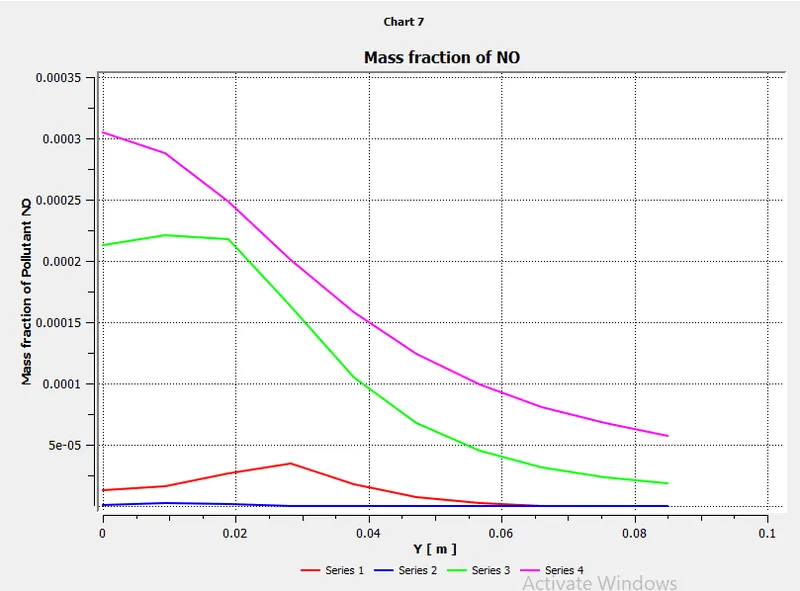
- Part-1: Perform a combustion simulation on the combustor model and plot the variation of the mass fraction of the different species in the simulation using line probes at different locations of the combustor.
- Part-2: Add the water content in the fuel from 5% to 30% by mole and observe its effect of it on the results.
Introduction:
In this simulation, we are using non premix combustion model.
Non Pre-mix combustion model
In non-premixed combustion, fuel and oxidizer enter the reaction zone in distinct streams. This is in contrast to premixed systems, where reactants are mixed at the molecular level before burning. Examples of non-premixed combustion include pulverized coal furnaces, diesel internal combustion engines, and pool fires.
Approach and solving:
- In part-1, we will perform a simulation by adding methane and air for combustion and will plot the variation of the mass fraction of the different species using line probes at different locations of the combustor.
- In part-2, we need to check the effect of water addition to natural gas, on the mass fraction of NOx and soot formation due to combustion. For that purpose we will be performing parametric study by adding water content from 5% to 30% in boundary conditions.
PROCEDURE:
- Geometry
- Mesh
- Setup
- Solution
- Results
Pre-Processing:
Geometry:
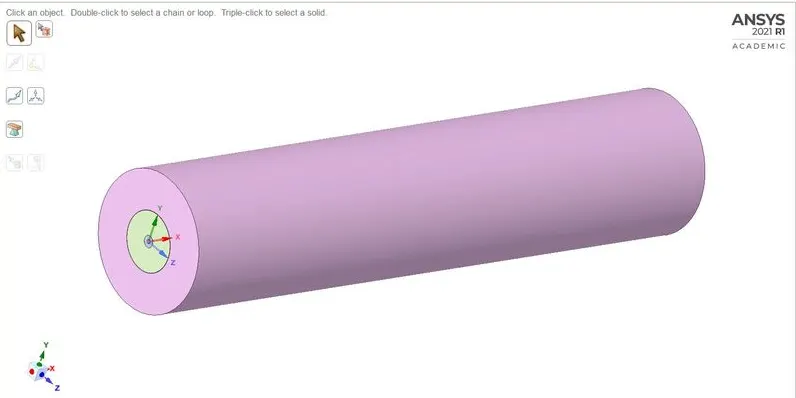
Import geometry to Spaceclaim
.
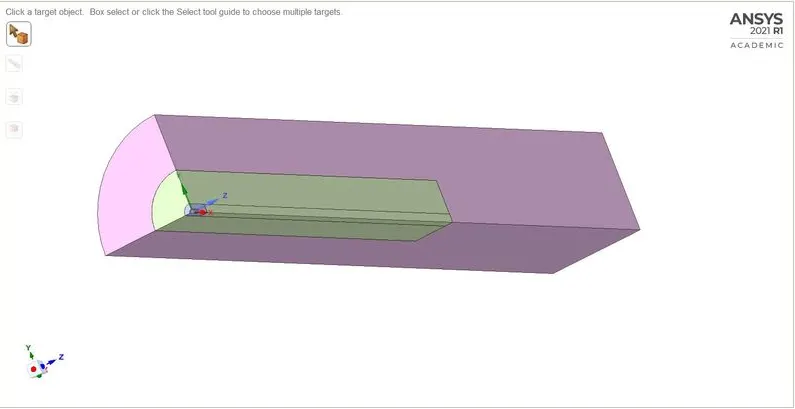
By using split body command, the body was cut into the quarter cylinder
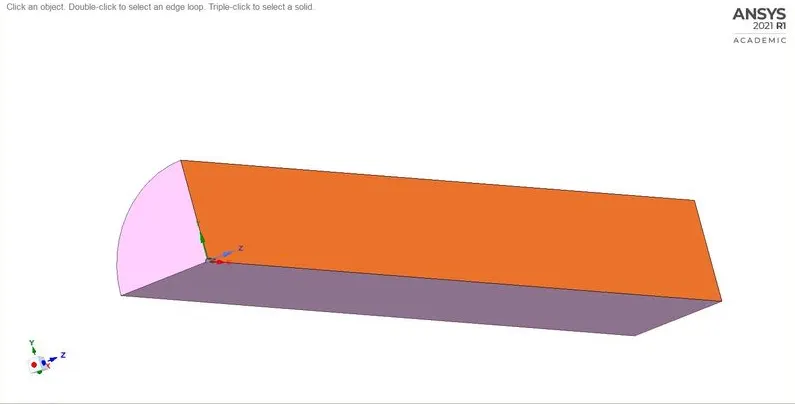
Copy the face and create a new sketch
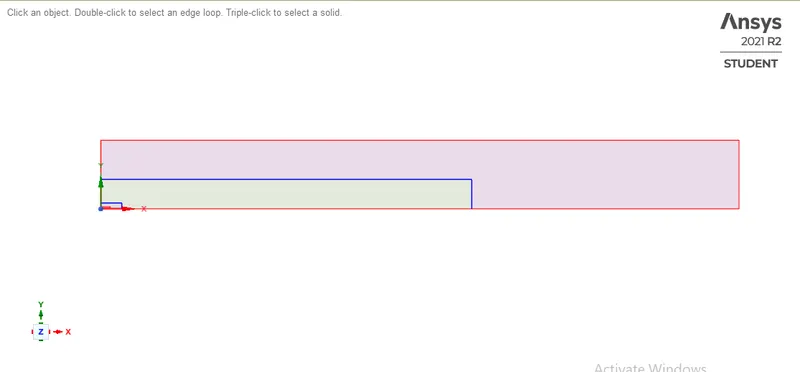
2-D geometry ready for meshing
Mesh:
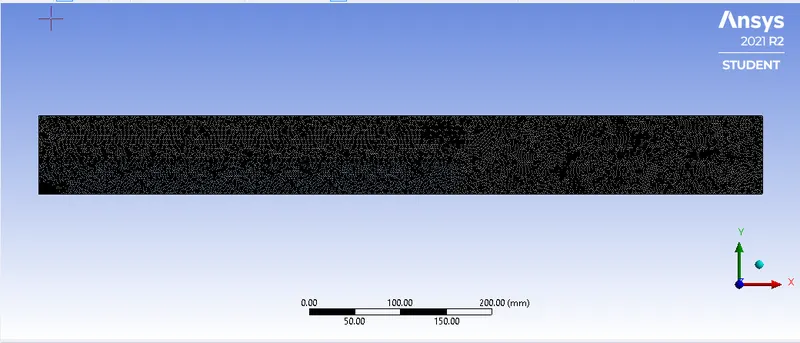
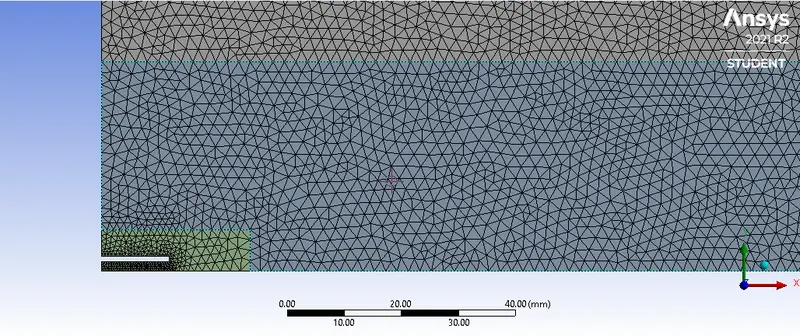
- Meshing the 2D surface by using the triangular mesh method by keeping the element size to 2mm.
- The Capture proximity was unable by keeping minimum 5 element nodes
Fluent Setup:
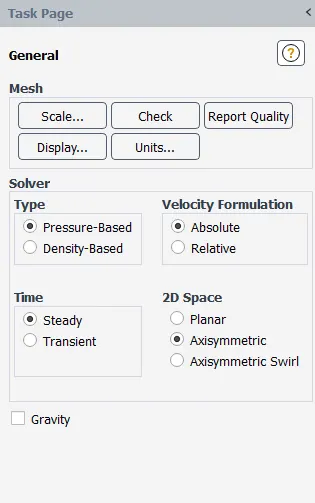
General:
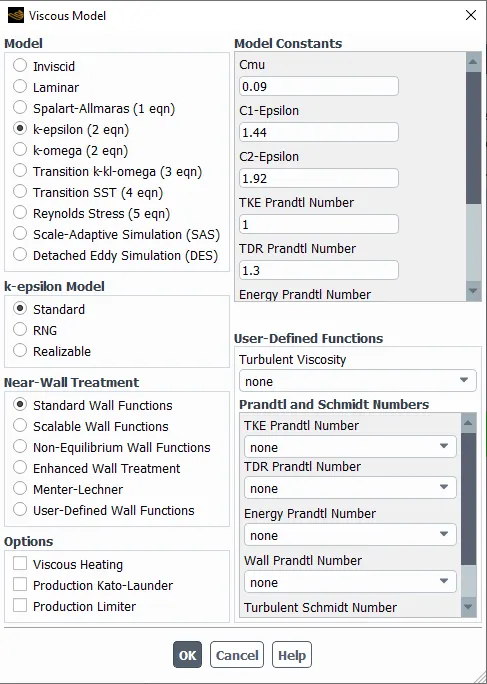
Model:
Material:
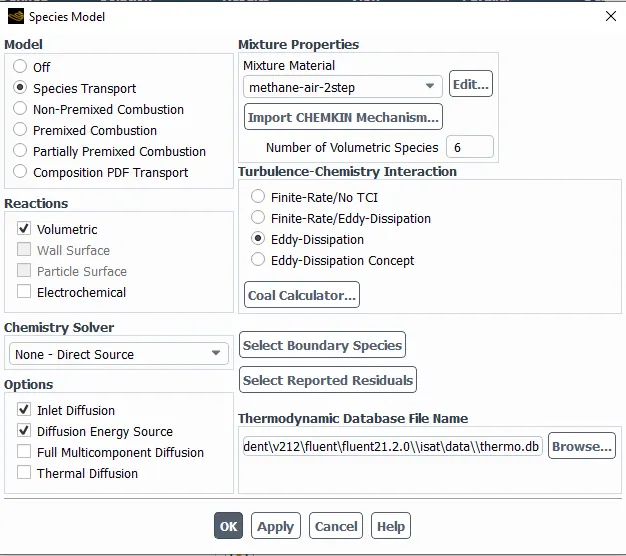
Species model:
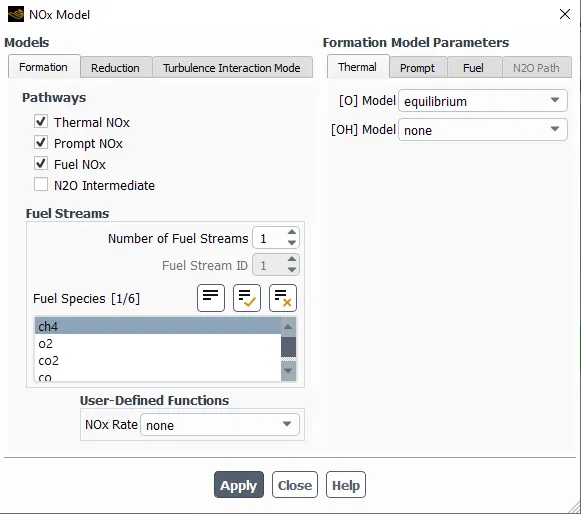
NOx model:
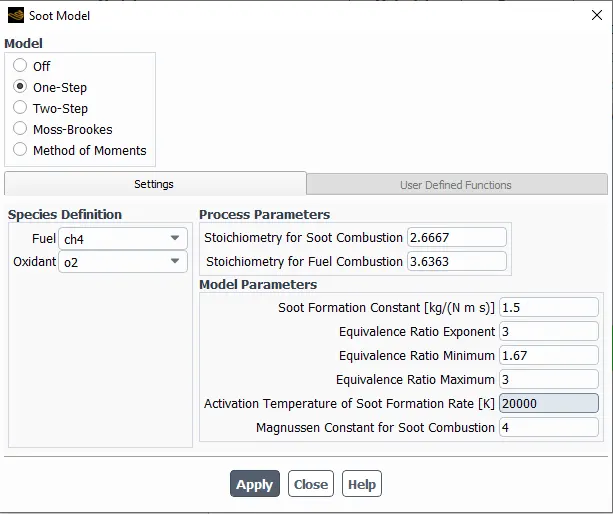
Soot model:
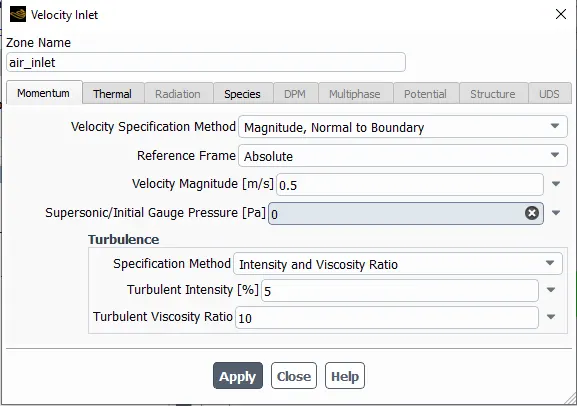
Boundary condition:
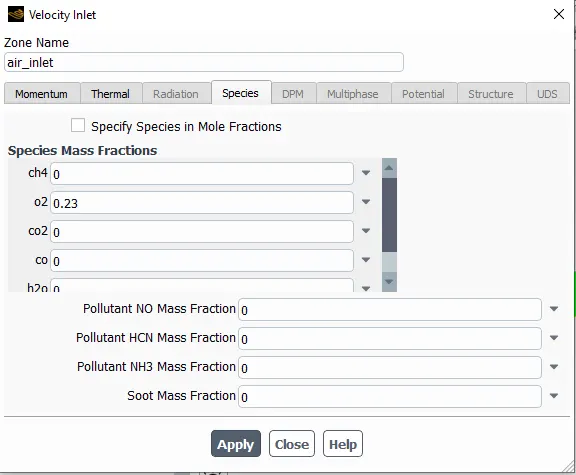
- Air inlet
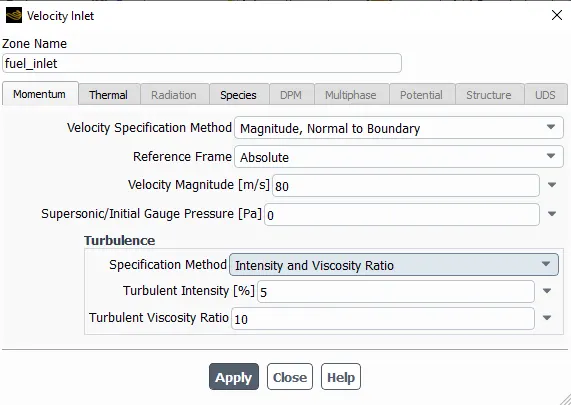
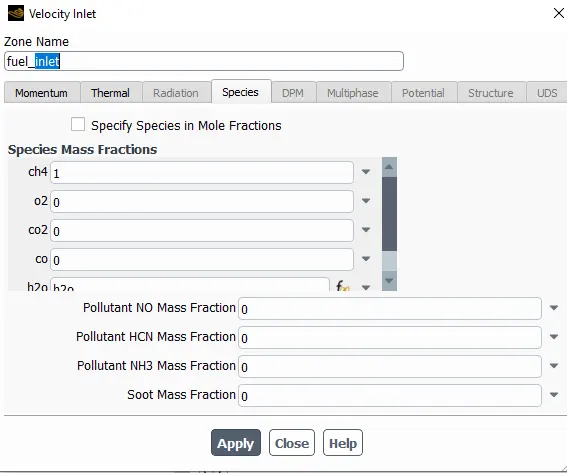
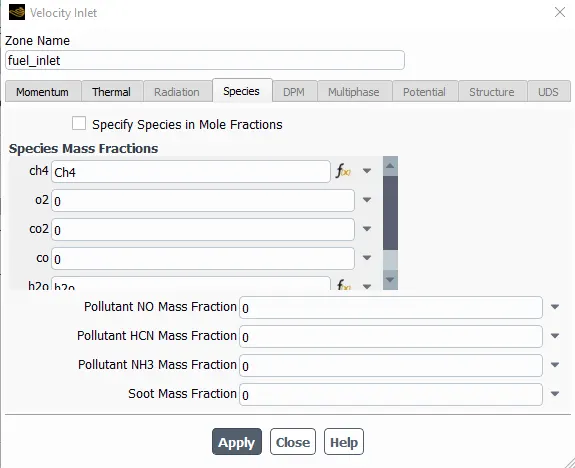
- Fuel inlet
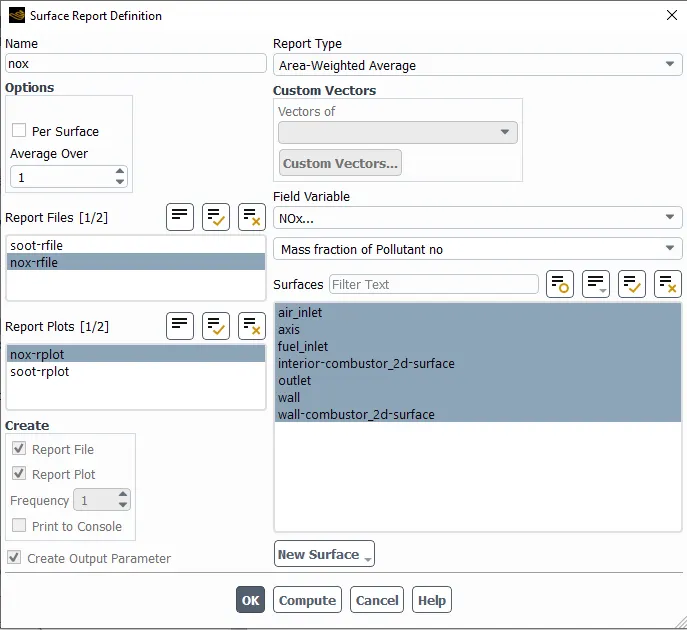
Definitions:
Initialization: Hybrid initialization
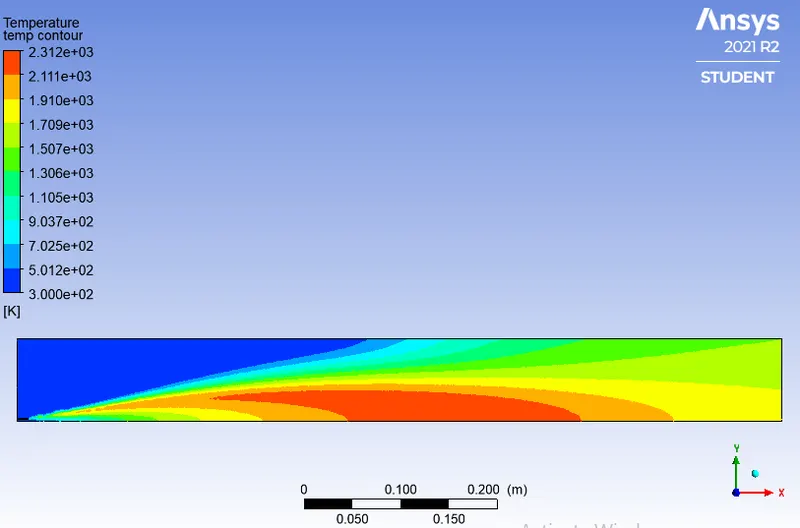
Results: temperature contour
Run-calculation: 500-iterations
Results
Part-1
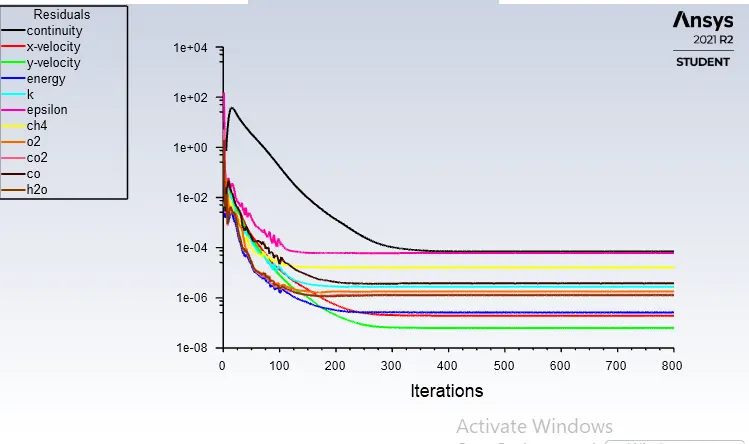
Residual plot
Temperature plot
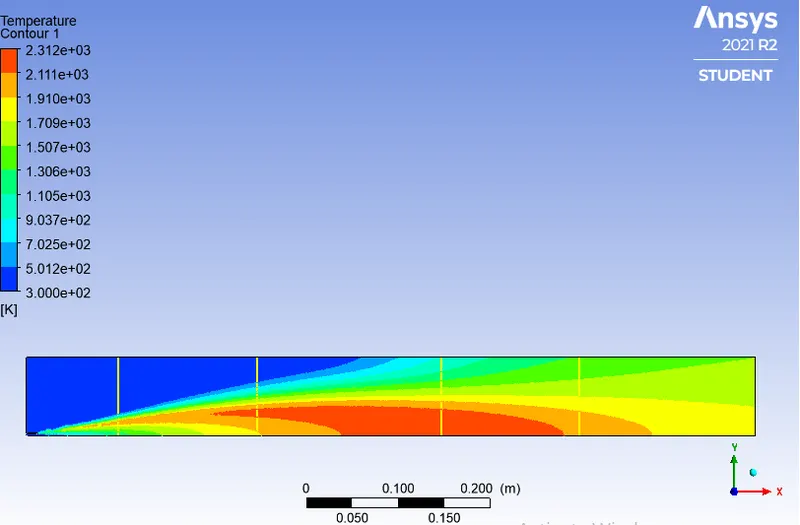
Line plot
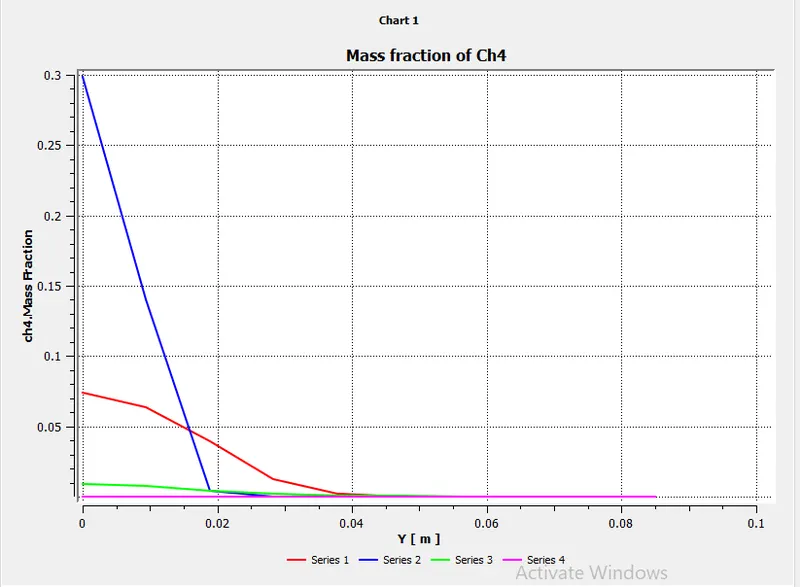
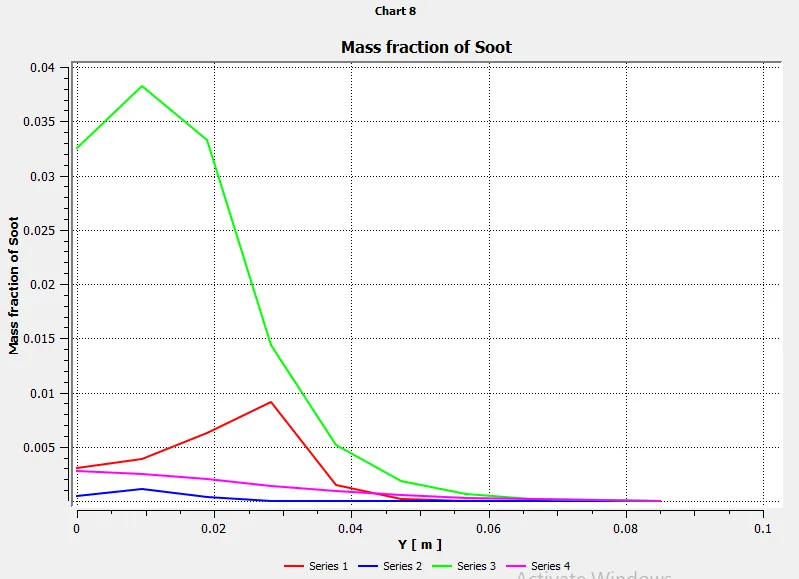
Graphs
Part-2
Fluent setup:
For parametric study, setup is same except for fuel inlet velocity
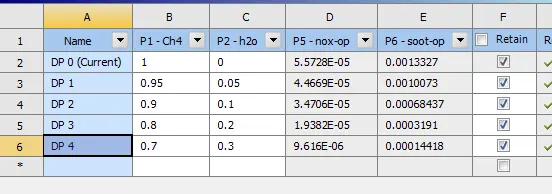
Parameter table
|
Case |
Percentage of H20 |
NOx pollutant |
Soot |
|
1 |
5 |
4.4669E-05 |
0.0010073 |
|
2 |
10 |
3.4706E-05 |
0.00068437 |
|
3 |
20 |
1.9382E-05 |
0.0003191 |
|
4 |
30 |
9.616E-06 |
0.00014418 |
Case1
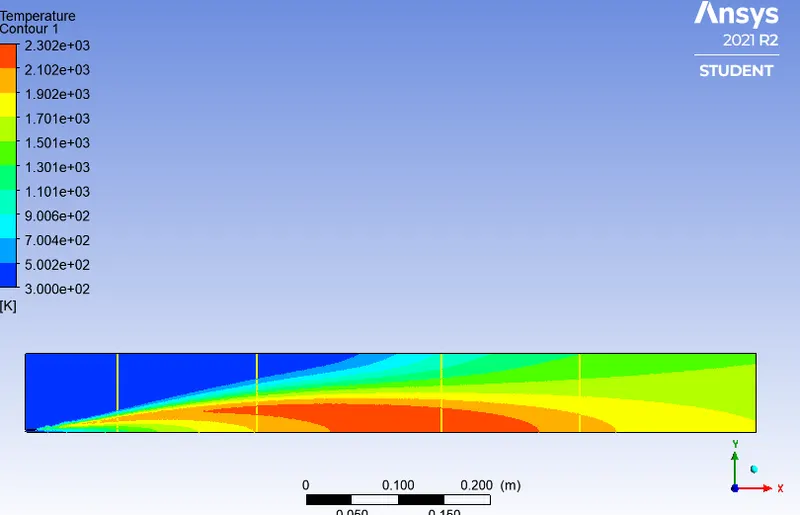
Temperature contour
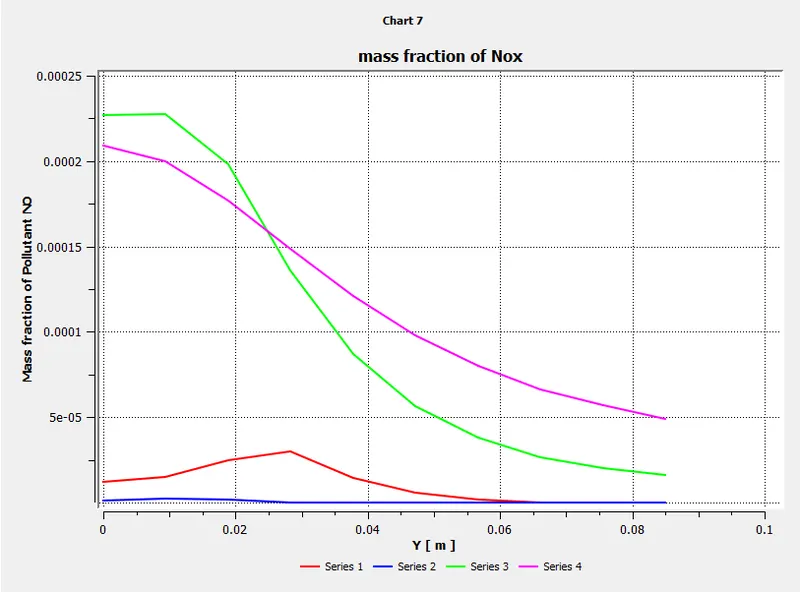
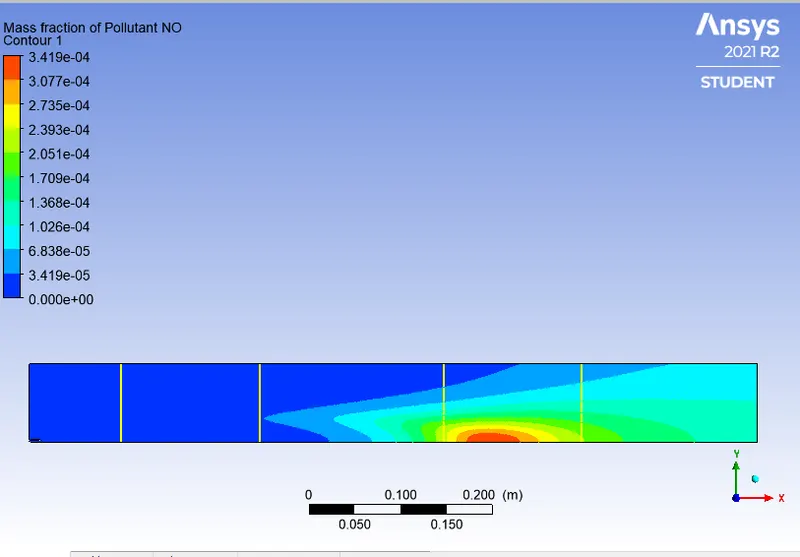
Mass fraction of Nox
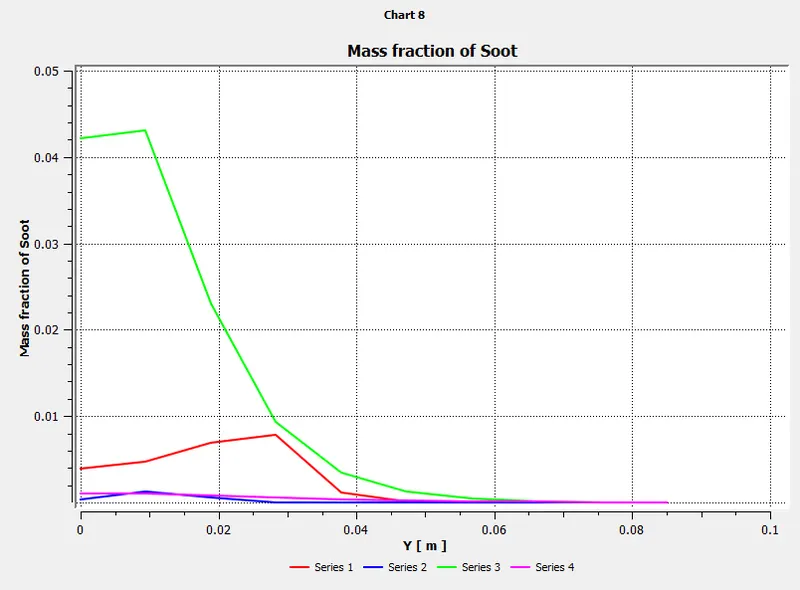
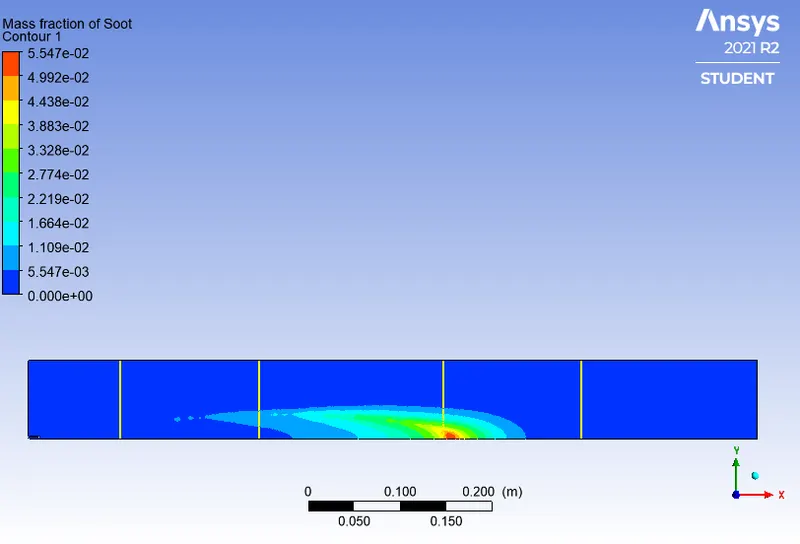
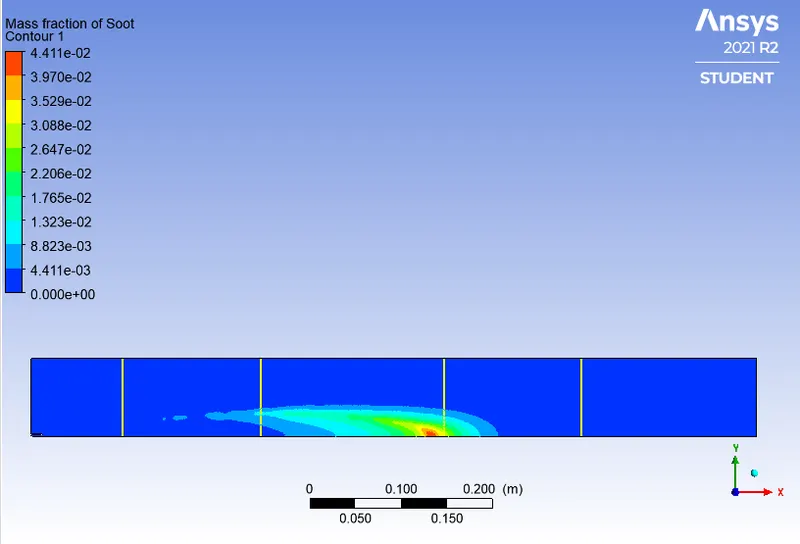
Mass fraction of Soot
Case2
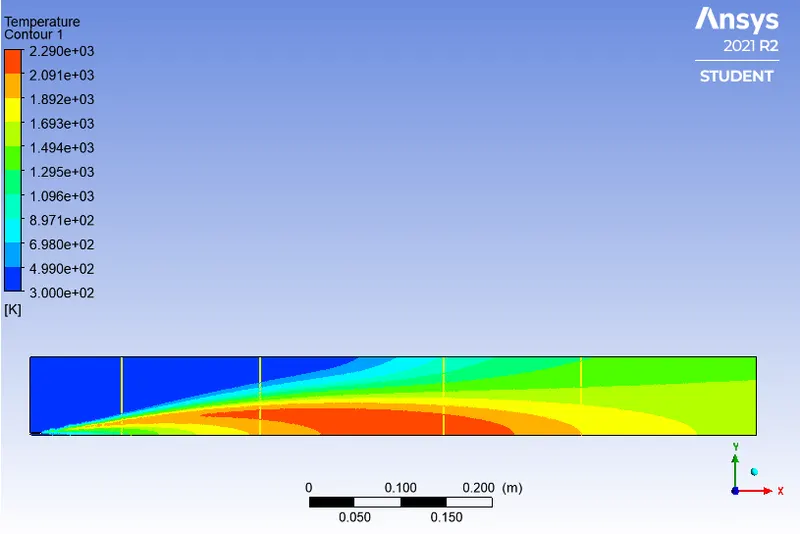
Temperature contour
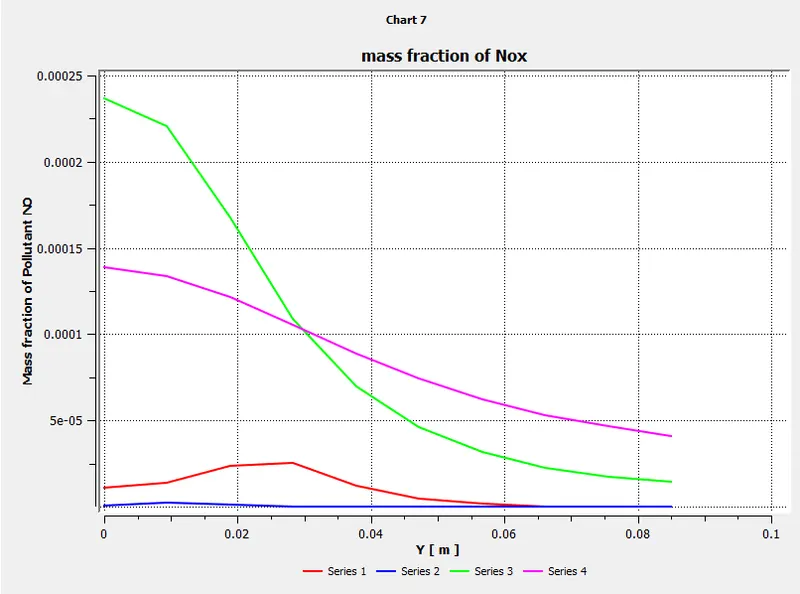
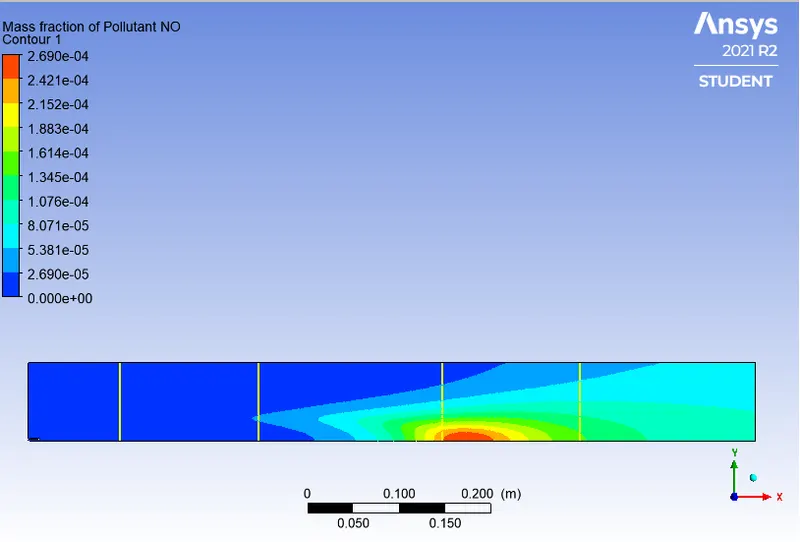
Mass fraction of Nox
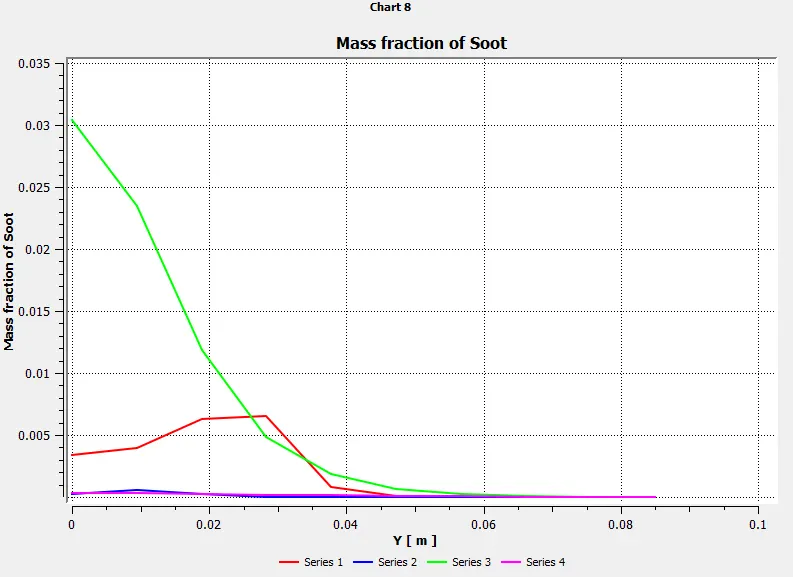
Mass fraction of Soot
Case3
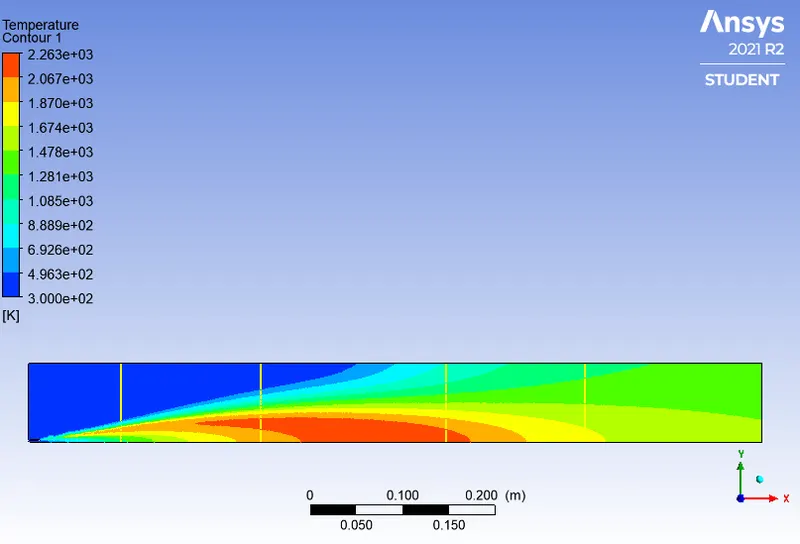
Temperature contour
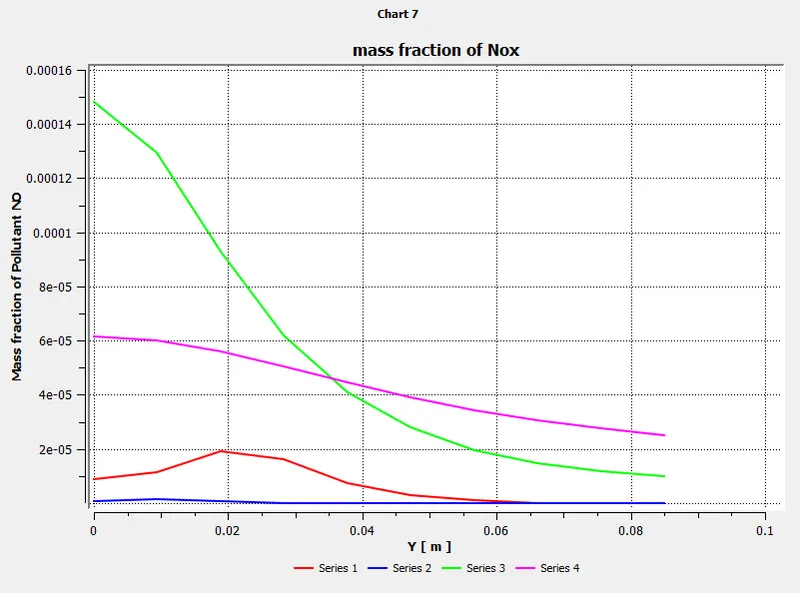
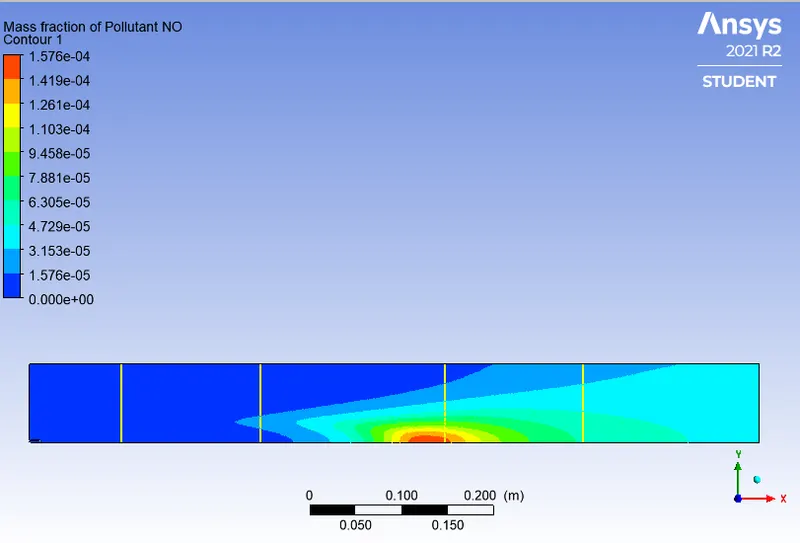
Mass fraction of Nox
Mass fraction of Soot
Case4
Temperature contour
Mass fraction of Nox
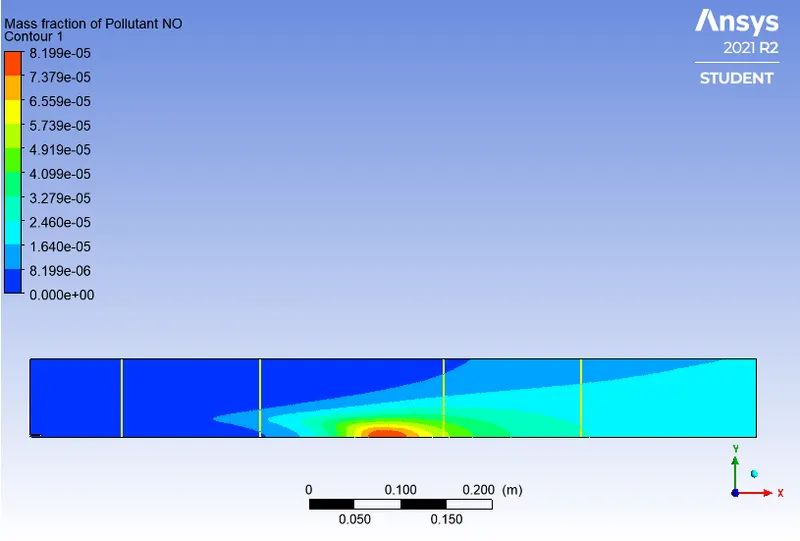
Mass fraction of Soot
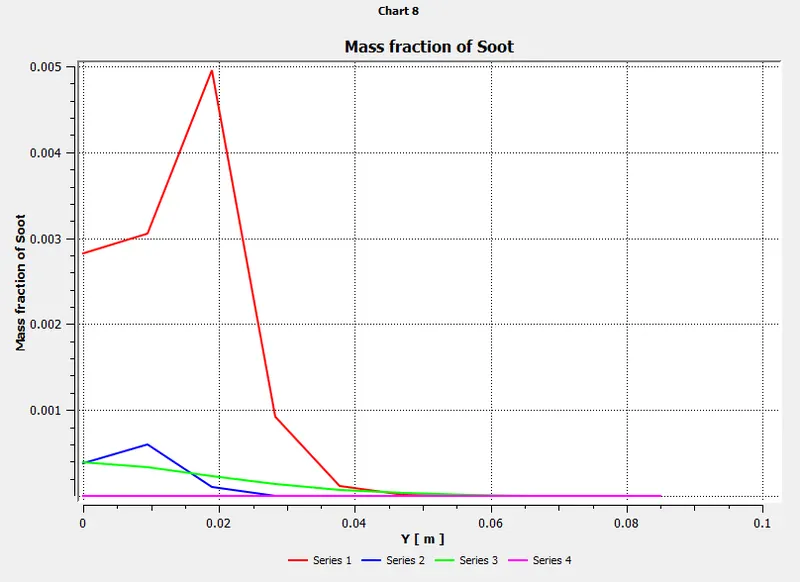
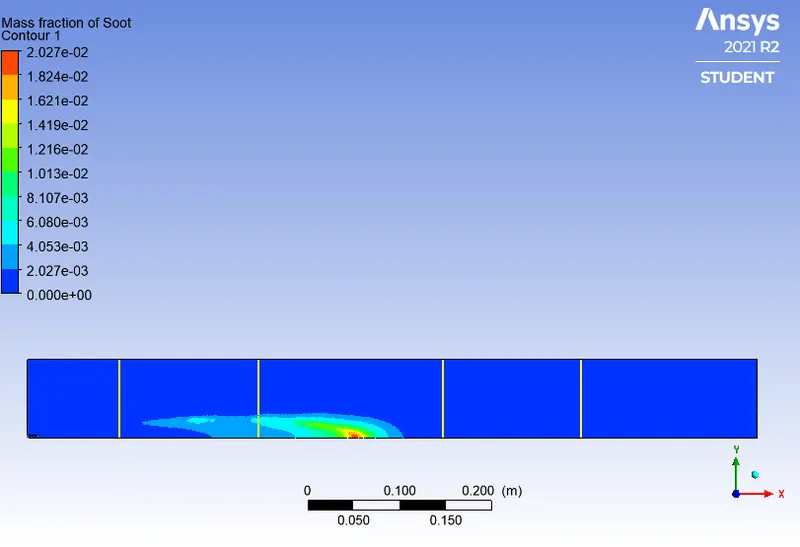
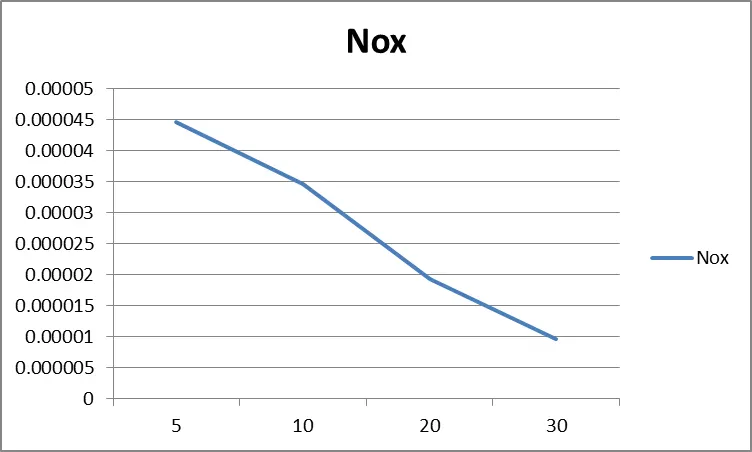
Table containing output values for all the cases:
|
Case |
Percentage of H20 |
NOx pollutant |
Soot |
|
1 |
5 |
4.4669E-05 |
0.0010073 |
|
2 |
10 |
3.4706E-05 |
0.00068437 |
|
3 |
20 |
1.9382E-05 |
0.0003191 |
|
4 |
30 |
9.616E-06 |
0.00014418 |
Graphs:
Conclusion:
Part-1
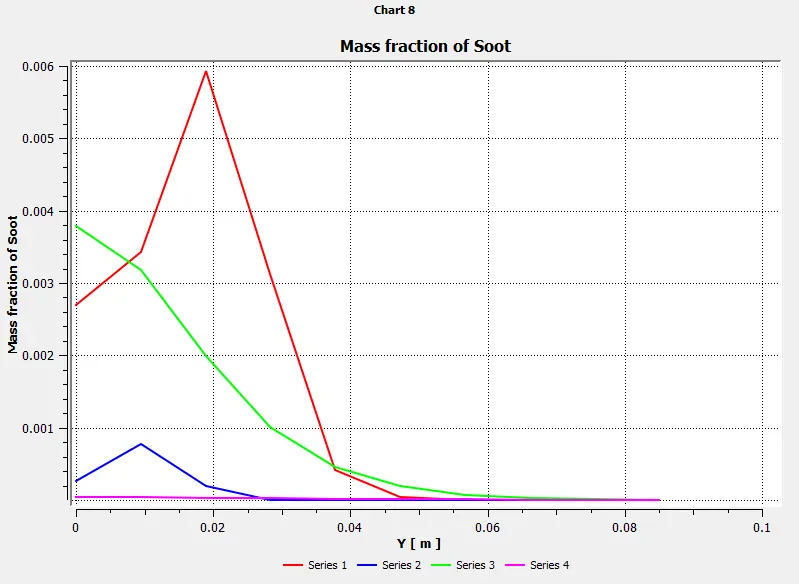
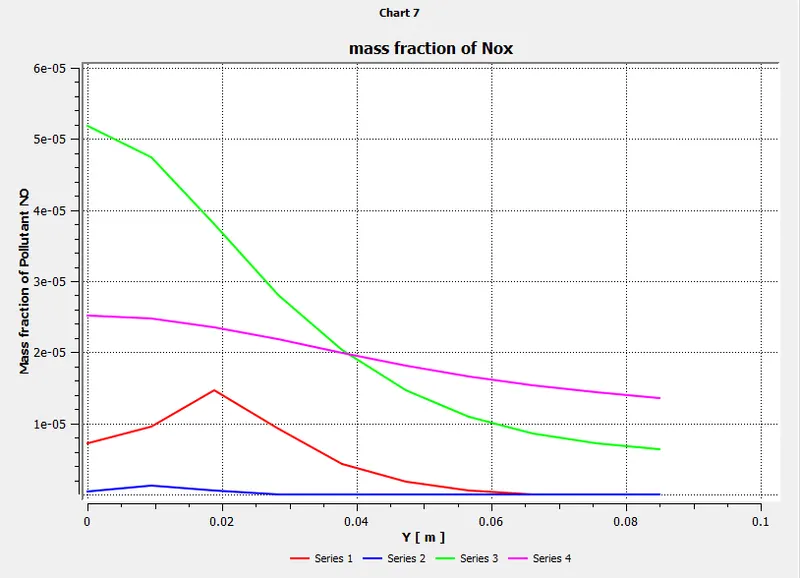
The graphs between a mass fraction of species at different lengths of the combustor are plotted. From the plots, it is observed that the mass fraction of Co2, Ch4, and soot formation was maximum at the center of the combustor. whereas the mass fraction of O2 and Nox was observed maximum at the 3/4th length of the combustor.
Part-2
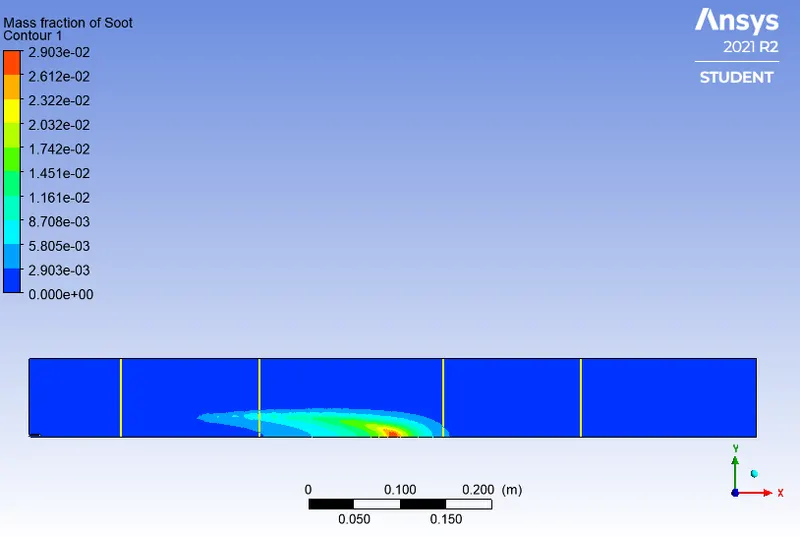
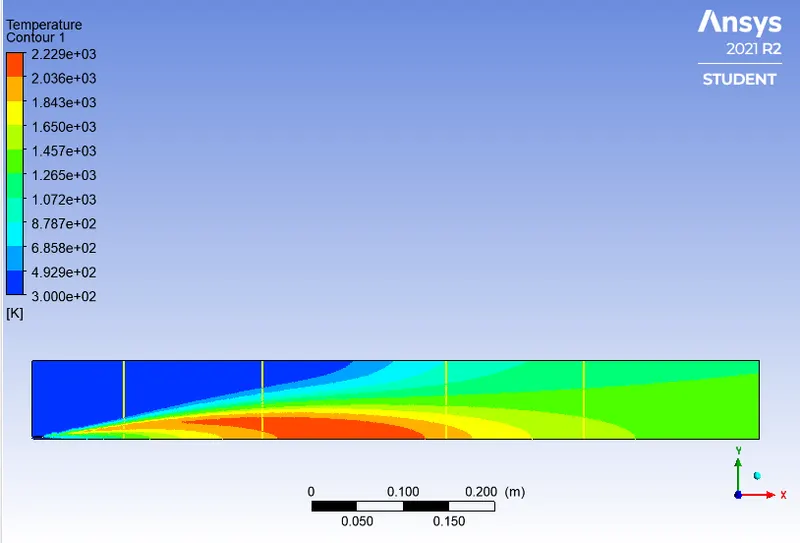
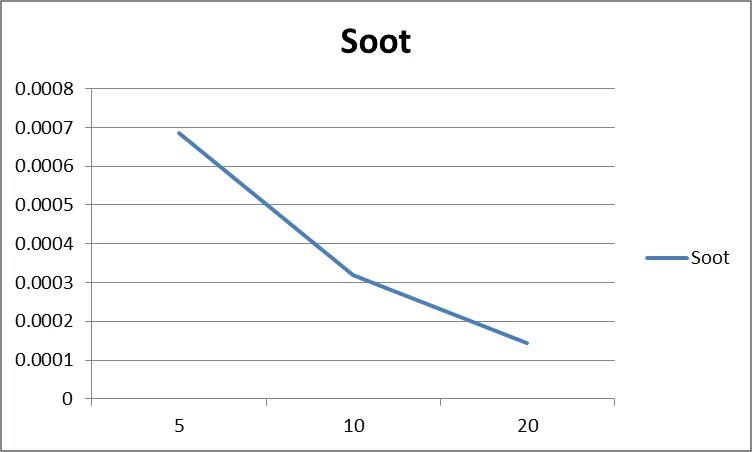
From the plot, it can be concluded that the pollutant Nox and soot formation are reduced with an increase in the percentage of water addition. Also, we see that with water addition the maximum temperature in the combustion is decreased, this delays the combustion which in turn increases the efficiency of mixing. Soot is a mass of impure carbon particles resulting from the incomplete combustion of hydrocarbons. Complete combustion takes place as a result of the efficient mixing of fuel and hence no oxygen and fuel are present after combustion to produce soot.