Structural analysis of Spur gear using different materials in ANSYS Workbench
Aim: To simulate two Spur gears using three different materials namely Cast Iron, Cast Steel and Cast Bronze using ANSYS and discuss the different results obtained from the three cases.
PROCEDURE:
The .step file containing the geometry of the two gears was imported into ANSYS and is shown below:

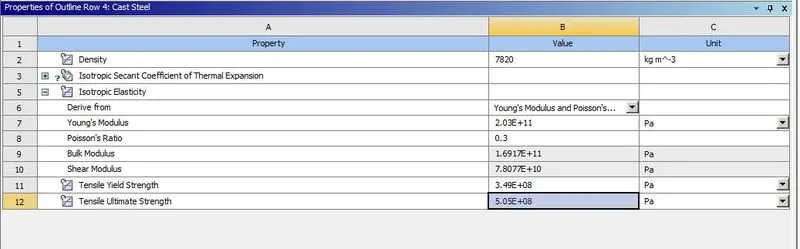
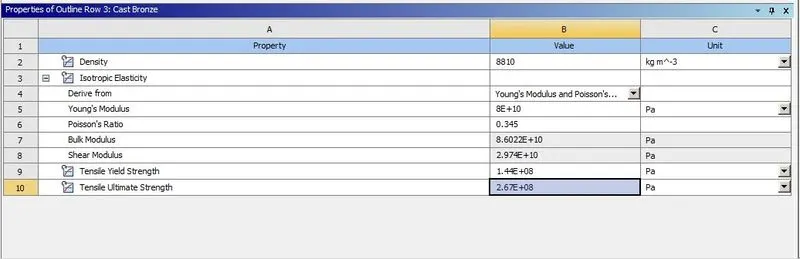
Material named "Cast Iron" was imported into the simulation and two additional materials namely "Cast Steel" and "Cast Bronze" were custom prepared with the following properties:
Cast Steel:
Cast Bronze:
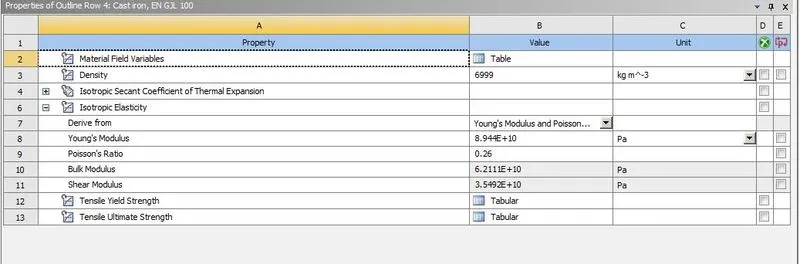
The imported Cast Iron properties are shown below:
The two gears were given revolute joint boundary condition at their respective centers. The left gear was given a rotational degree of freedom as shown below:
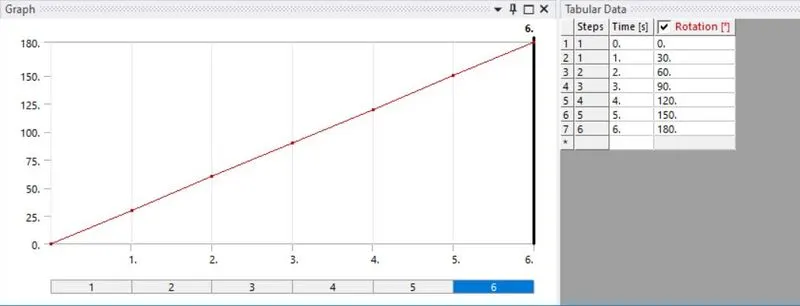
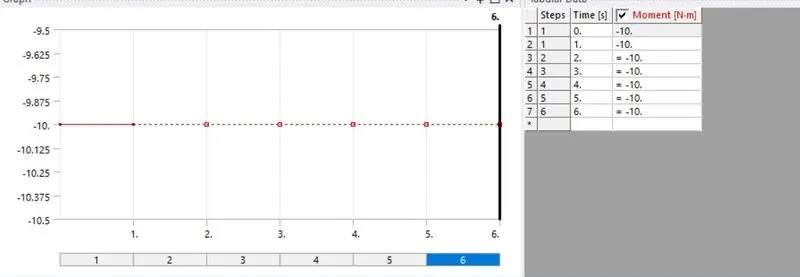
A total of 180 degree rotation was given. The right gear was given moment of 10 N-m as shown below:
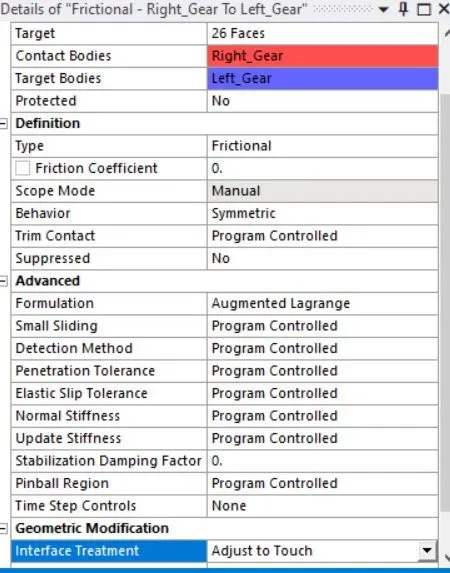
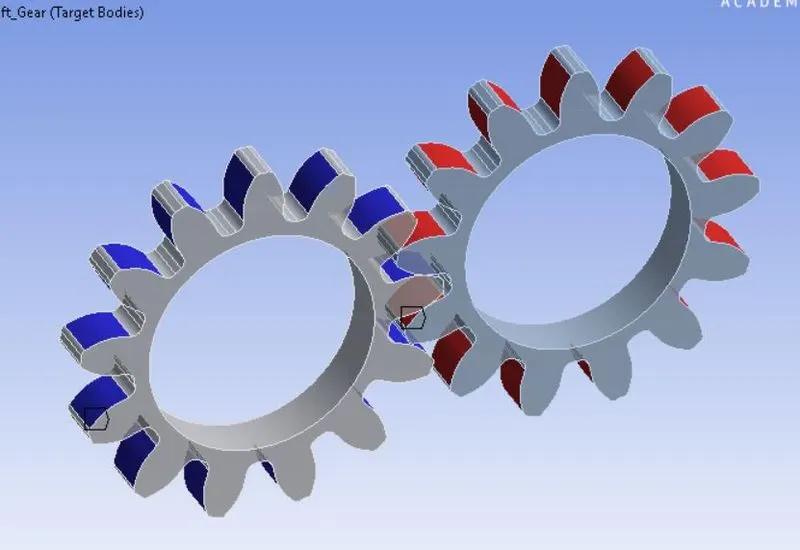
Frictional contact was provided between the two gears with contact properties as shown below:
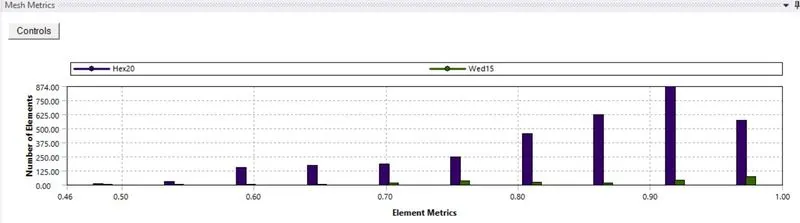
The mesh of the gears with size of 0.8 mm is shown below:
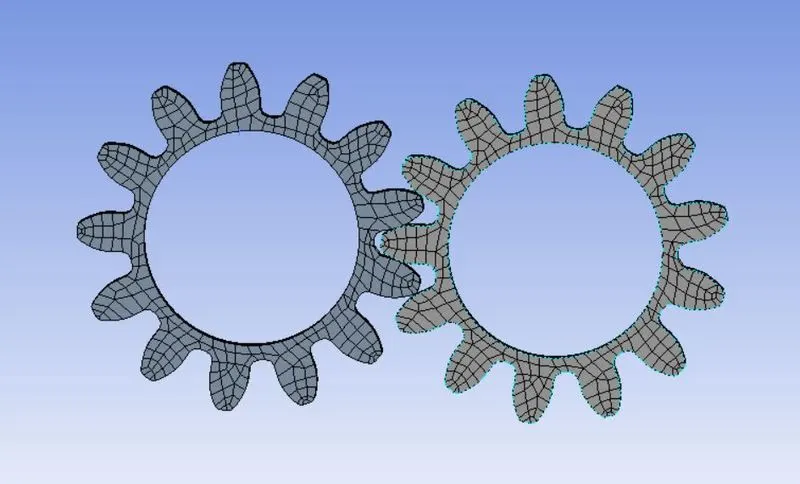
The mesh size variation is shown below:
CASE A - CAST IRON:
Cast iron was assigned to the two gears and the simulation was solved. The simulation is shown below:
The Von-Mises stress contour is shown below:
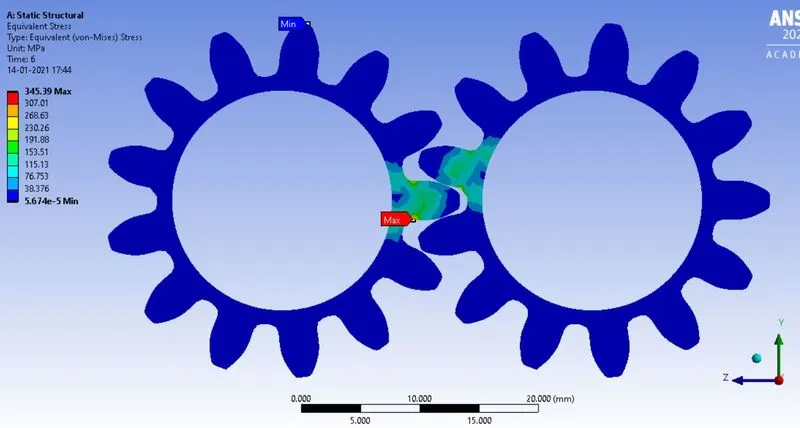
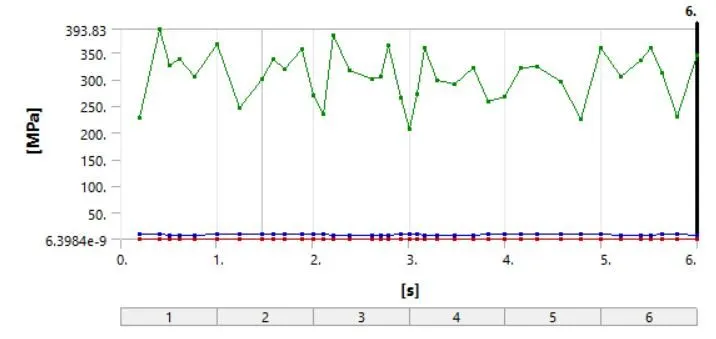
Maximum Von-Mises stress of 393.73 MPa is observed and the graph is shown below:
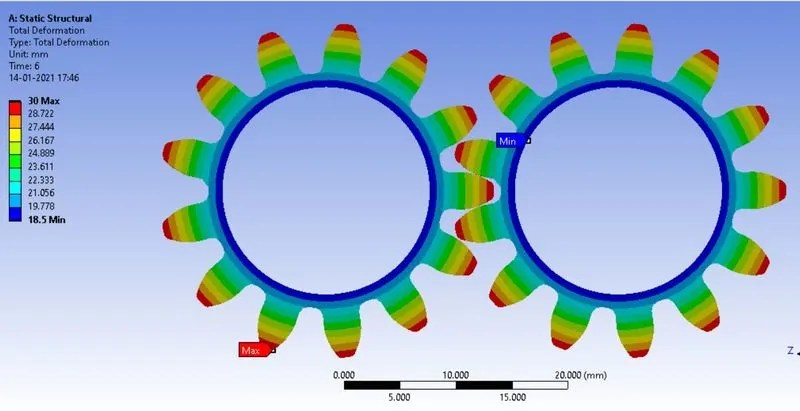
The deformation contour is shown below which shows peak of 30 mm deformation:
The Stress Intensity contour is shown below:
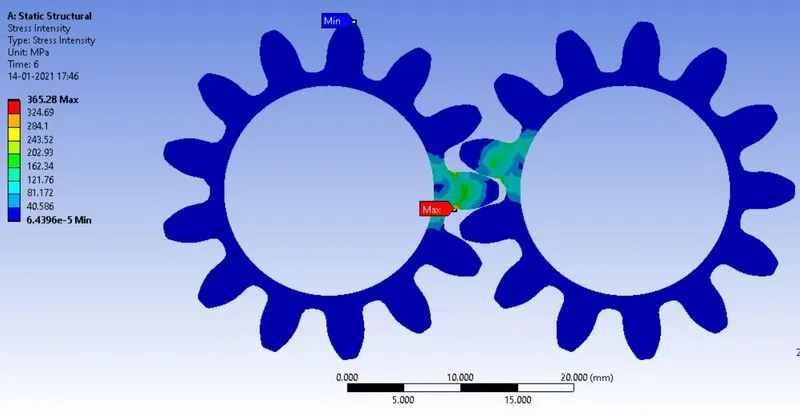
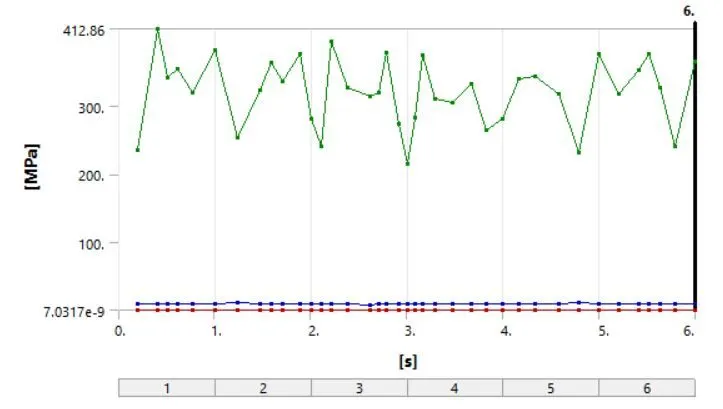
Maximum stress intensity of 412.86 MPa was observed. Stress intensity variation with time is plotted below:
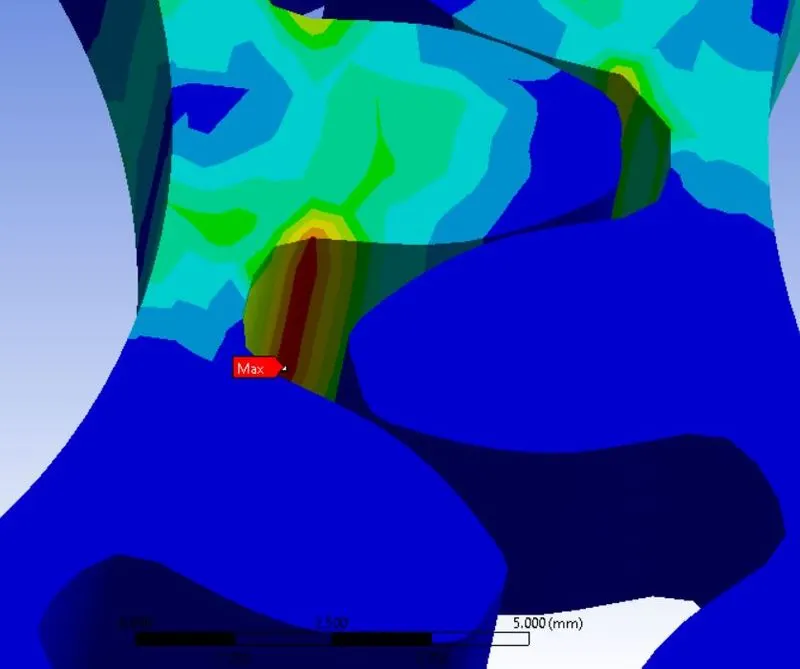
The region with maximum stress is the most likely region to get fractured and that region is shown below:
Case 2: Cast Steel:
The material assignment was changed to Cast steel and solved. The Von-Mises stress contour is shown below:
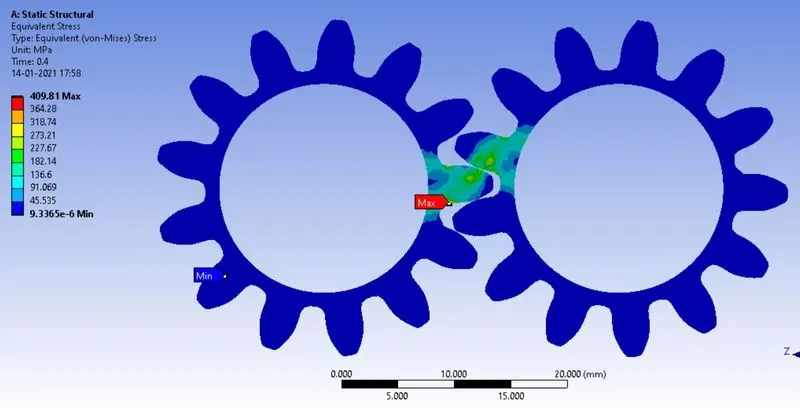
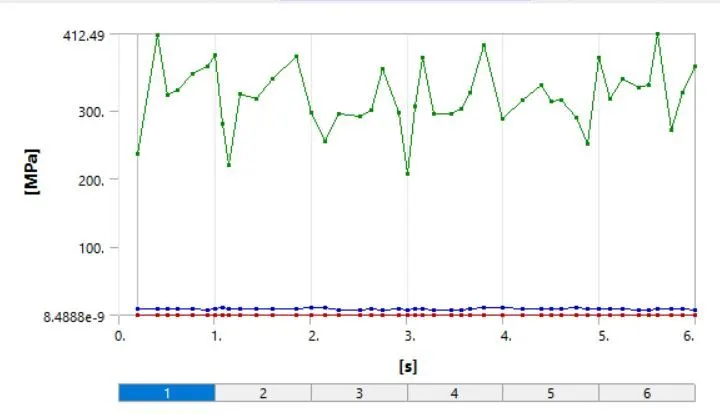
Maximum stress of 412.49 MPa was observed and the variation of stress with time is plotted below:
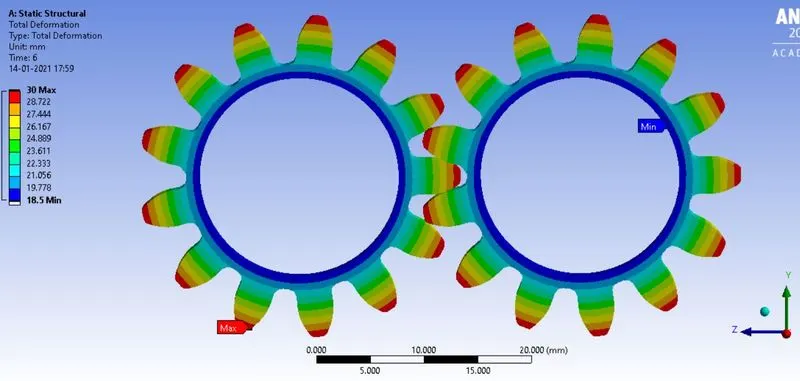
The deformation contour is shown below which reaches a maximum of 30 mm:
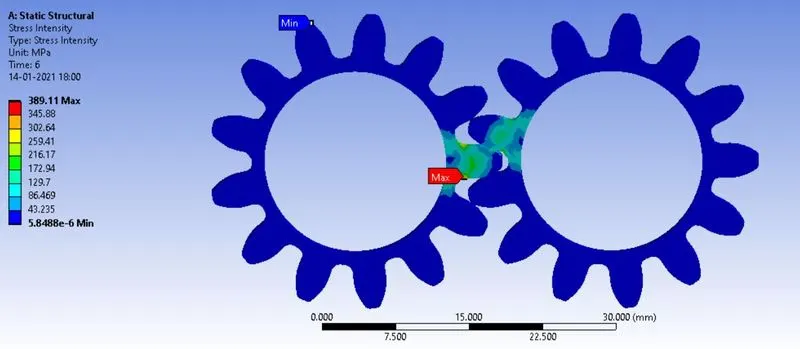
The Stress Intensity contour is shown below:
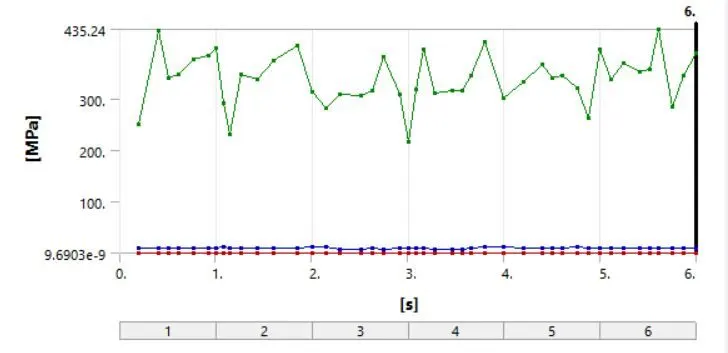
Maximum stress intensity of 435.24 MPa was observed and the variation with time is plotted below:
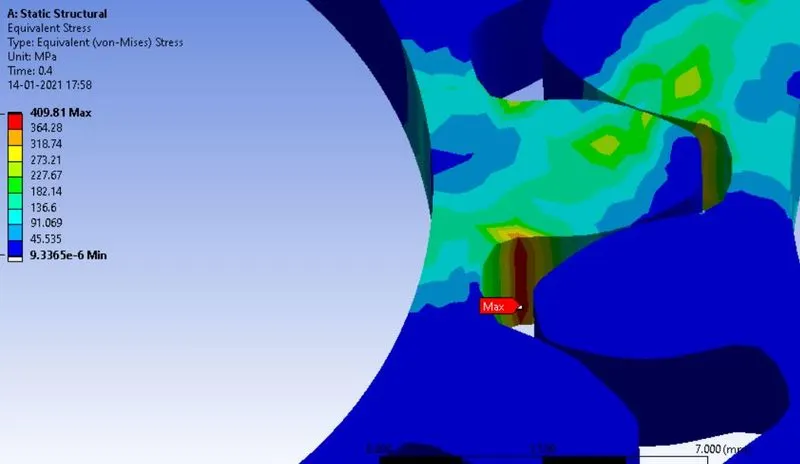
The region with maximum stress is shown below:
CASE 3: Cast Bronze:
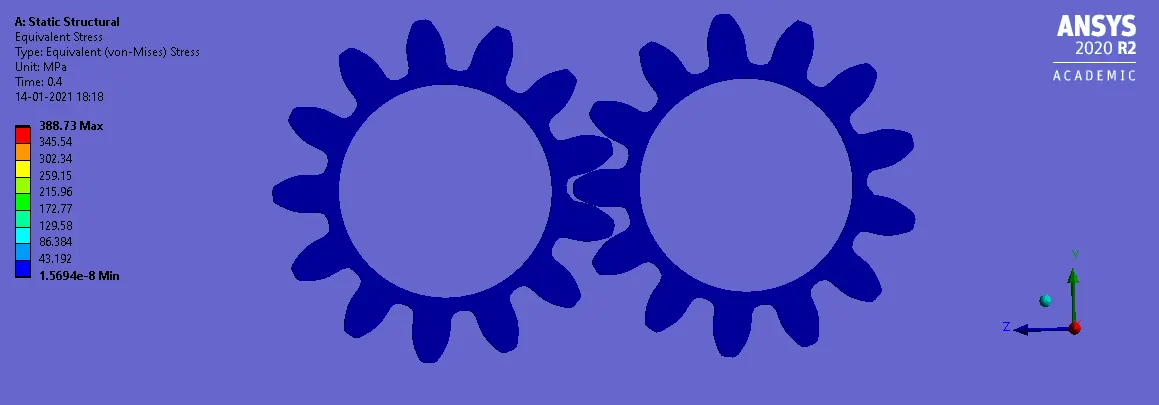
The material assignment was changed to cast Bronze and solved. The Von-Mises stress contour is shown below:
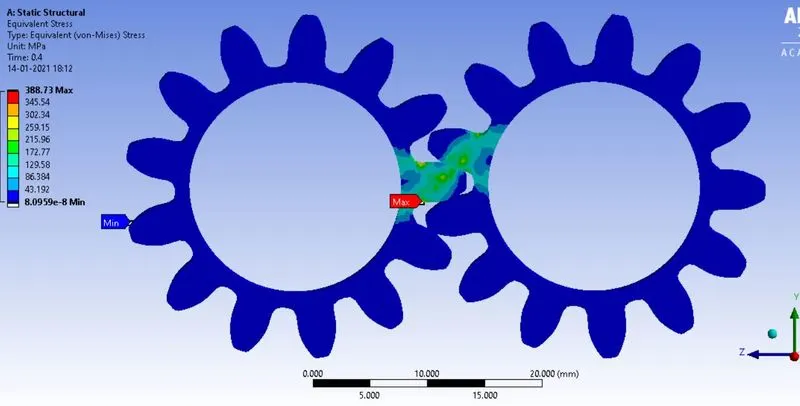
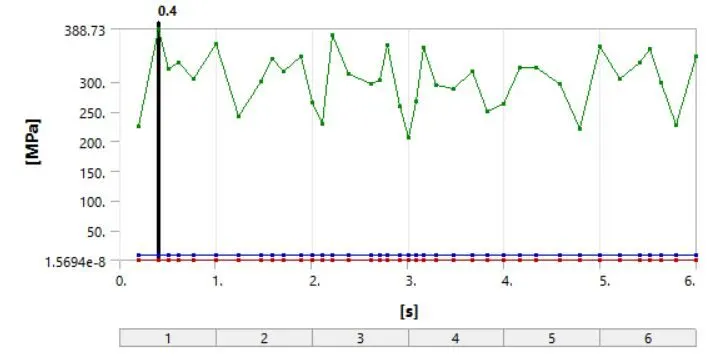
A maximum stress of 388.73 MPa was observed. The stress variation with time is plotted below:
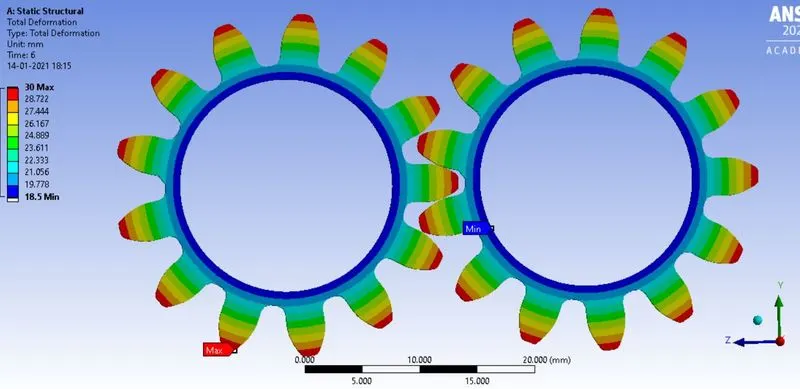
The deformation contour is shown below with maximum of 30mm :
The stress intensity contour is shown below:
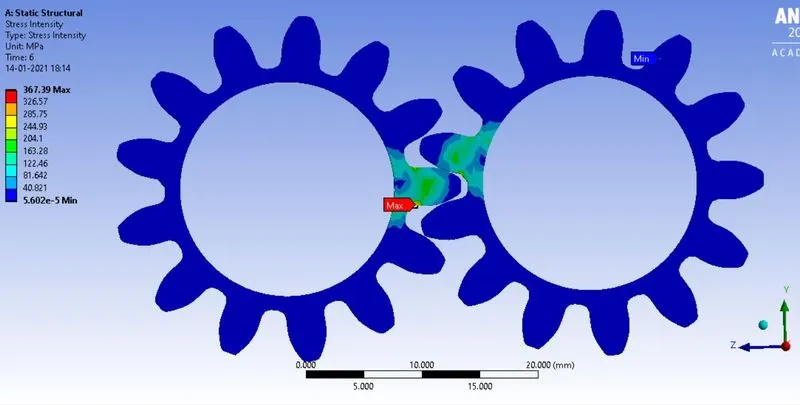
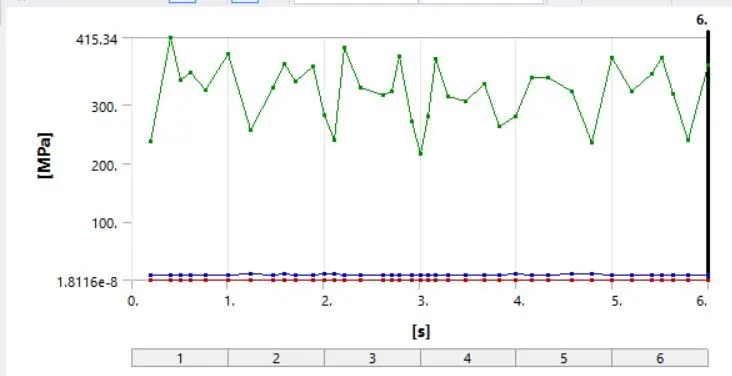
Maximum stress intensity of 415.34 MPa was observed. The variation of stress intensity with time is shown below:
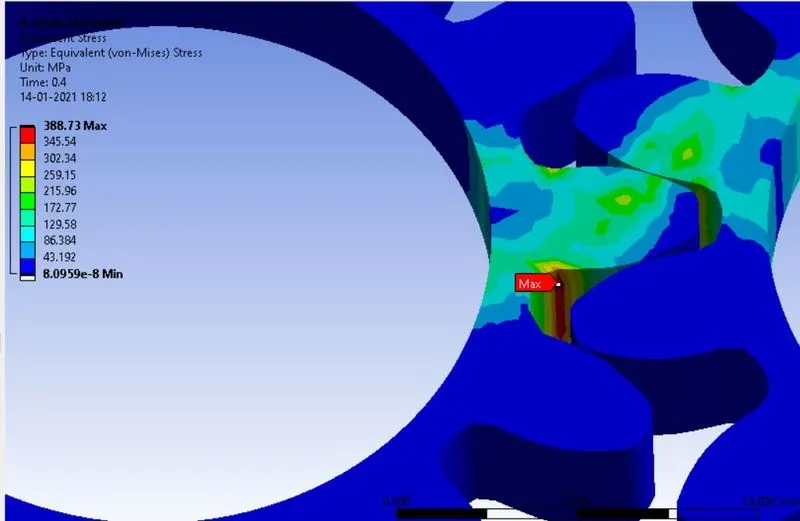
The region with maximum stress is shown below:
Comparison of the three cases can be summarized by the table below:
|
Material |
Max Stress (MPa) |
Max Deformation (mm) |
Max Stress Intensity (MPa) |
|
Cast Iron |
393.83 MPa |
30 mm |
412.86 MPa |
|
Cast Steel |
412.49 MPa |
30 mm |
435.24 MPa |
|
Cast Bronze |
388.73 MPa |
30 mm |
415.34 MPa |
|
Material |
Yield Stress |
Max Stress Intensity |
Difference |
|
Cast Iron |
79.8 MPa |
412.86 MPa |
333.06 MPa |
|
Cast Steel |
349 MPa |
435.24 MPa |
86.24 MPa |
|
Cast Bronze |
144 MPa |
415.34 MPa |
271.34 MPa |
The maximum stress intensities were compared to their respective Yield stresses. As can be seen from the above tables, Cast Steel has the most stress intensity. But it also has the highest Yield stress. Therefore the difference between Stress intensity and Yield stress is least for Cast Steel and hence it is the best material for use in the structure.
CONCLUSION: The structural analysis of spur gears was successfully completed using three different materials. The results were tabulated and compared quantitatively.