Week 1- Mixing Tee
AIM:
Simulation of Mixing Tee in Ansys fluent.
Theory:
In HVAC (Heating, Ventilating, Air Conditioning) unit used in an automobile air-conditioning system, hot air heated by a heater core and cold air cooled by an evaporator is mixed to control the air temperature blown into the compartment. In simulating numerically the temperature control characteristics of the HVAC, the modeling of turbulent mixing process of hot and cold air is a key issue for improving the performance of the simulation.here the hot air and cold air are mixed in a tee joint. in tee joint, there are two inlets for entering of hot air and cold eair and there is one outlet through which themixture gets out .
objectives:
- Velocity and temperature contour plots on the cut planes along and across the pipe.
- Velocity and temperature line plots along and across the length of the pipe.
- Perform Mesh independent study for any one case.
- Discuss the effect of length and momentum ratio on results.
momentum ratio:
momentum ratio is the ratio of velocity of cold air to the velocity of hot air.
Cae setup:
initially we have to open the workbench of ansys fluent software,then we have to select fluid flow(fluent) analysis system. the below procedure is to be followed to get the output.
Geometry:
we have to take the Tee joint geometry from CAD software. on that geometry we have take the required volume on which we are going to simulate the flow and mixing of two fluids.
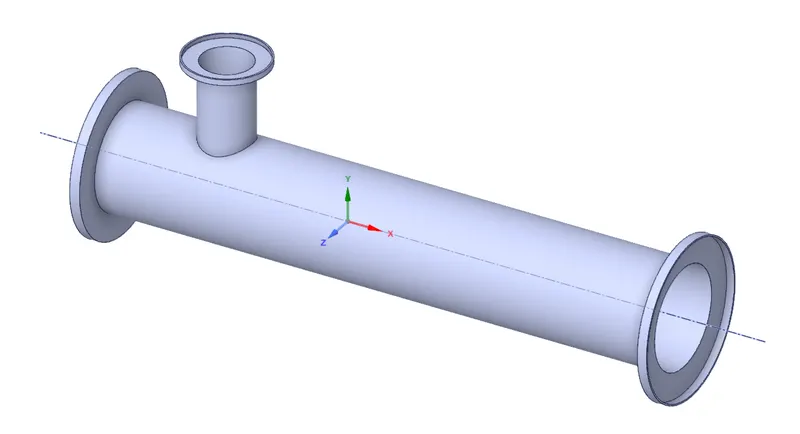
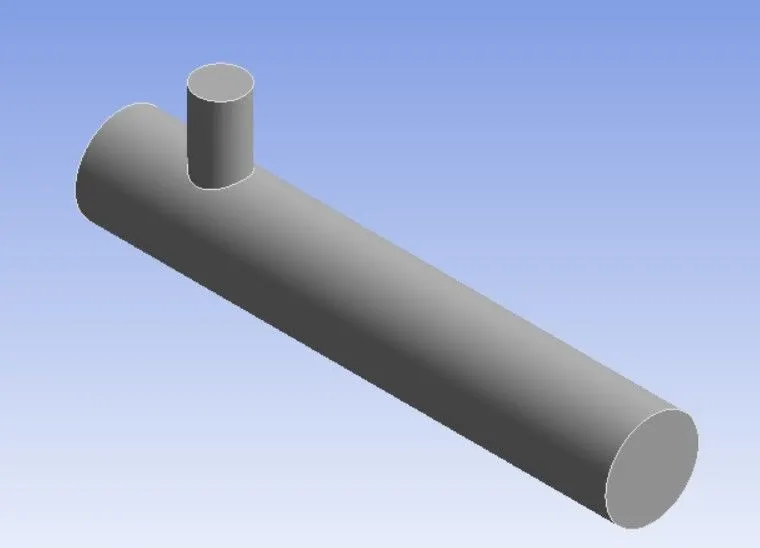
from the above geomatry we have extracted our volume on which somulation is going to be done. the below figure reprents the volume.
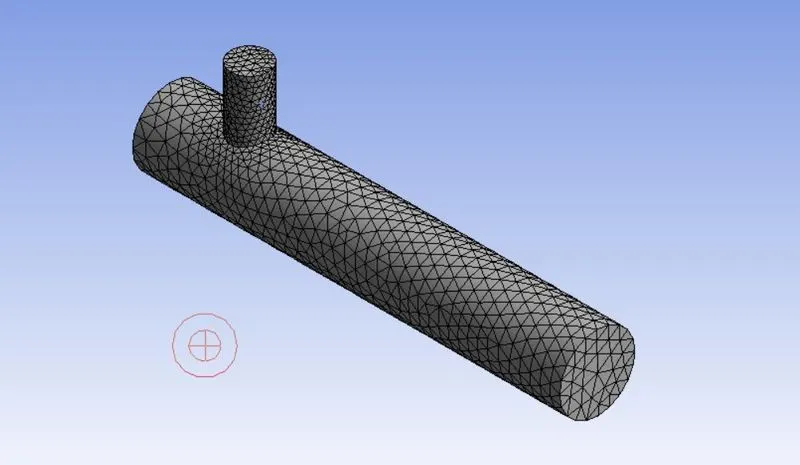
Mesh with element size 0.010219:
now we have to genertae the mesh for the above volume. Ansys fluent have automated feature to generate the mesh. once we click generate mesh button, the mesh will be generated automatically.we have to name the faces of the above volume. here we generated mesh with default element size as 1.0219e-2 m.
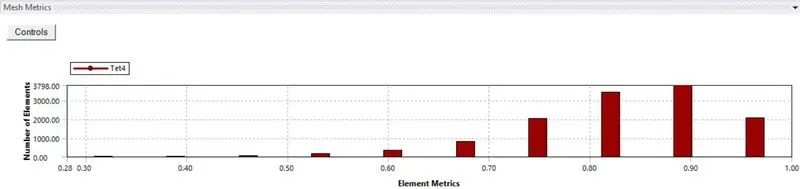
mesh metrix plot-
Setup:
here we have to give boundary conditions to the volume, and then we are going to use pressure-based solver to solve th flow problem. we have to setup steady state simulation here. given that hot fluid inlet temperature is 36 degrees celcius and cold fluid inlet temperature is 19 degrees celcius. there are 12583 tetrahydral cells were created in th volume. the fluid we have taken here is air.
given that hot inlet velocity is 3m/s, by use of momentum ratio of 2 the the cold inlet velocity is 6m/s.
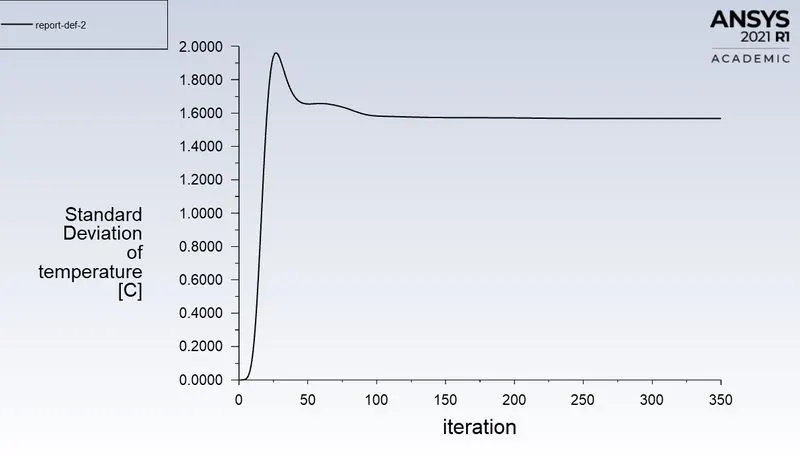
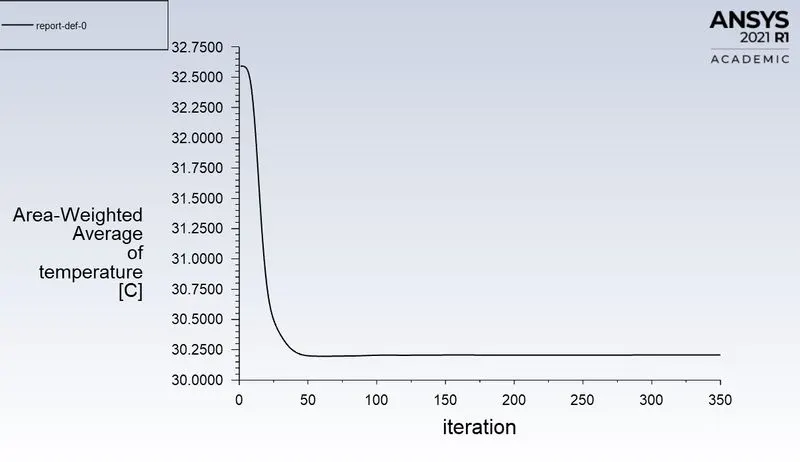
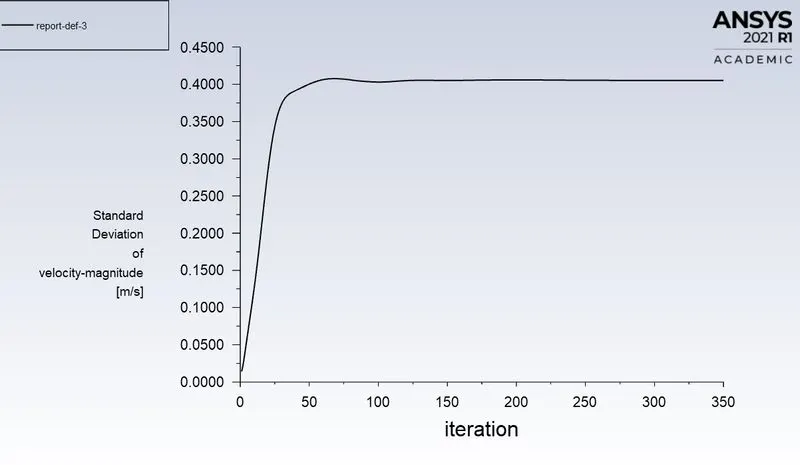
we have to calculate the standard deviation and area weighted average of both temperature and velocity at the outlet of pipe.
- standard deviation provides the measurement of result variation from the mean.
- area weighted average denotes the average values of primitive variables.
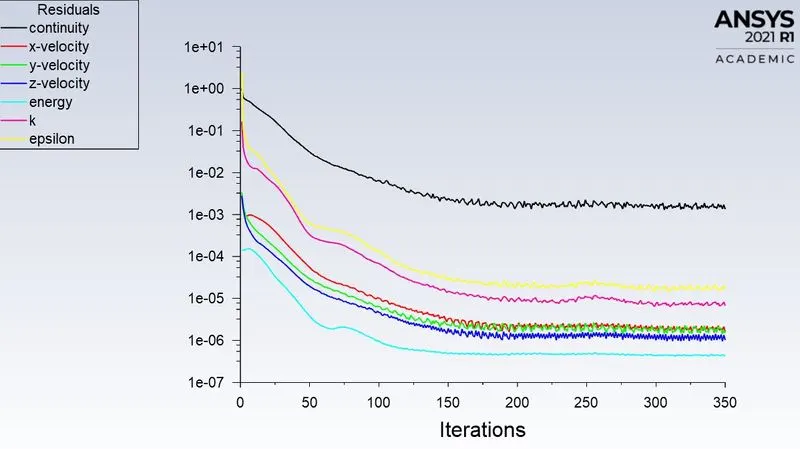
here we use k-epsilon realization turbulance model- the below are obtained plots
residuals plot:
standard deviation and area weighted average plots of temperature at outlet:
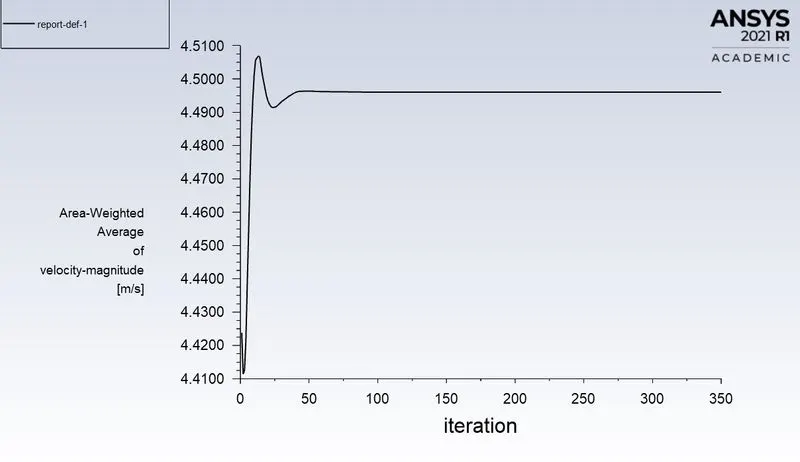
standard deviation and area weighted average plots of velocity at outlet:
Results:
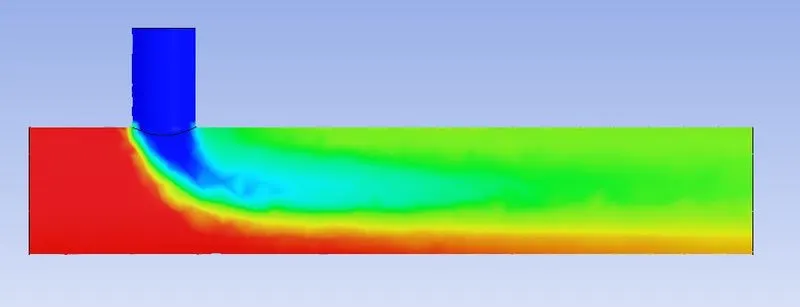
temperature contour plot:
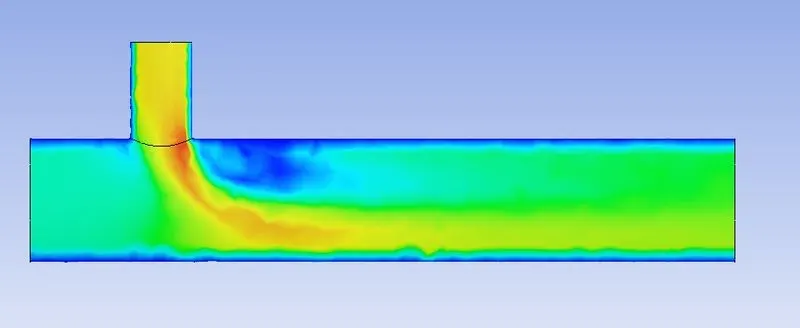
velocity contour plot:
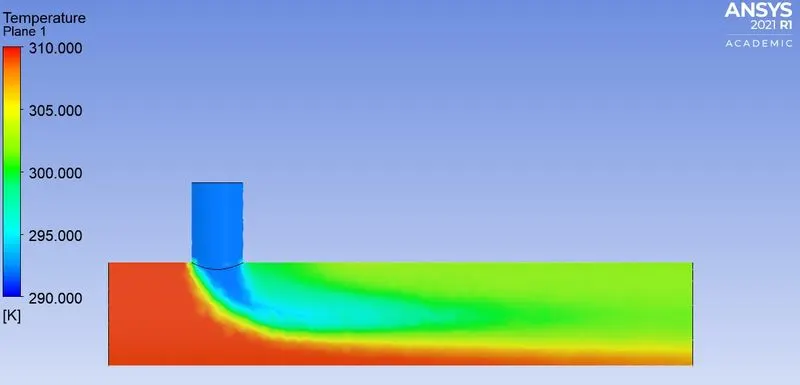
from temperature contour plot we can see that there is a diffusion at the mixing cold air and hot air. this is because of the large size of the cell. to make it as converge we have to decrease the size of the cell.
with element size 0.003m:
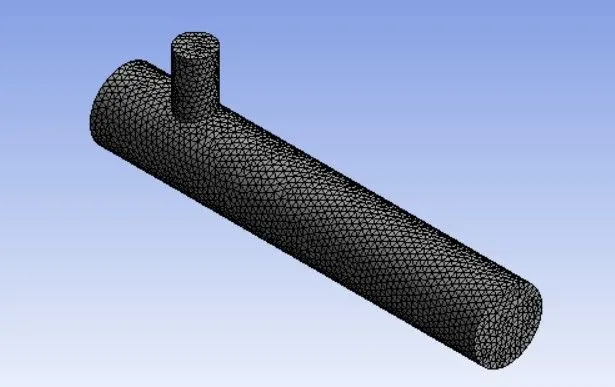
now go to the mesh, reduce the element size to 0.003m then the obatined mesh is with 39817 tetrahydral cells.
mesh metrix plot:
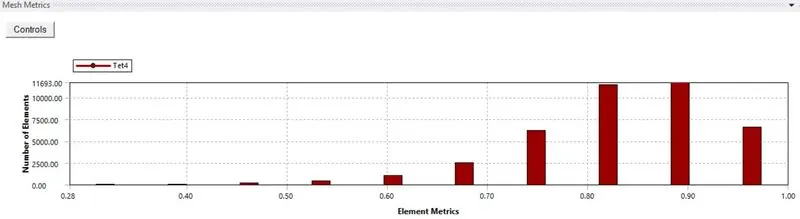
we have to calculate the results for the below 2 cases.first we have to use k-epsilon and k-omega SST models for first case, then we have to select the best model and then we are going to use that best modal to secong case.
- Case 1
- Short mixing tee with a hot inlet velocity of 3m/s.
- Momentum ratio of 2, 4.
- Case 2
- Long mixing tee with a hot inlet velocity of 3m/s.
- Momentum ratio of 2, 4.
case 1:
setup-
a.given that hot inlet velocity is 3m/s, by use of momentum ratio of 2 the the cold inlet velocity is 6m/s.
we have to calculate the standard deviation and area weighted average of both temperature and velocity at the outlet of pipe. there are 39817 tetra hydral cells in the volume.
here we use k-epsilon realization turbulance model- the below are obtained plots
residuals plot:
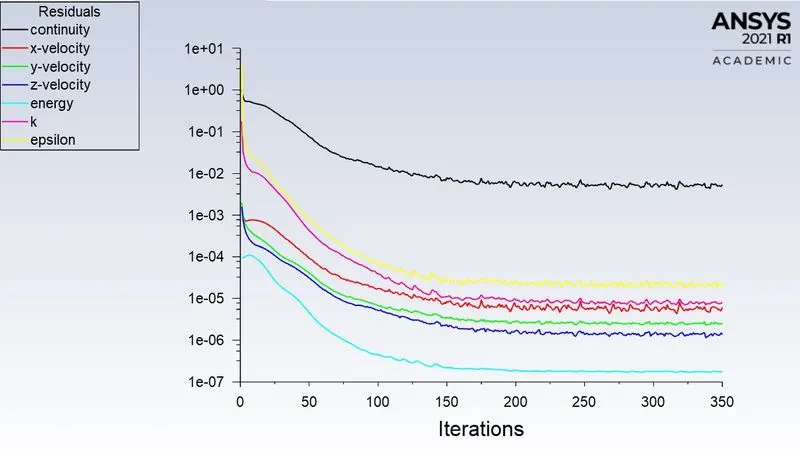
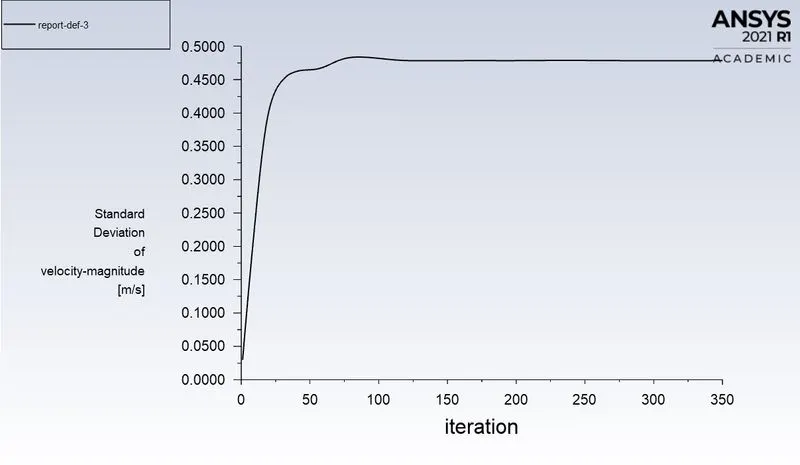
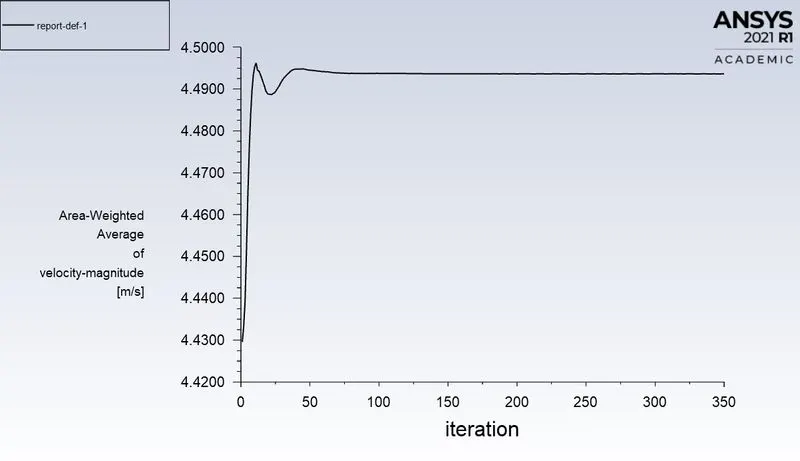
standard deviation and area weighted average plots of temperature at outlet:
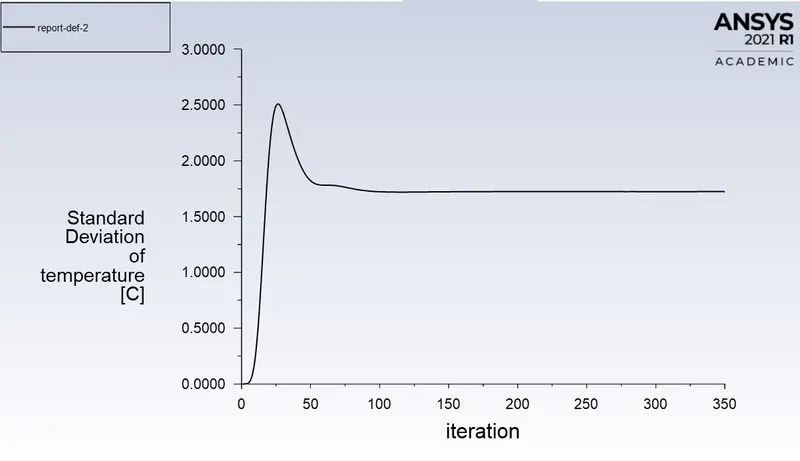
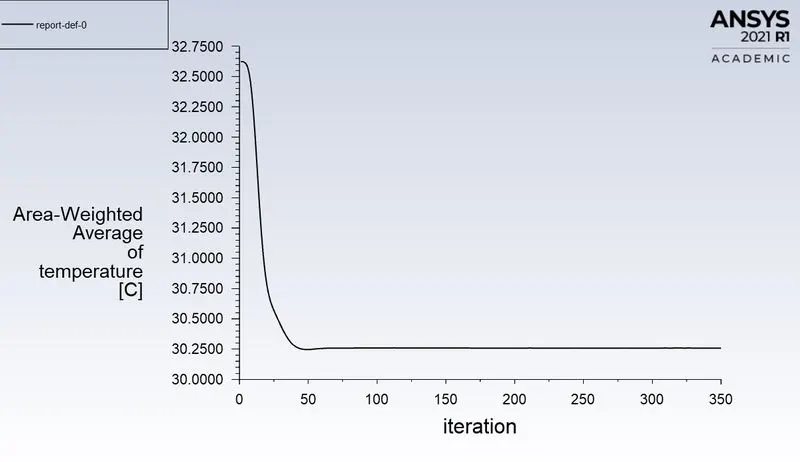
standard deviation and area weighted average plots of velocity at outlet:
temeprature contour plot:
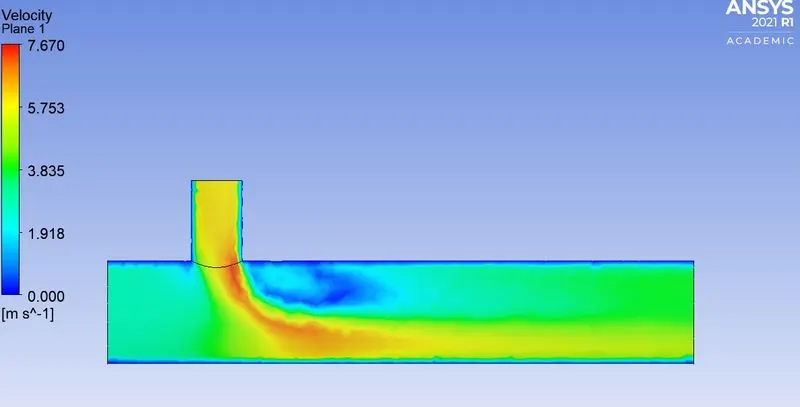
velocity contour plot:
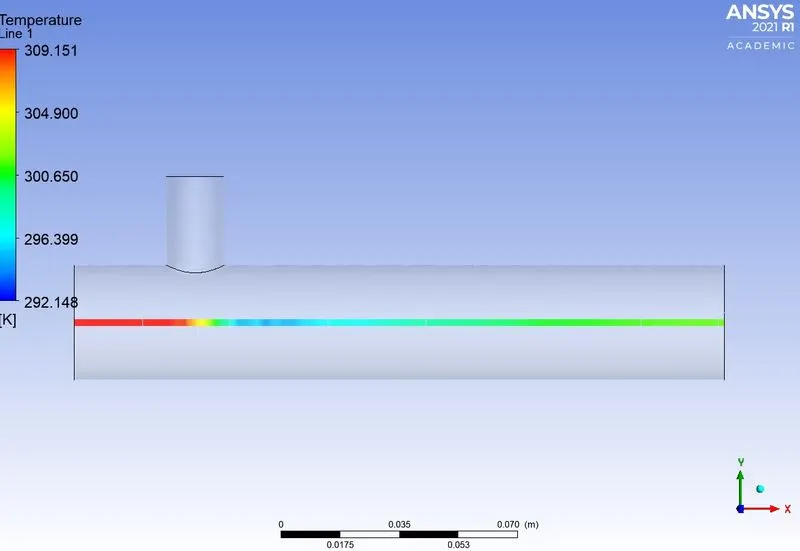
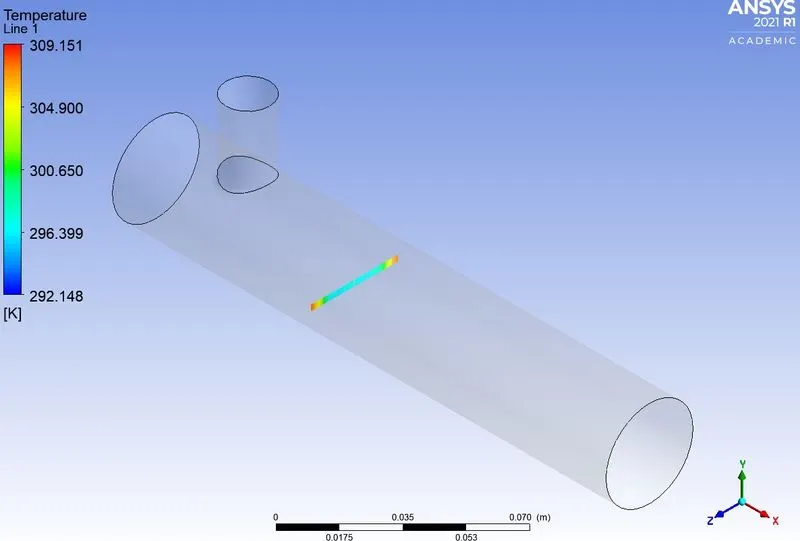
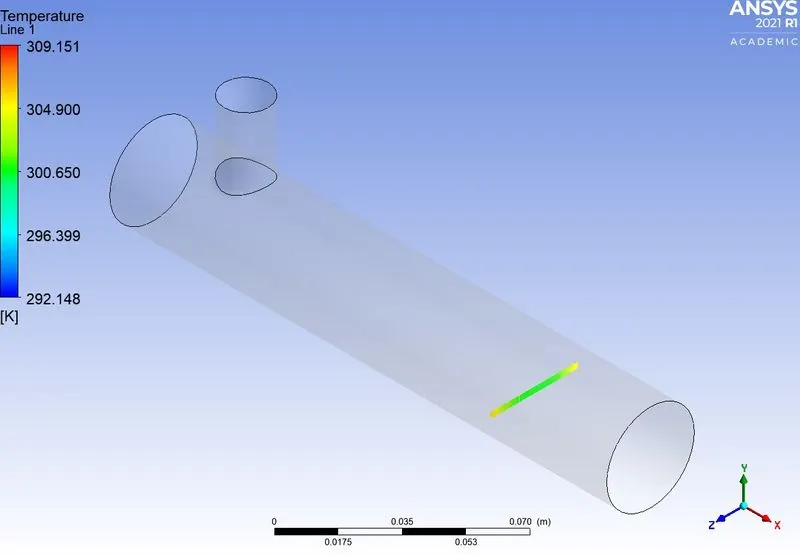
temperature line plots along and across the pipe:
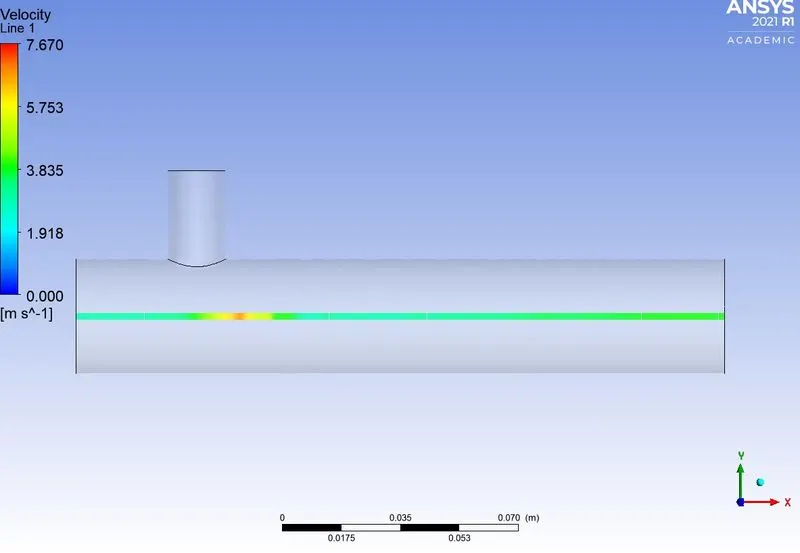
velocity contour plot:
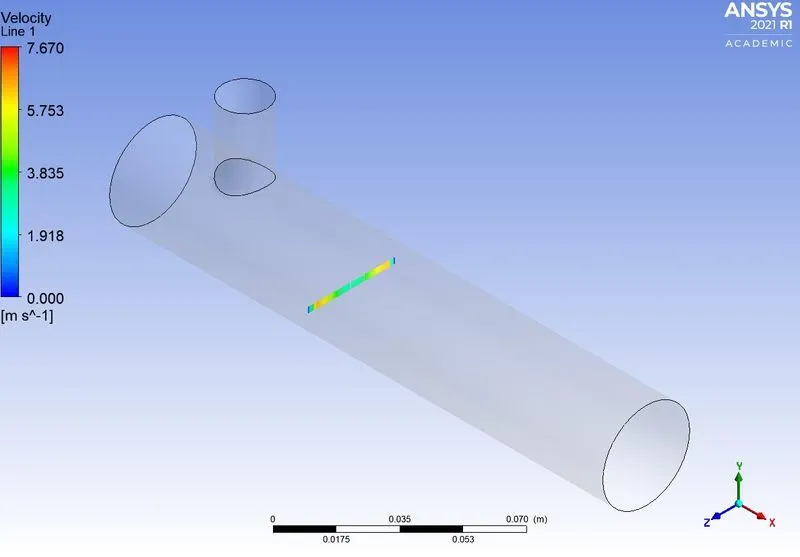
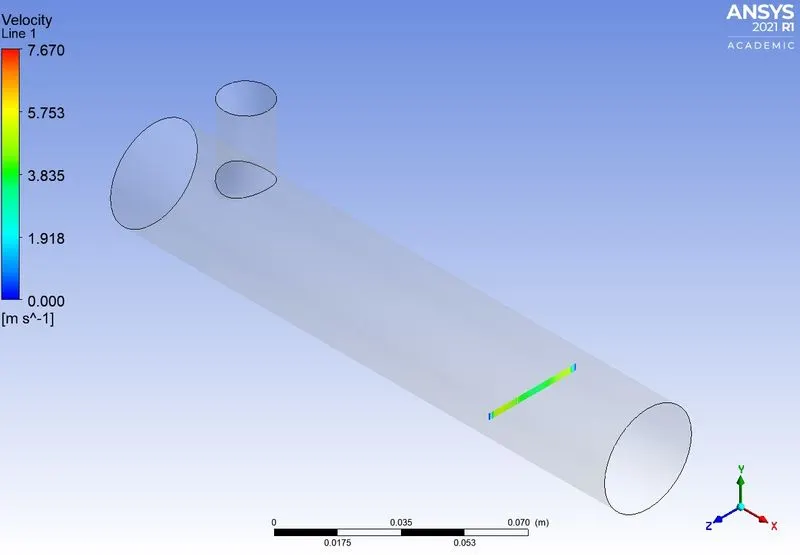
now we use k-omega SST model- the below are obtained plots
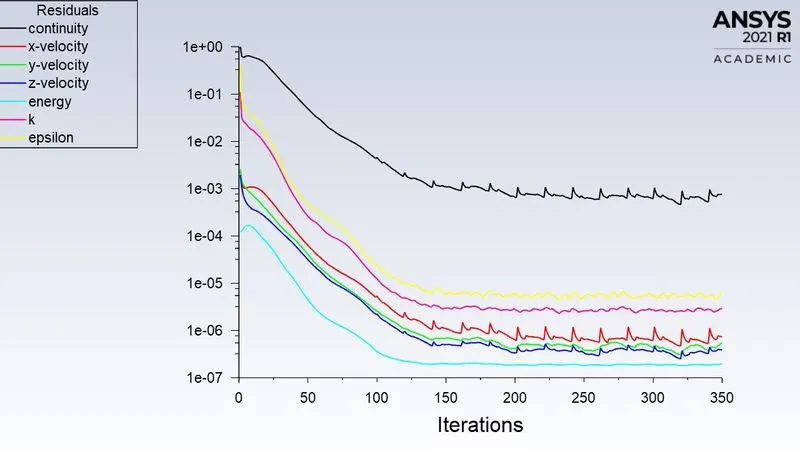
residuals plot:
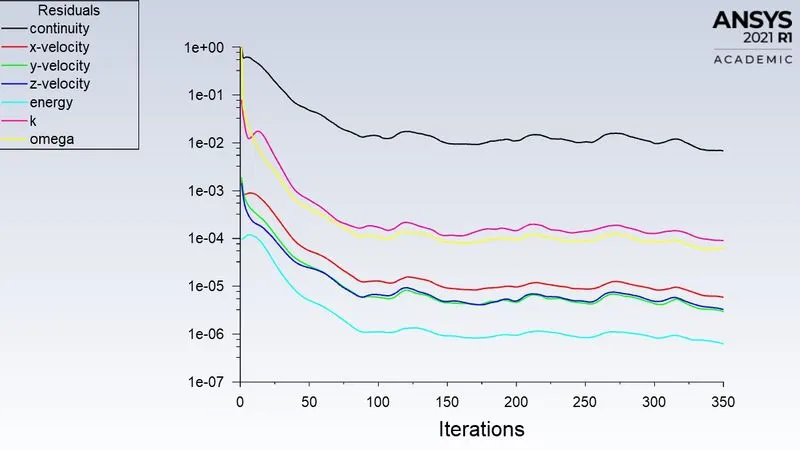
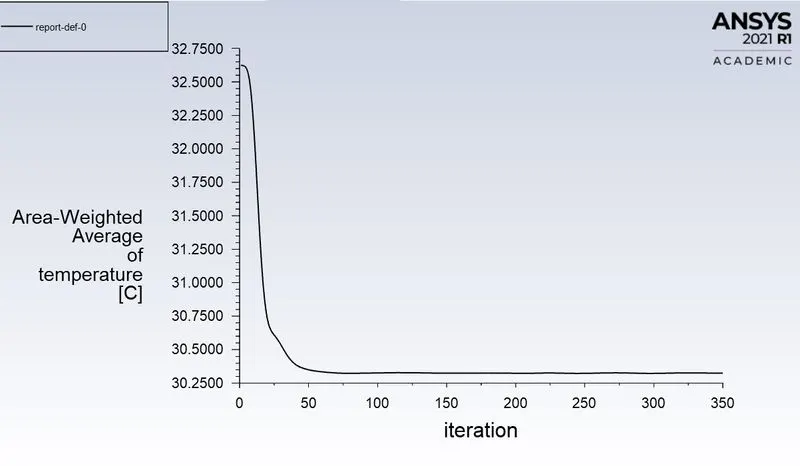
standard deviation and area weighted average plots of temperature at outlet:
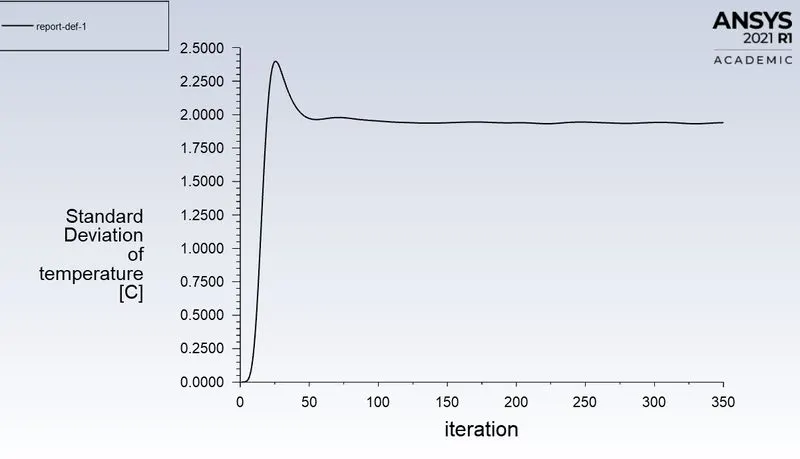
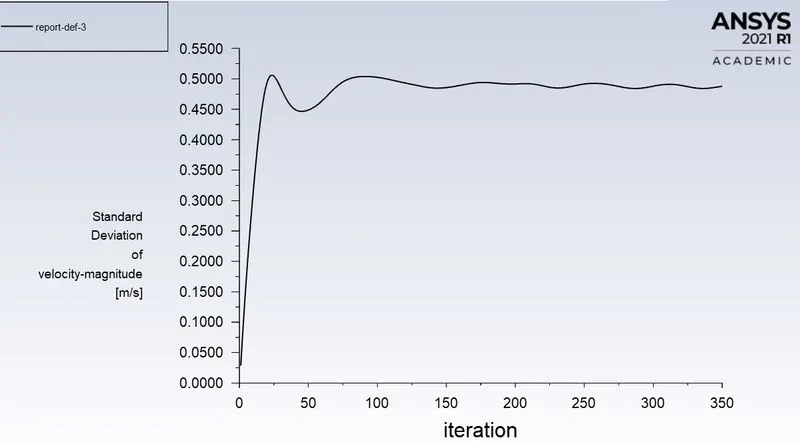
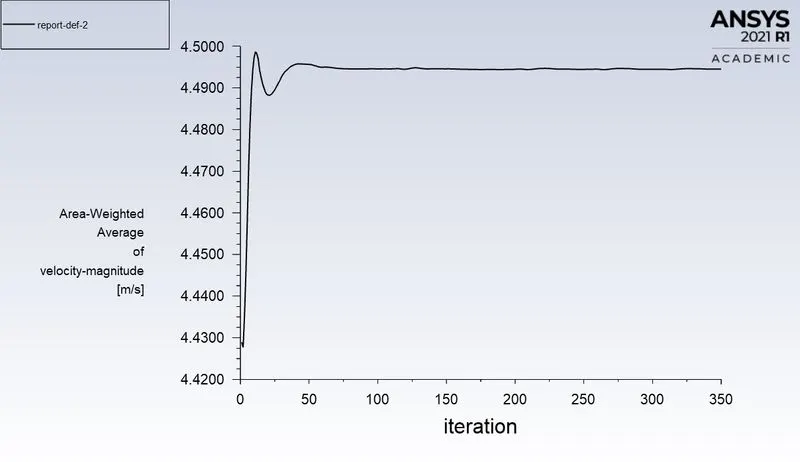
standard deviation and area weighted average plots of velocity at outlet:
b.given that hot inlet velocity is 3m/s, by use of momentum ratio of 4 the the cold inlet velocity is 12m/s.
here we use k-epsilon realization turbulance model- the below are obtained plots
residuals plot:
standard deviation and area weighted average plots of temperature at outlet:
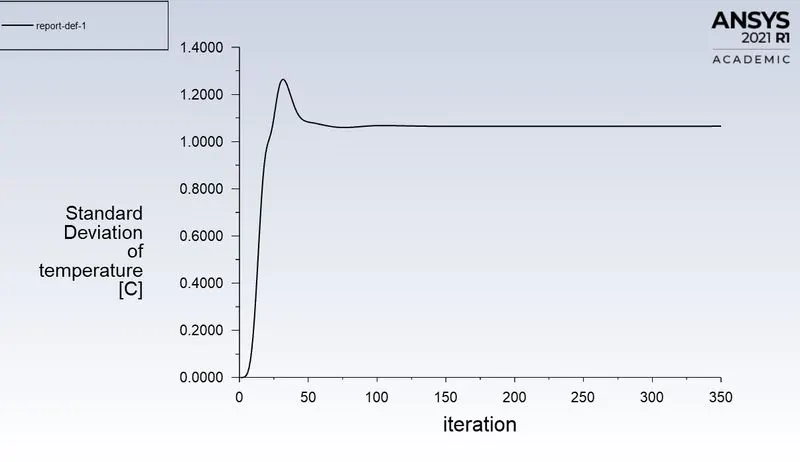
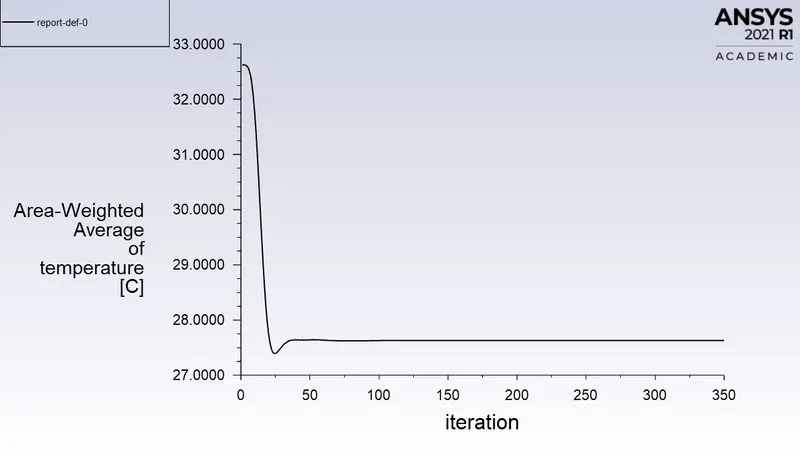
standard deviation and area weighted average plots of velocity at outlet:
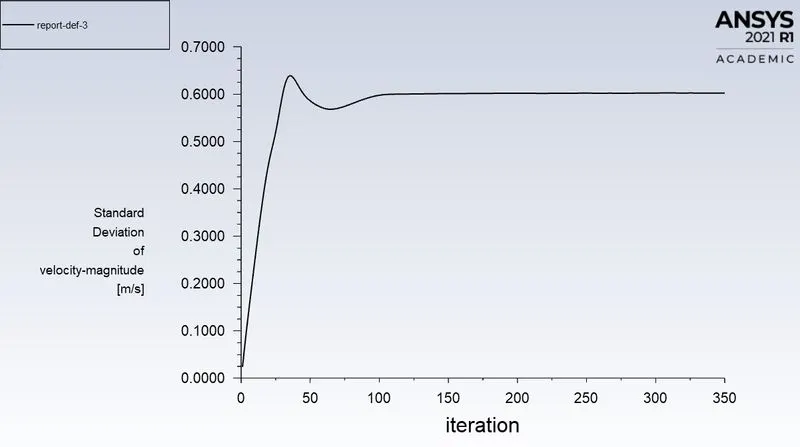
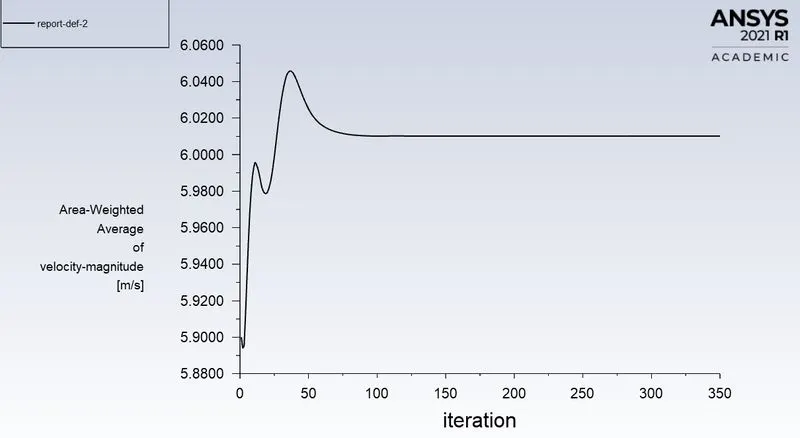
temperature plot along the length of pipe:
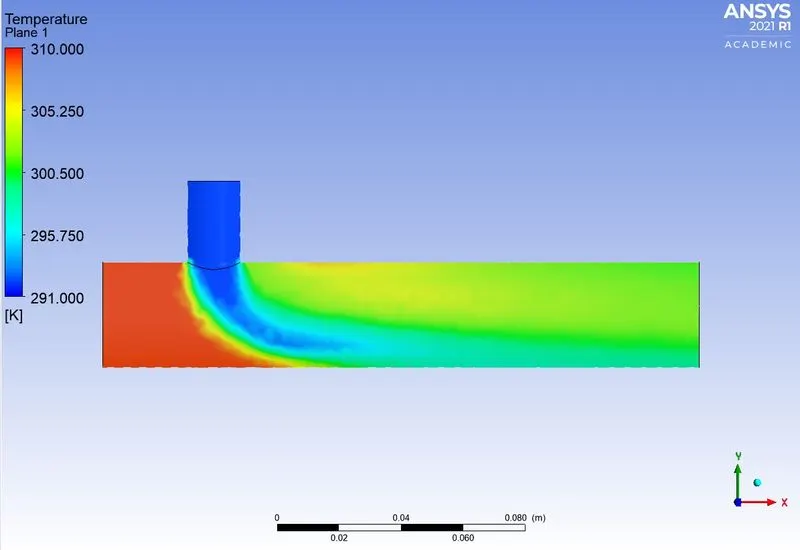
velocity contour plot along the length of pipe:
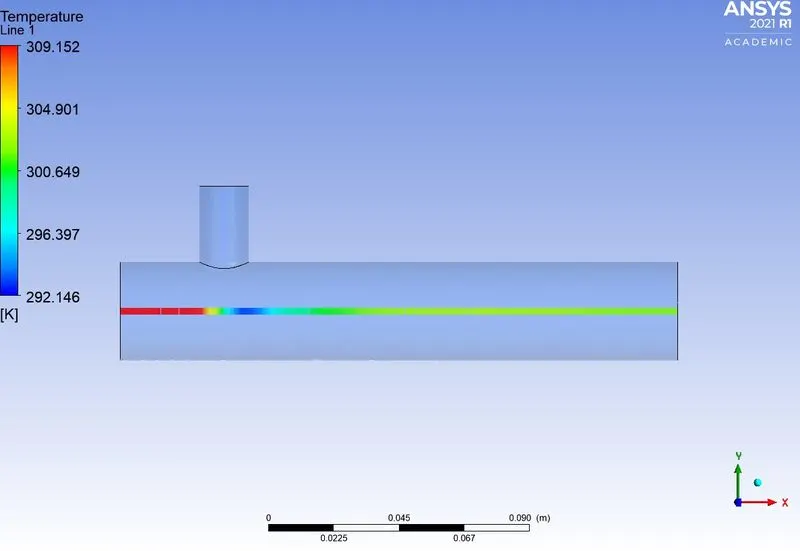
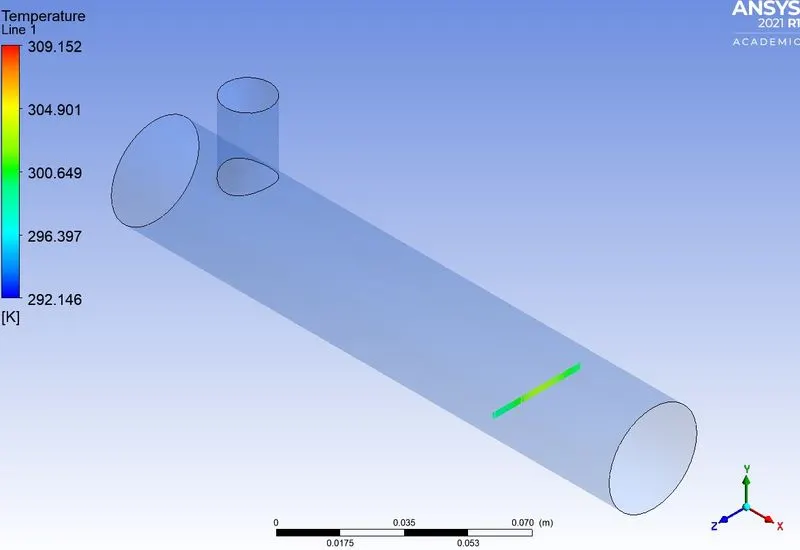
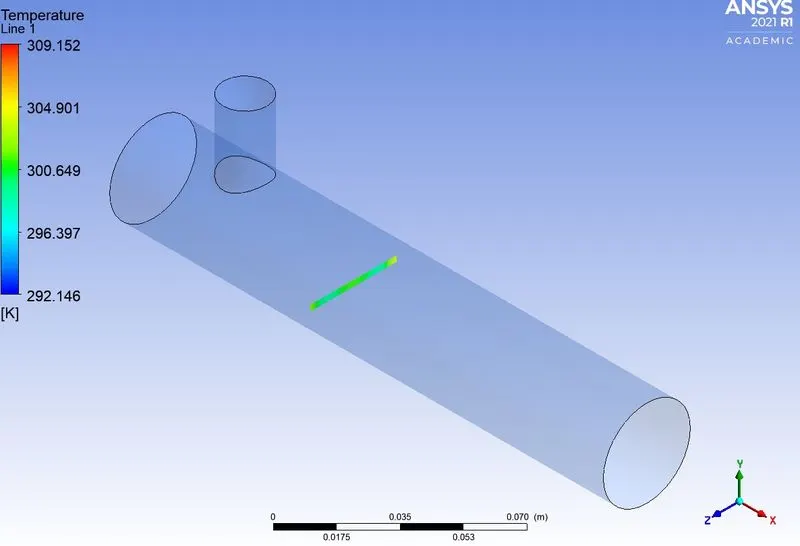
temperature line plot along and across the length of pipe:
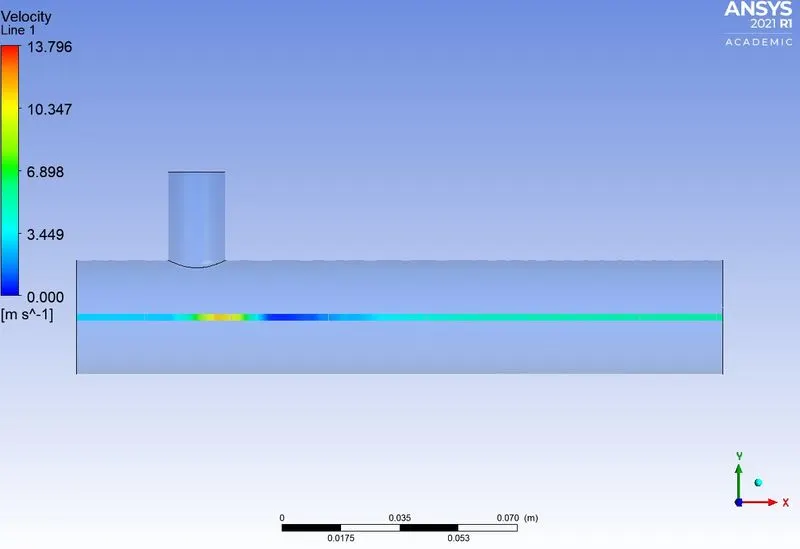
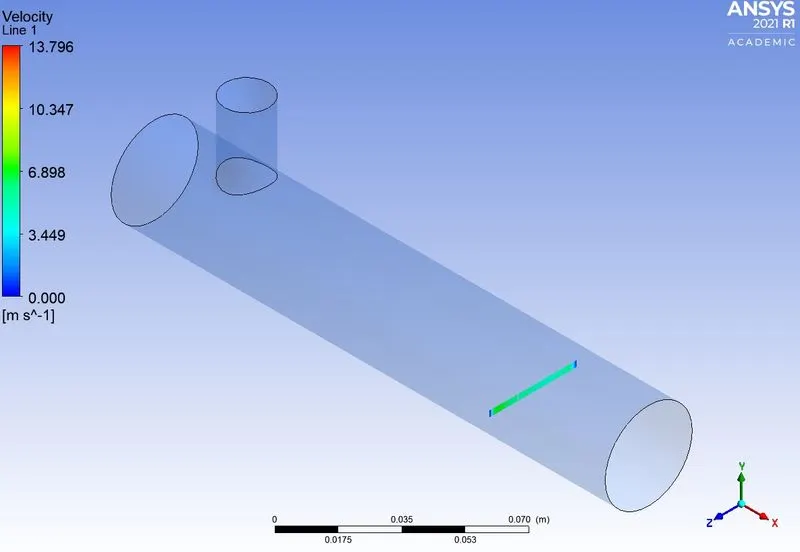
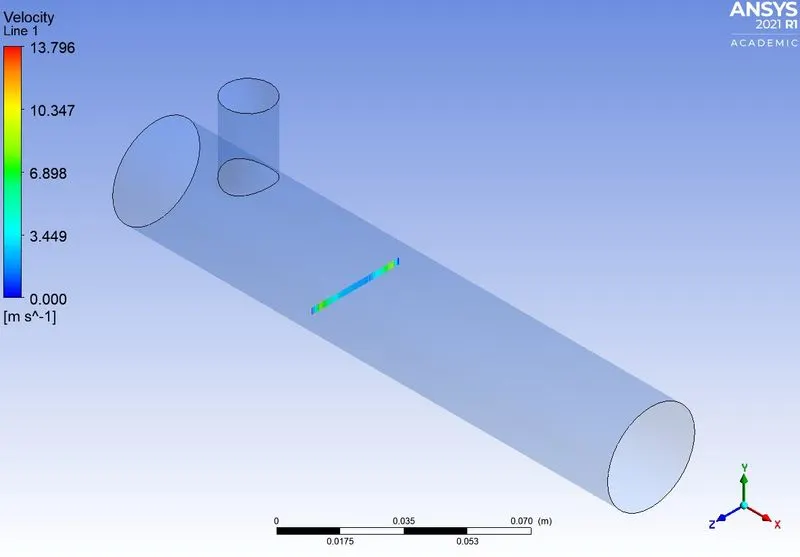
velocity line plot along and across the length of pipe:
now we use k-omega SST model- the below are obtained plots
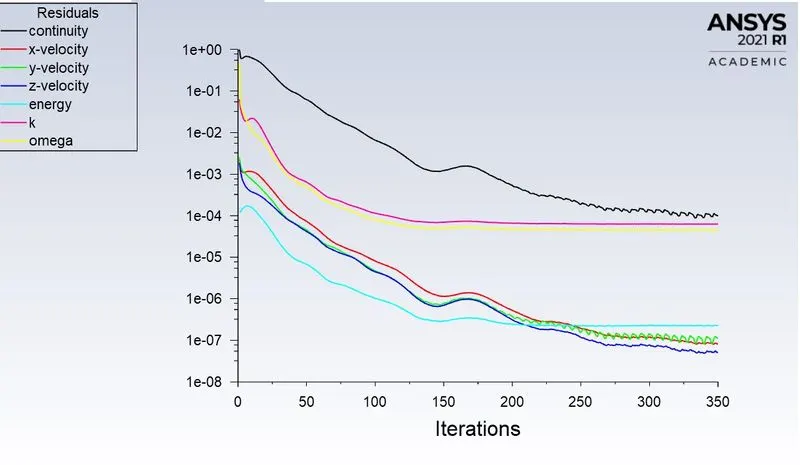
residuals plot:
standard deviation and area weighted average plots of temperature at outlet:
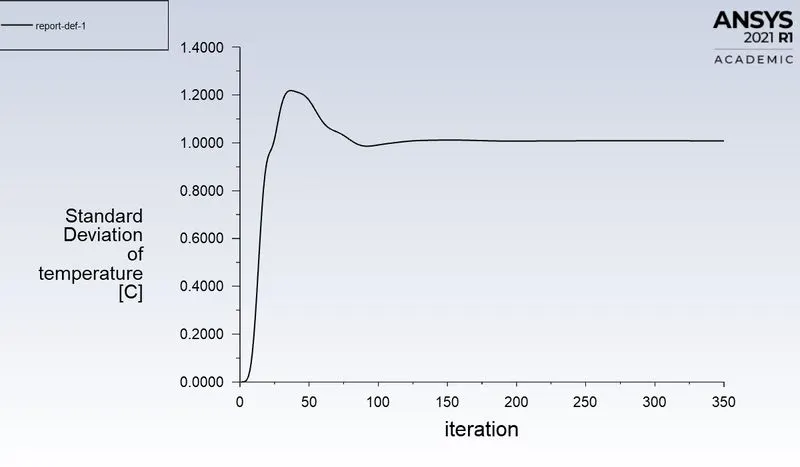
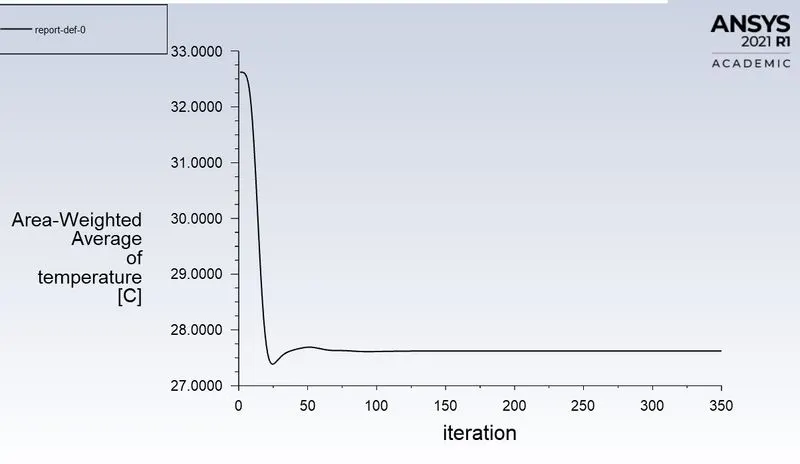
standard deviation and area weighted average plots of velocity at outlet:
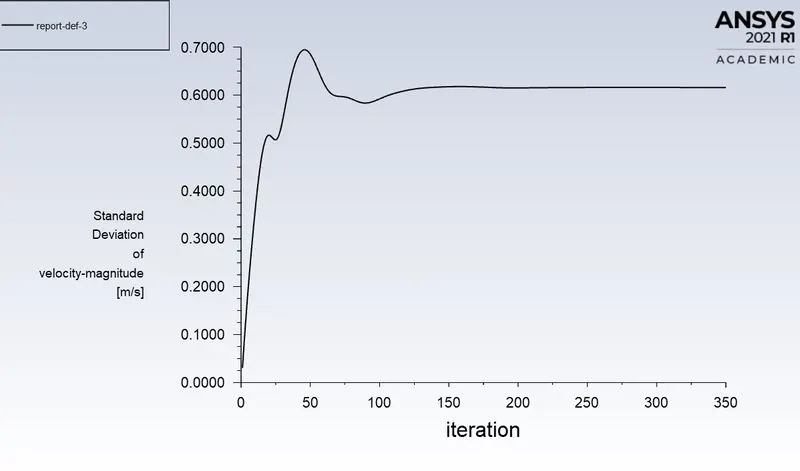
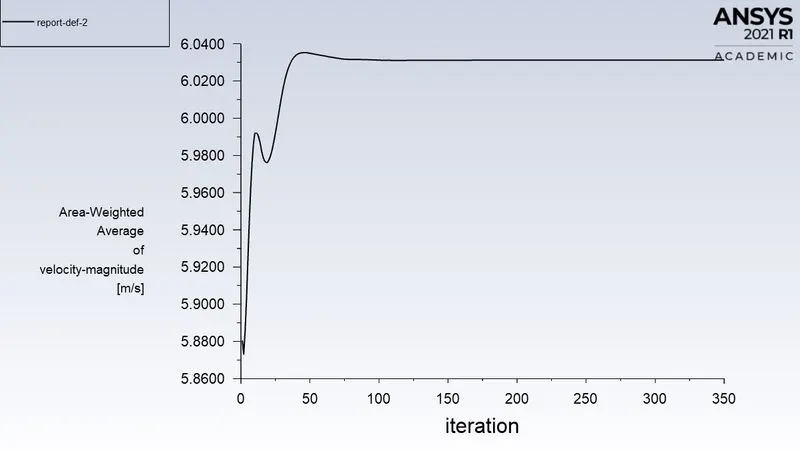
by comparing both k-epsilon model and k- omega model in the mixing tee problem with velocities 6 and 12 m/s.
from the above plots-
| residuals | standard deviation of T | standard deviation of V | |
| k-epsilon model at 6 m/s | took 200 iterations to reach steady | took 125 iterations to reach steady | took 125 iterations to reach steady |
| k-omega model at 6 m/s | taking more than 350 iterations to reach steady | took 250 ieterations to reach steady | taking more than 350 iterations to reach steady |
| k-epsilon model at 12 m/s | took 175 iterations to reach steady | took 125 iterations to reach steady | took 125 iterations to reach steady |
| k-omega model at 12 m/s | taking more than 350 iterations to reach stead | took 200 iterations to reach steady | took 200 iterations to reach steady |
from the table we conclude that k-epsilon realization model took less number of iterations to reach steady ststae. here k- epsilon realization model is best compared to k-omega SST model. so we use k-epsilon model for further cases.
case-2:
a. here we have taken long mixing tee with hot air velocity 3m/s,with the momentum ratio of 2 we get cold air velocity is 6m/s.
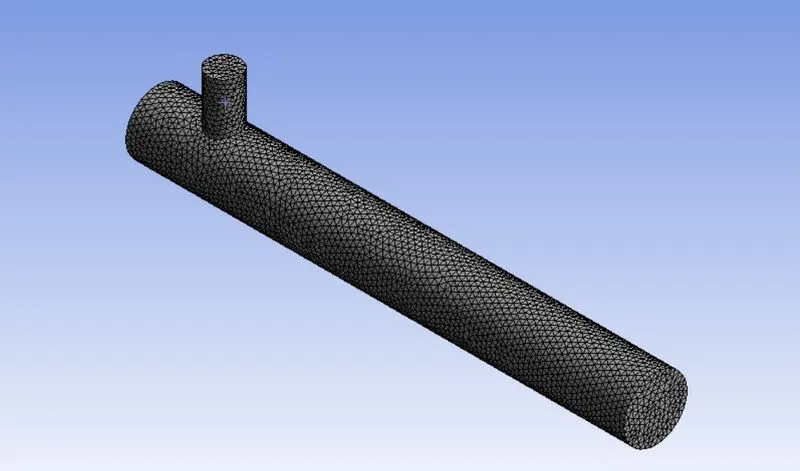
mesh obtained for long mix tee with 56373 tetrahydral cells is
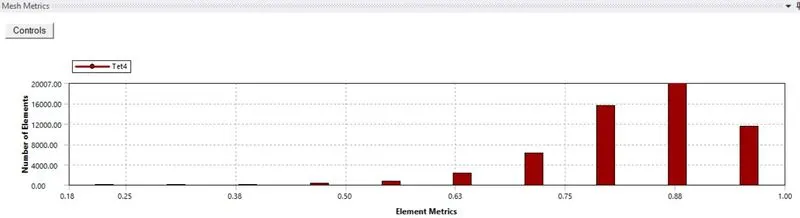
mesh metrix plot:
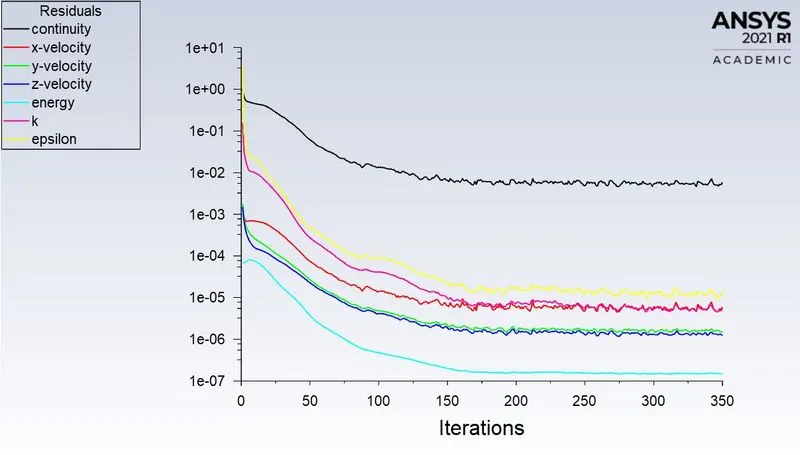
after giving the boundary conditions in the set up, the below are final plots obtained.
residuals plot:
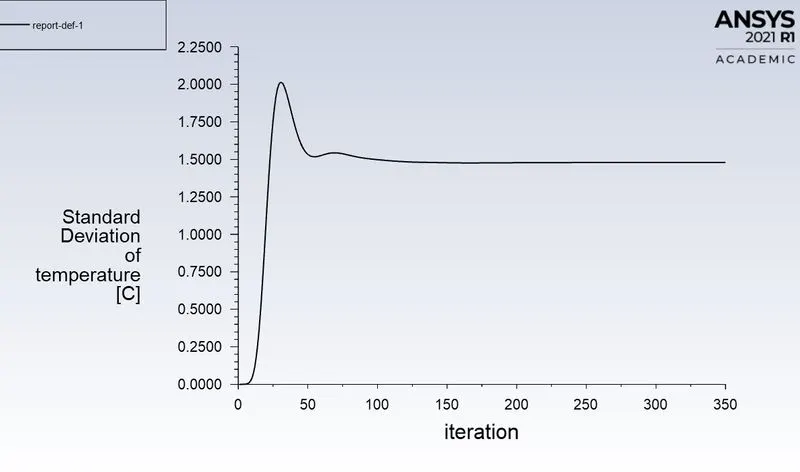
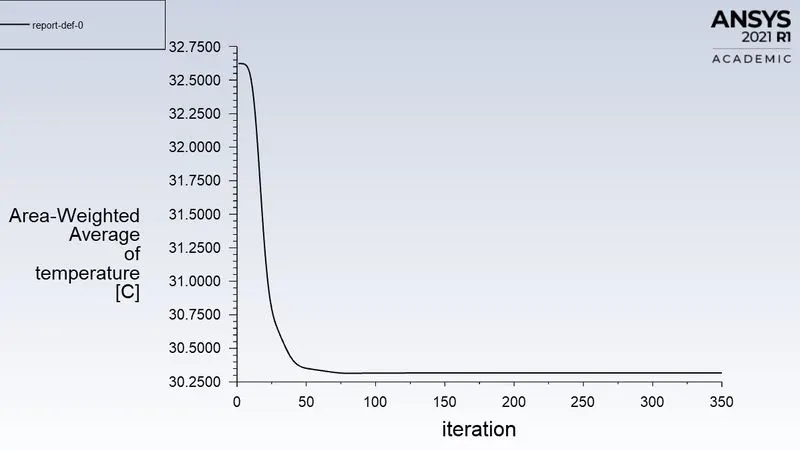
standard deviation and area weighted average of temperature plots:
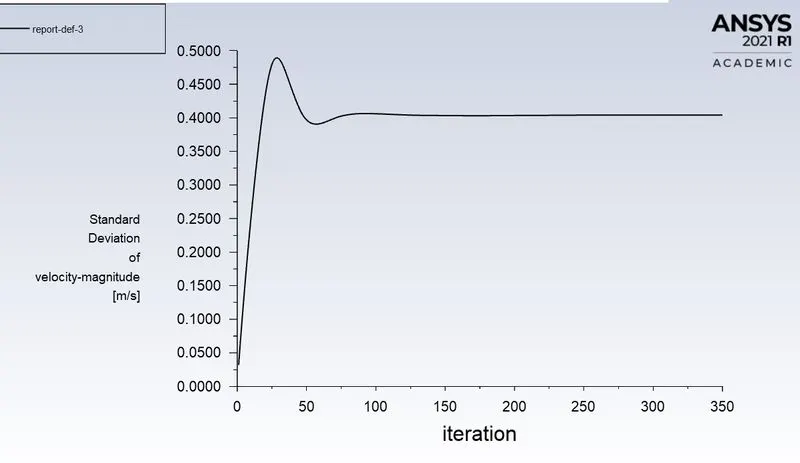
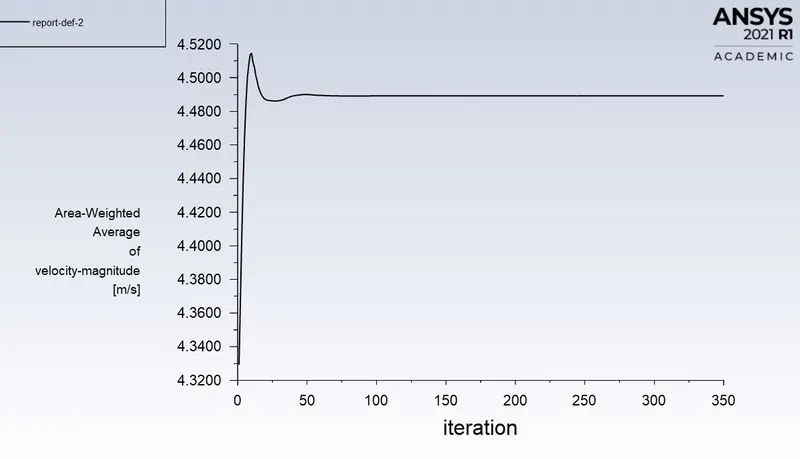
standard deviation and area weighted average of velocity plots:
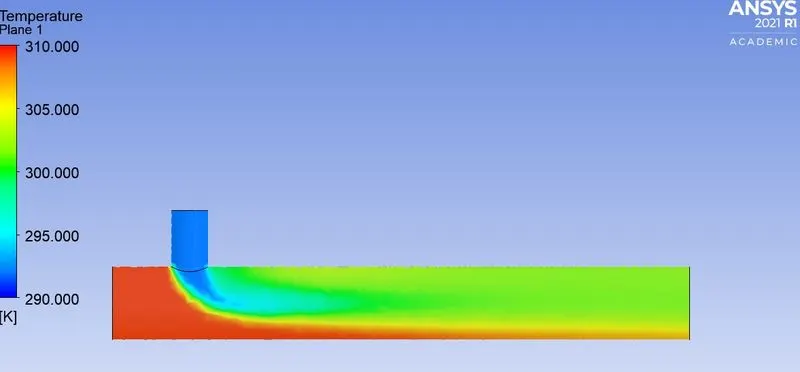
temperature contour plot:
velocity contour plot:
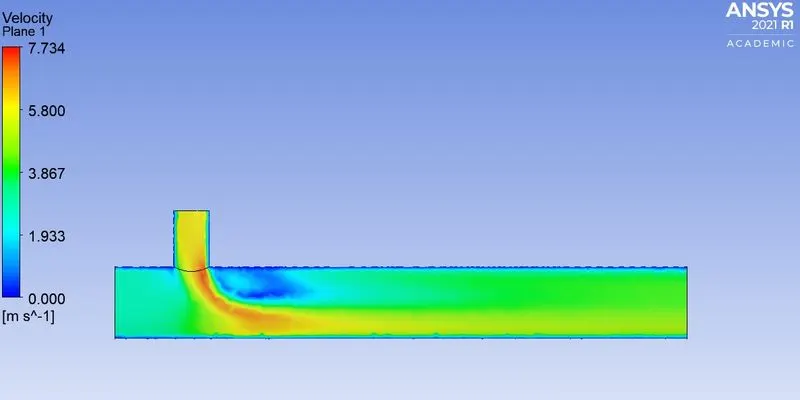
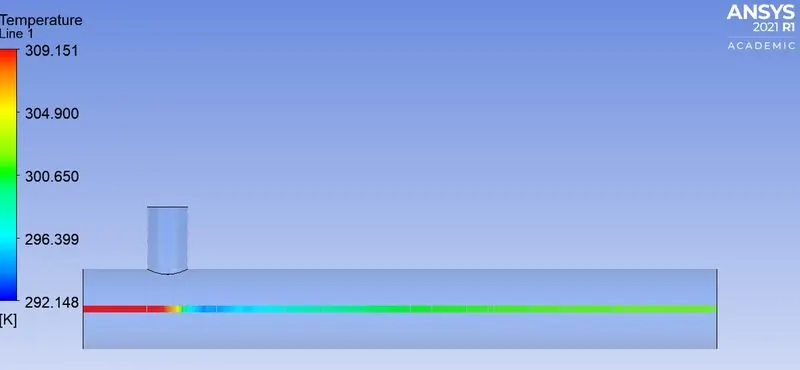
temperature line plots along and across the length:
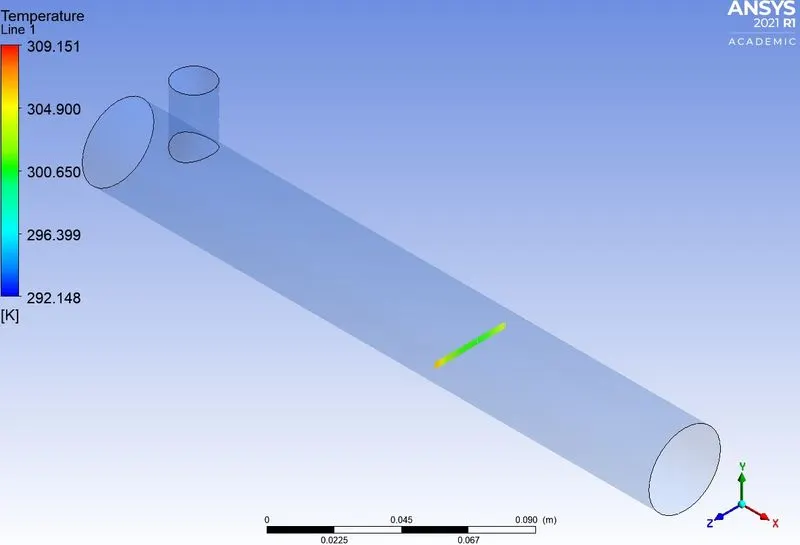
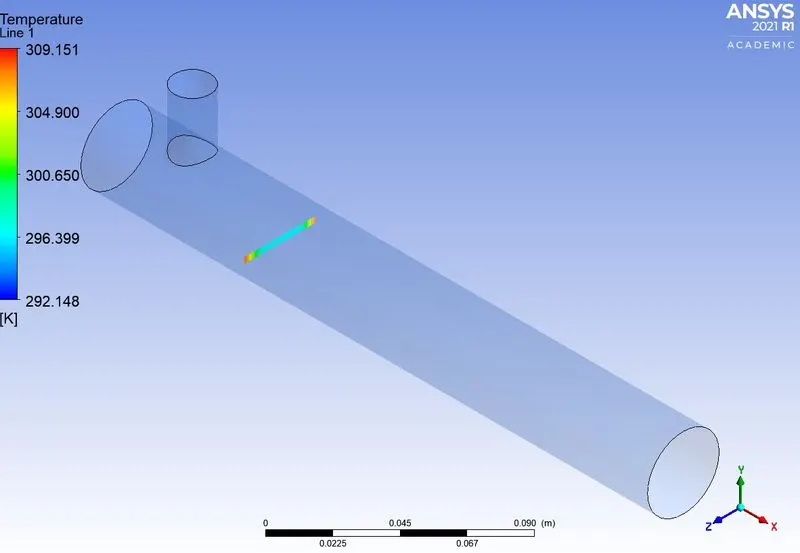
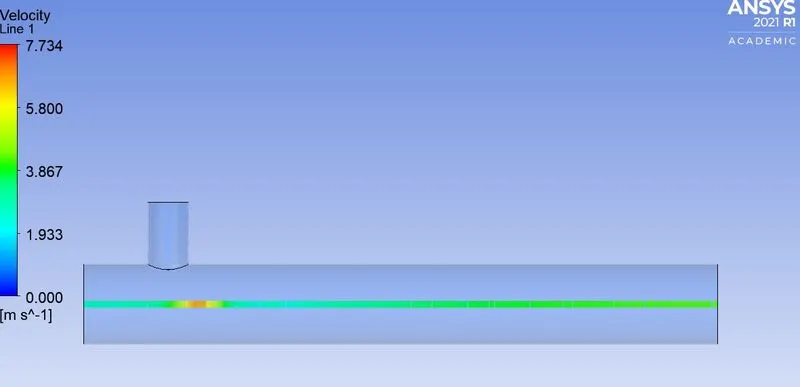
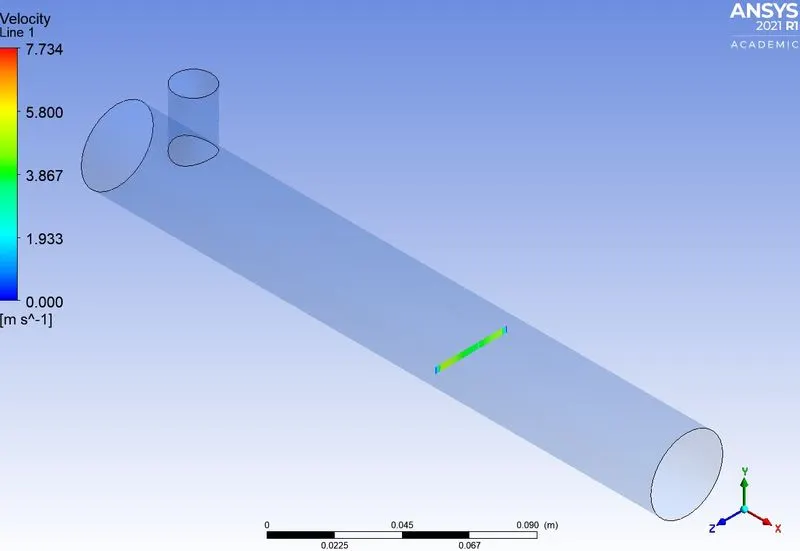
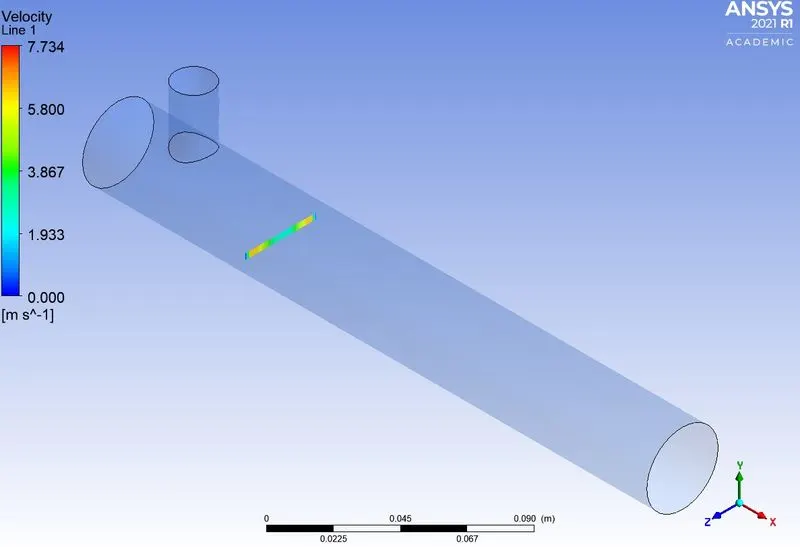
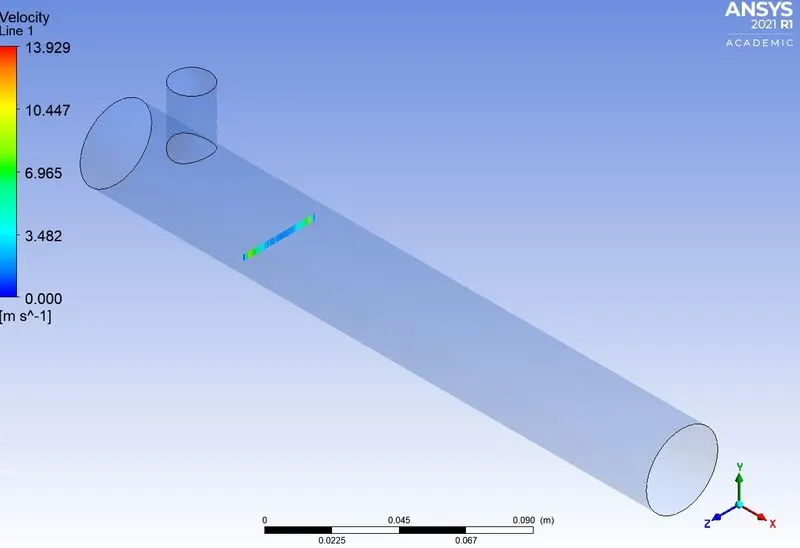
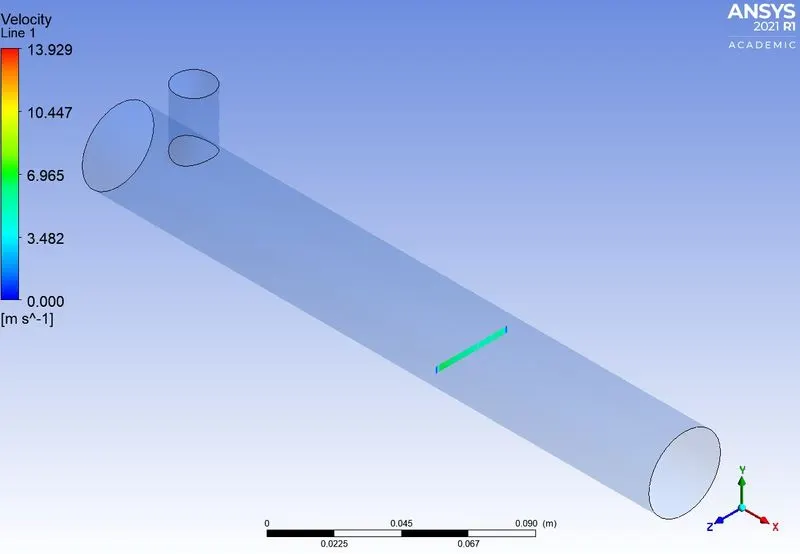
velocity line plots along and across the length:
b. here we have taken long mixing tee with hot air velocity 3m/s,now with the momentum ratio of 4 we get cold air velocity is 12m/s.
how the final obtained plots are
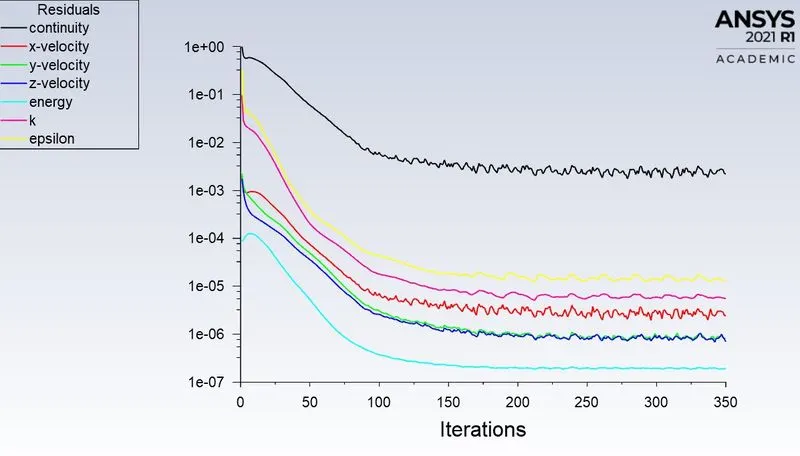
residual plot:
standard deviation and area weighted average of temperature plots:
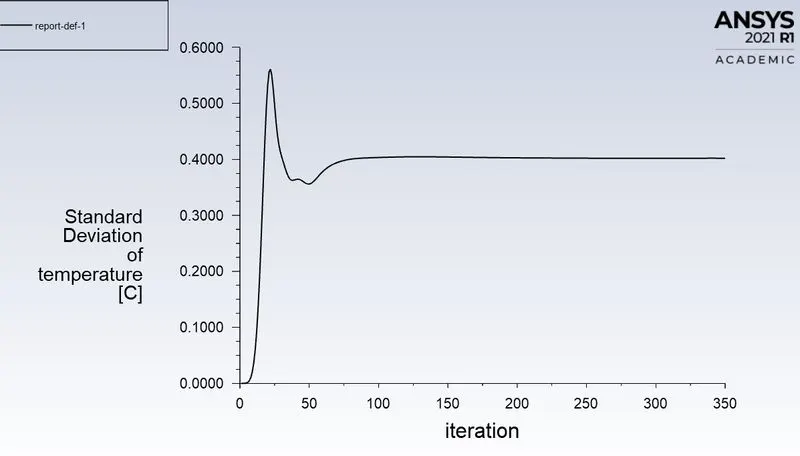
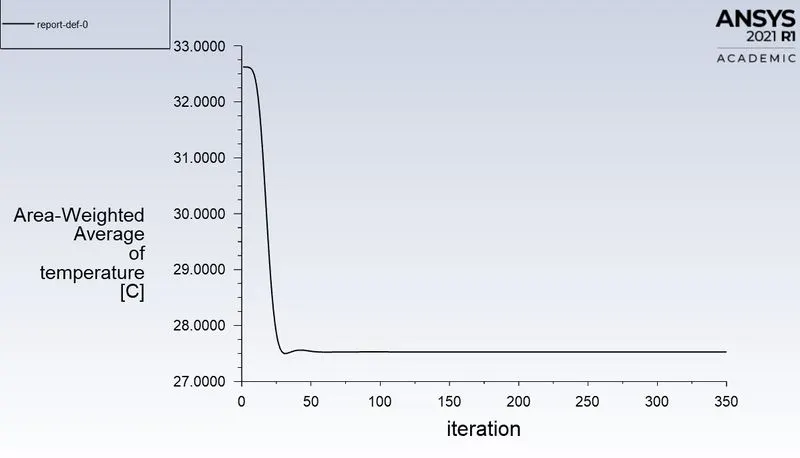
standard deviation and area weighted average of velocity plots:
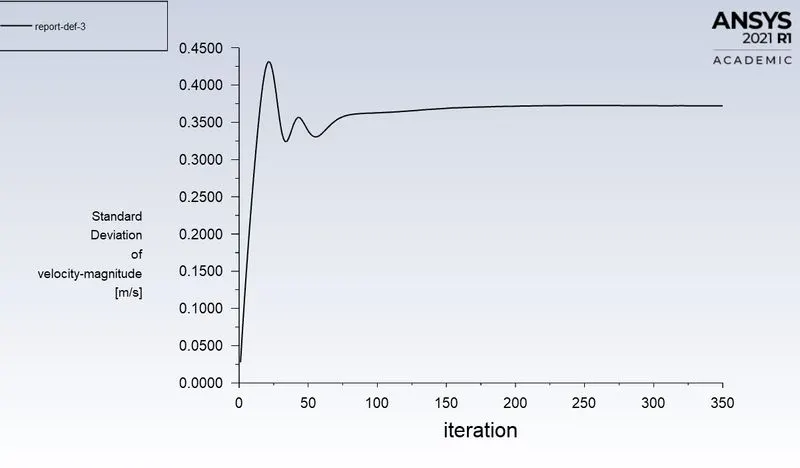
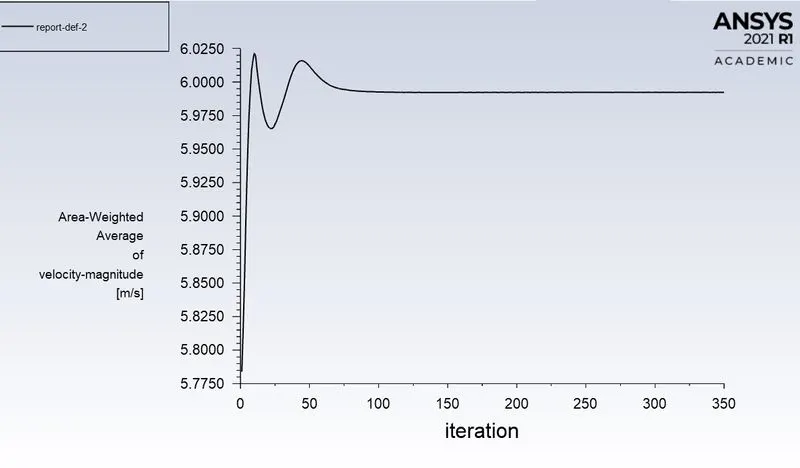
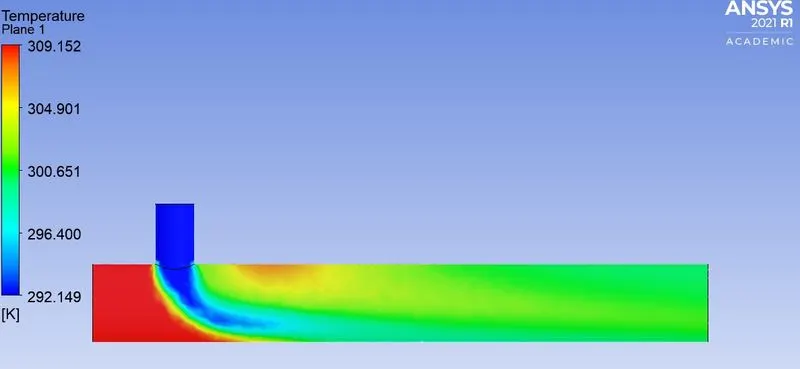
temperature contour plot:
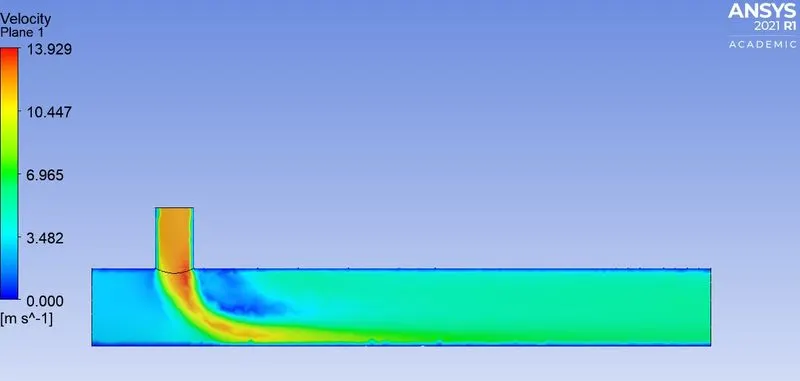
velocity contour plot:
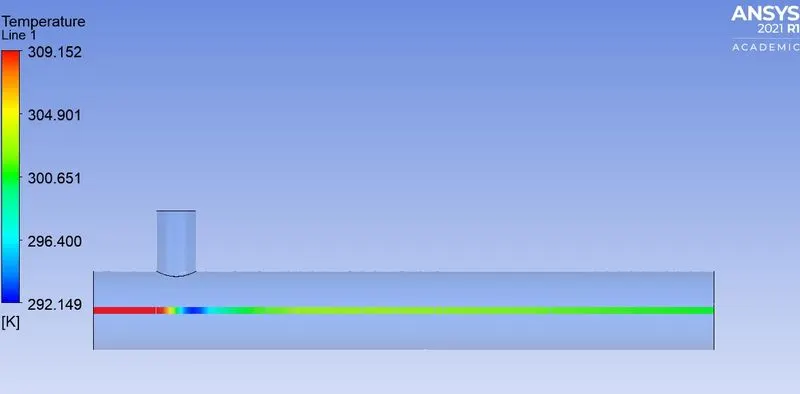
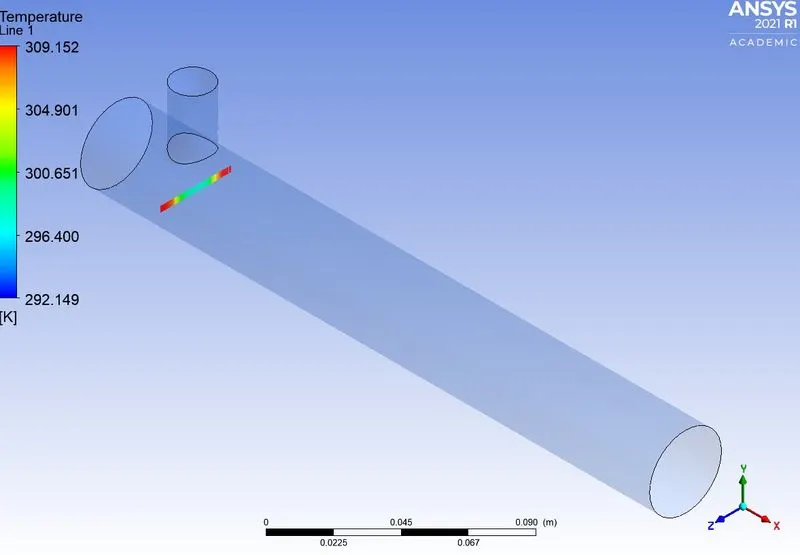
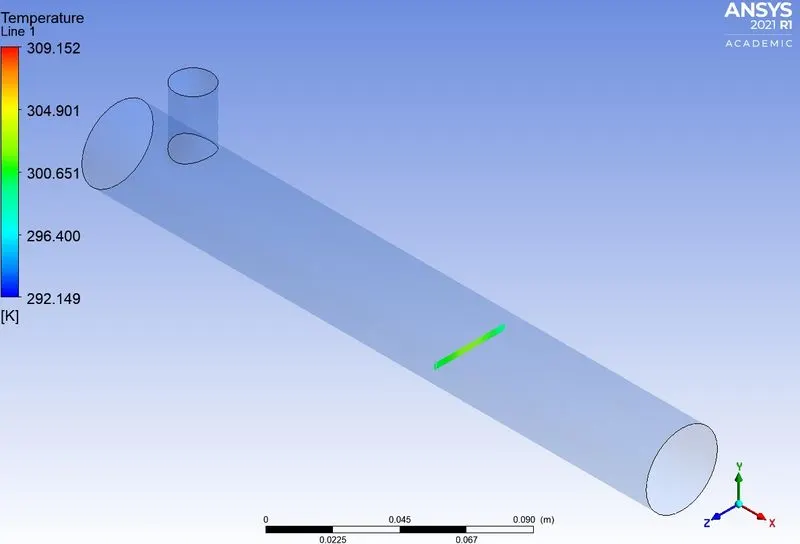
temperature line plots along and across the length:
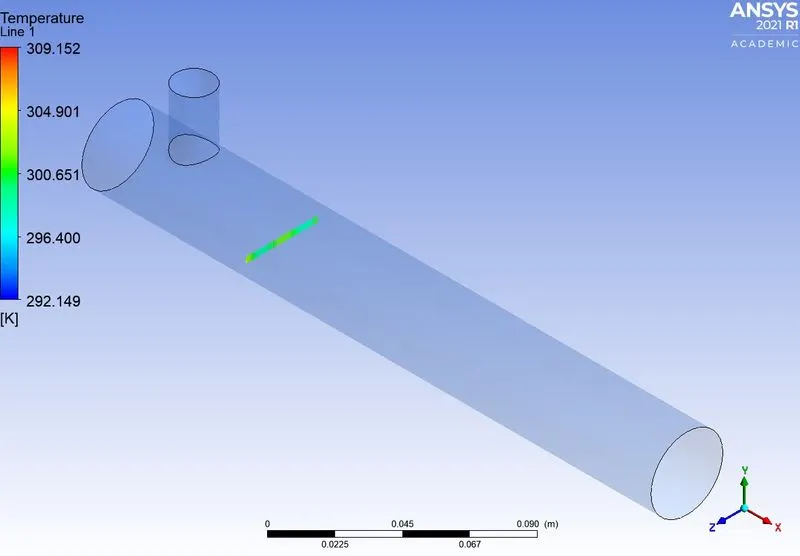
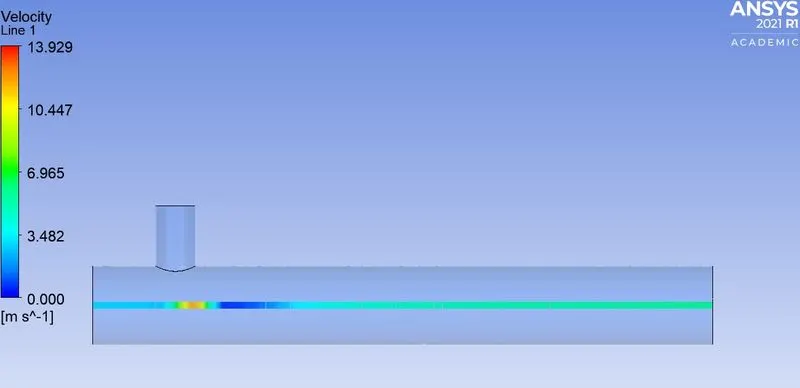
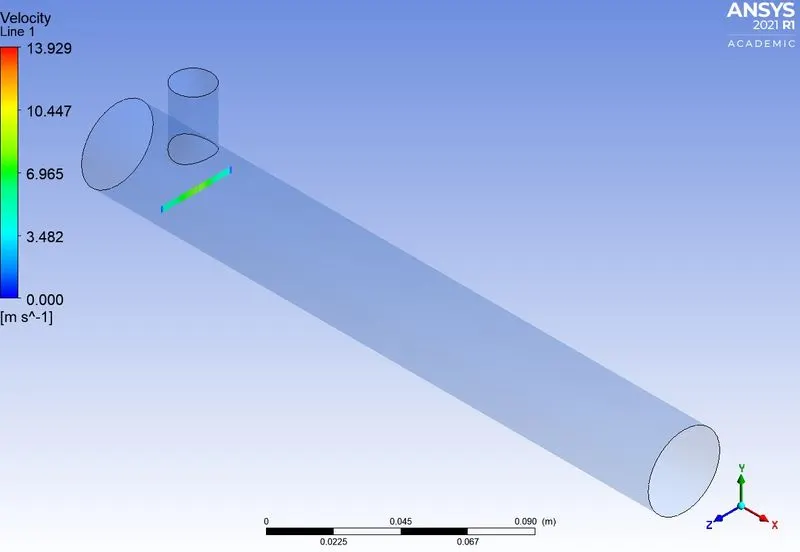
velocity line plots along and across the length:
conclusions:
1. by comparing the long and short mixing tee with momentum ratio 6, the temperature distribution is uneven in the short tee and there is an uniform temperature distribution in the long tee.
2.by comparing the long and short mixing tee with momentum ratio 12, the temperature distribution is uneven in the short tee and there is an uniform temperature distribution in the long tee.
| cell count | average outlet temperature | no of itrations to converge | |
| long mixing tee with with inlet velocity 3m/s and momentum ratio 2 | 56373 | 30.35 | 125 |
| long mixing tee with with inlet velocity 3m/s and momentum ratio 4 | 56373 | 27.5 | 120 |
| long mixing tee with with inlet velocity 3m/s and momentum ratio 2 | 140025 | 30.38 | 180 |
| long mixing tee with with inlet velocity 3m/s and momentum ratio 4 | 140025 | 27.48 | 140 |
| short mixing tee with with inlet velocity 3m/s and momentum ratio 2 | 39817 | 30.25 | 225 |
| short mixing tee with with inlet velocity 3m/s and momentum ratio 4 | 39817 | 27.55 | 110 |
from this we conclude that with increase in cell count, the more accurate temperature will get obtained and with increase in the momentum ratio the outlet temperature gets reduced.