Week 1- Mixing Tee
Objective:
To set up steady-state simulation to compare the mixing effectiveness when hot inlet temperature is 360C & the Cold inlet is at 190C, in the both versions of mixing tee (longer and shorter).
Simulations:
Case-1
a) Short mixing tee with a hot inlet velocity of 3m/s and momentum ratio of 2.
b) Short mixing tee with a hot inlet velocity of 3m/s and momentum ratio of 4.
Case-2
a) Long mixing tee with a hot inlet velocity of 3m/s and momentum ratio of 2.
b) Long mixing tee with a hot inlet velocity of 3m/s and momentum ratio of 4.
where,
Momentum ratio = velocity at cold inlet / velocity at hot inlet.
We will run the case-1 (a) for different values of finite volume element sizes and find the element size at which results are independent of grid size. We also run this case for both k-epsilon and k-omega SST model and find the most suitable one for our simulation.
Case-1:
a) Short mixing tee with a hot inlet velocity of 3m/s and momentum ratio of 2:
Firstly, let us perform the grid independence study, and fix the size of the elements. We will make a table of results, in order to perform grid independence study.
Let us perform this grid independece test with k-epsilon model of turbulence.
Table:
| Sr No | Size of Elements (m) | Final Area Weighted Mean Temperature (K) | Standard Deviation of Temperature |
| 1 | 0.01 | 303.924846 | 0.853815796 |
| 2 | 0.005 | 303.581238 | 1.117225329 |
| 3 | 0.004 | 303.4597325 | 1.676448499 |
| 4 | 0.0035 | 303.4976303 | 1.687627545 |
| 5 | 0.003 | 303.4812947 | 1.678140555 |
| 6 | 0.0025 | 303.4711832 | 1.671604537 |
| 7 | 0.002 | 303.4768684 | 1.670912882 |
The above table shows us that there is no much variation in the results from element size of 0.004. So, we can conclude that, the solution is grid independent beyond that. We will be using the same element size of 0.004 in the furthur analysis.
Now, we will see what is the difference between the k-epsilon and k-omega sst.
These models are used for turbulence modeling because of the need of additional equations for making the problem closed. k- epsilon model predicts well far from the boundaries (wall) and k- omega model predicts well near wall. For our furthur simulations we will be using the k-epsilon turbulent model, because most of the turbulence in our problem is noticed away from the walls of the tube.
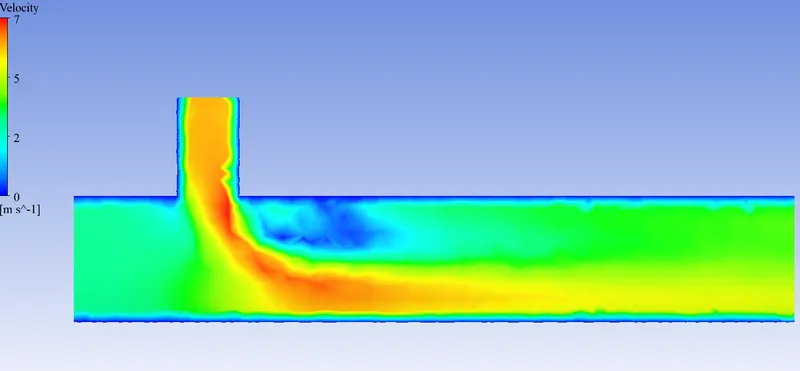
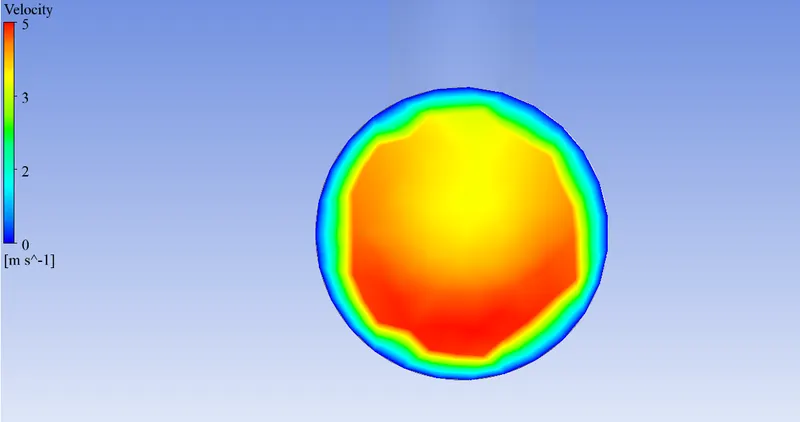
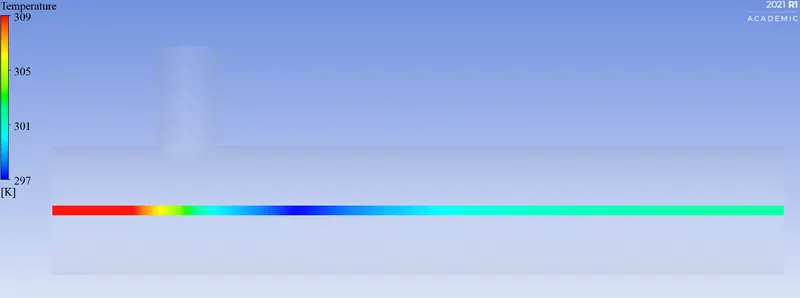
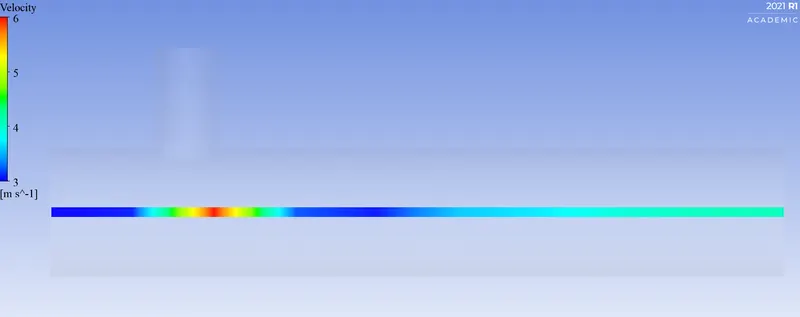
Now, we will simulate the case-1 with momentum ratio of 2.
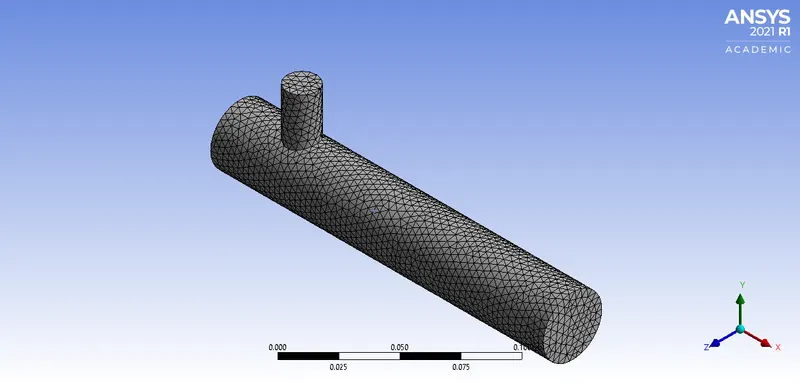
The Mesh looks like:
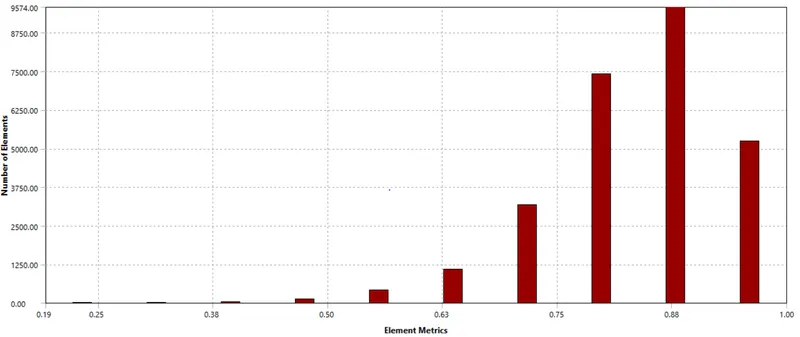
The quality of the mesh:
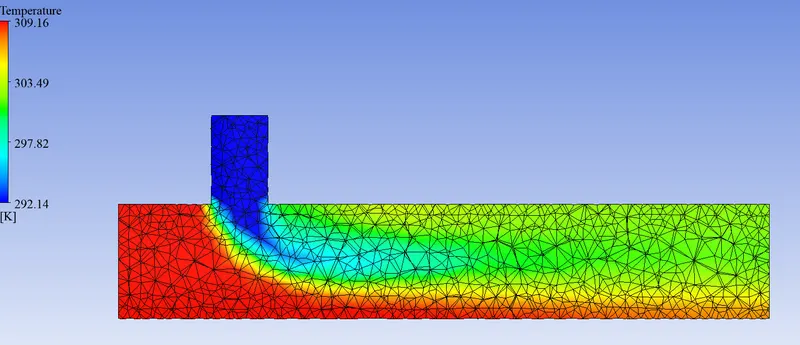
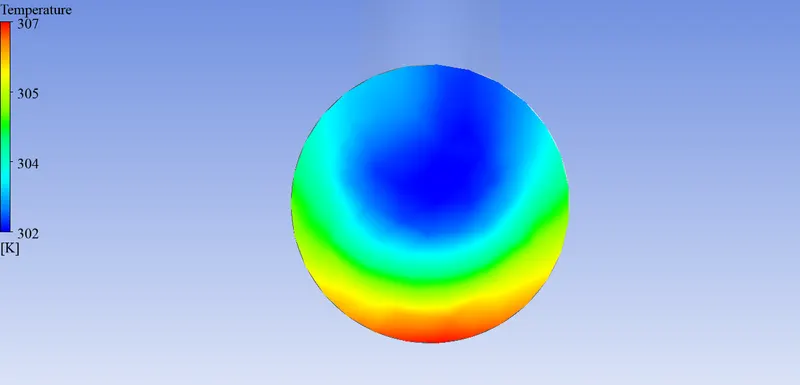
Temperature contour plots on the cut planes along and across the pipe:
Velocity contour plots on the cut planes along and across the pipe:
Temperature and Velocity line plot along the length of the pipe:
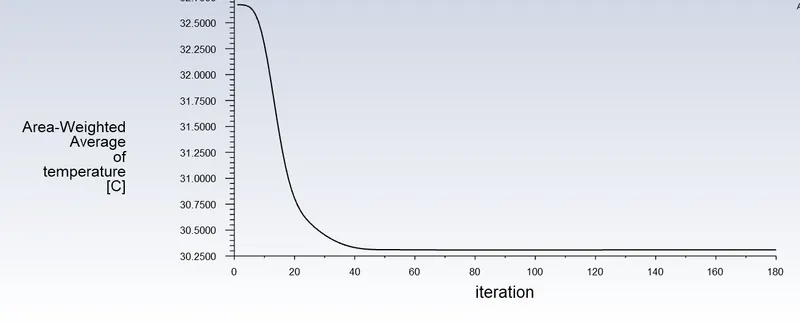
Convergence Plot:
b) Short mixing tee with a hot inlet velocity of 3m/s and momentum ratio of 4:
The Mesh looks like:
The quality of the mesh:
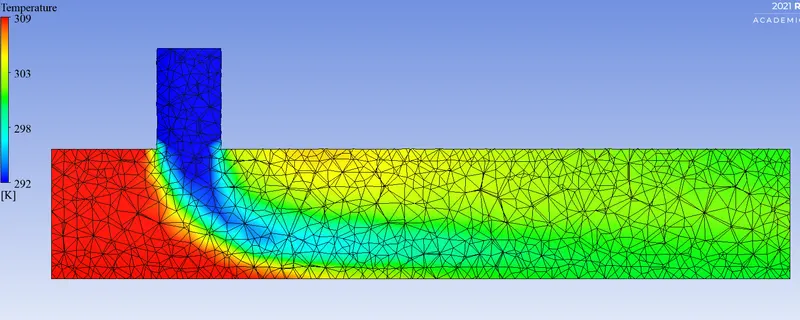
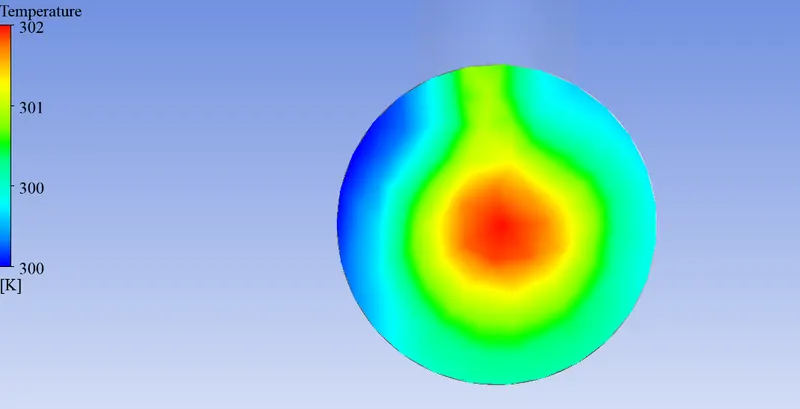
Temperature contour plots on the cut planes along and across the pipe:
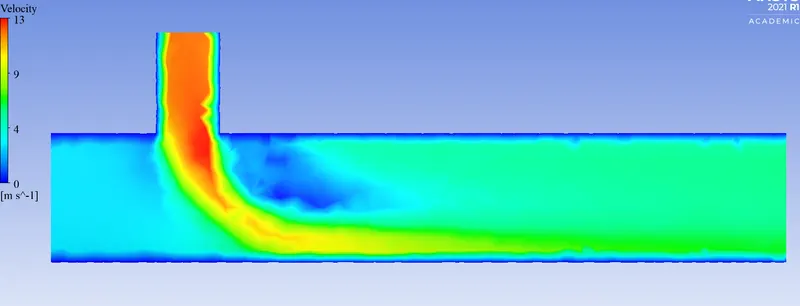
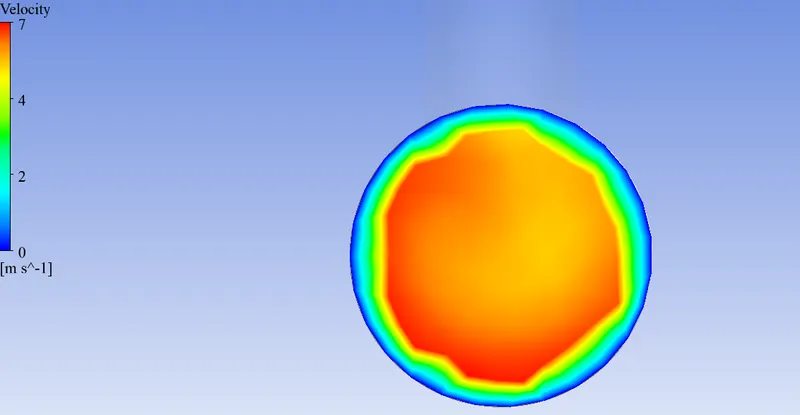
Velocity contour plots on the cut planes along and across the pipe:
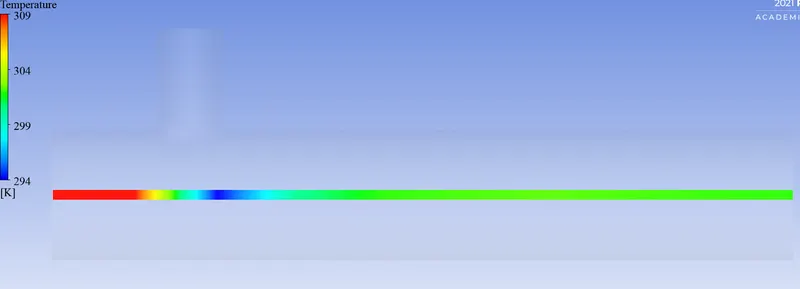
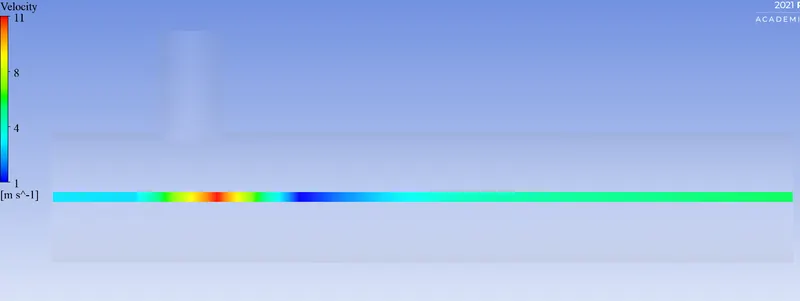
Temperature and Velocity line plot along the length of the pipe:
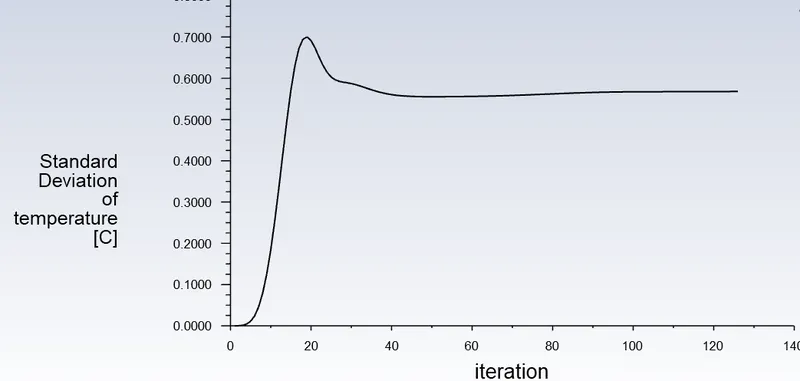
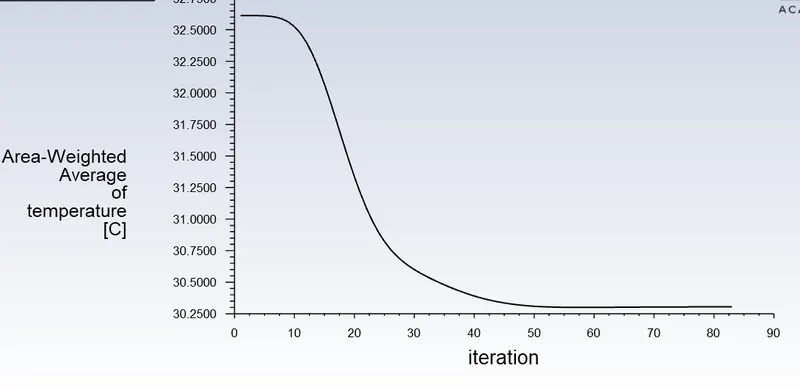
Convergence Plot:
Case-2:
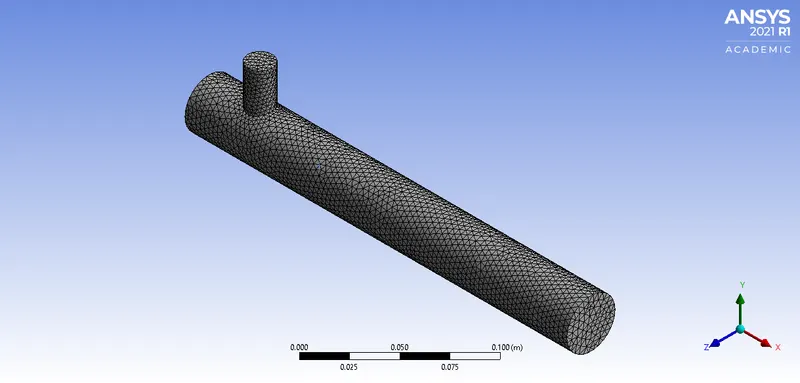
a) Long mixing tee with a hot inlet velocity of 3m/s and momentum ratio of 2:
The Mesh looks like:
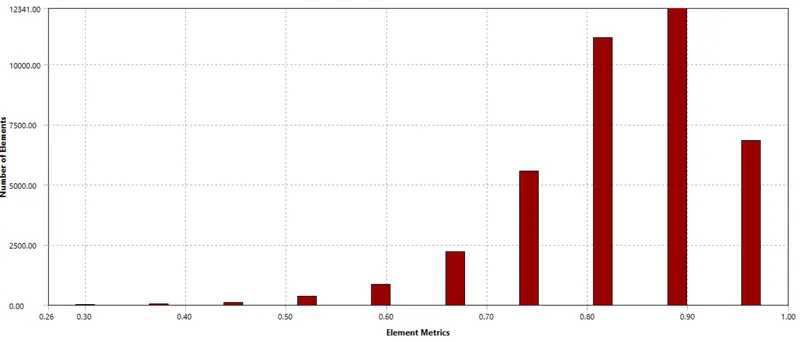
The quality of the mesh:
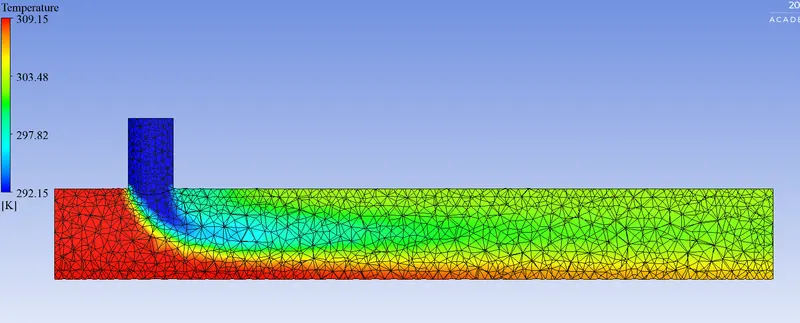
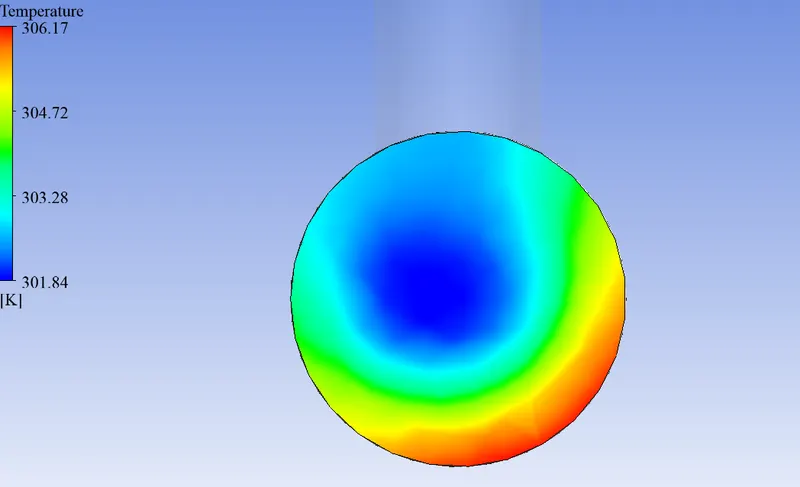
Temperature contour plots on the cut planes along and across the pipe:
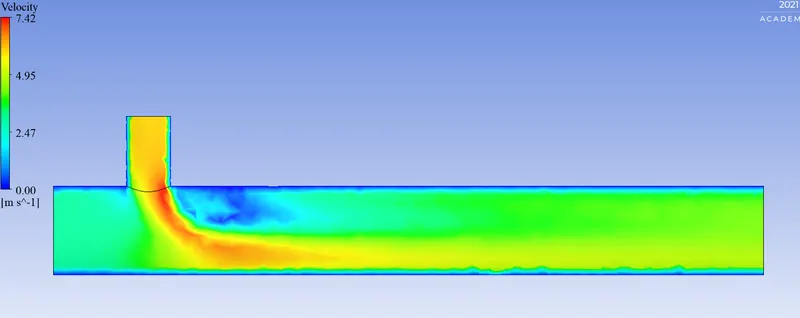
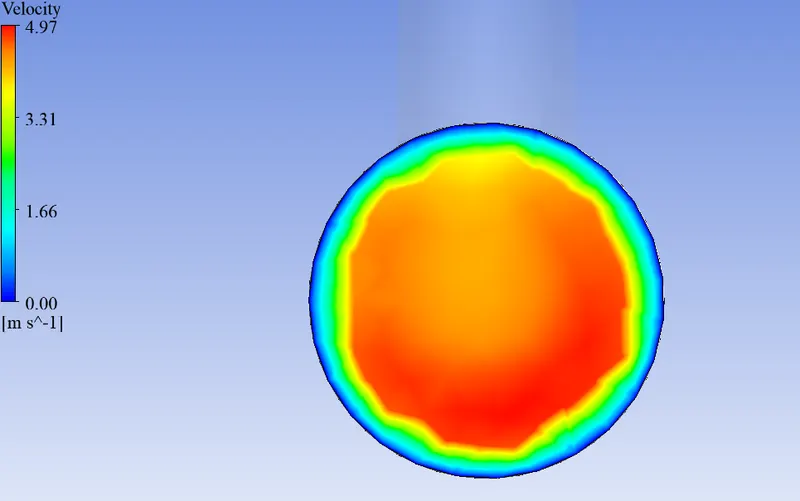
Velocity contour plots on the cut planes along and across the pipe:
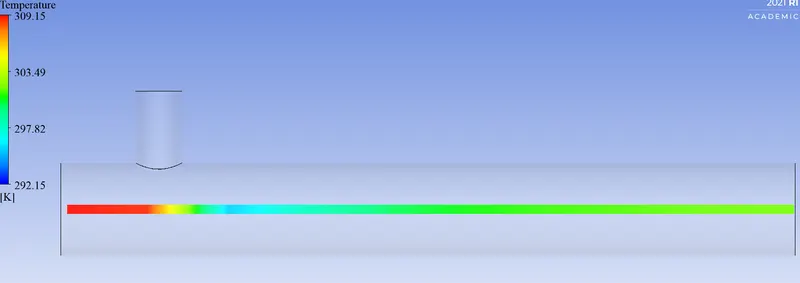
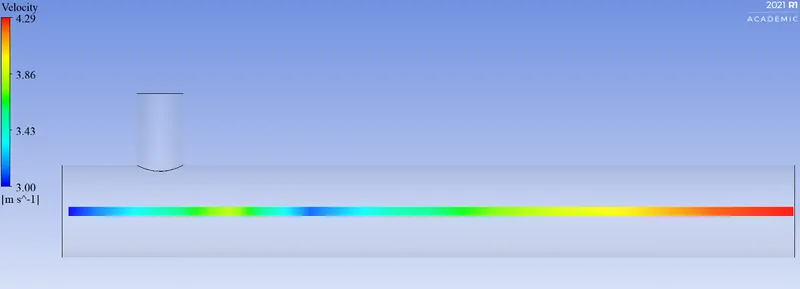
Temperature and Velocity line plot along the length of the pipe:
Convergence Plot:
b) Long mixing tee with a hot inlet velocity of 3m/s and momentum ratio of 4:
The Mesh looks like:
The quality of the mesh:
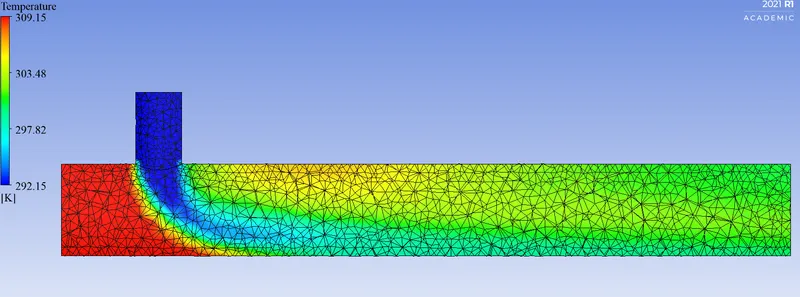
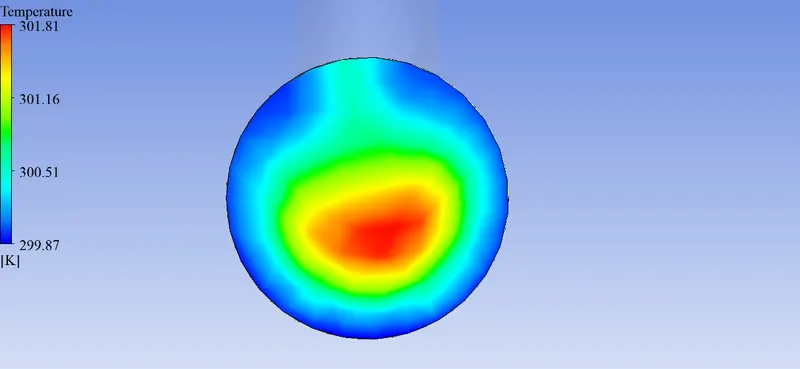
Temperature contour plots on the cut planes along and across the pipe:
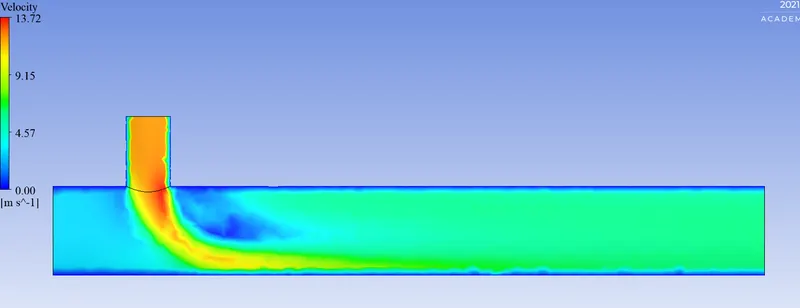
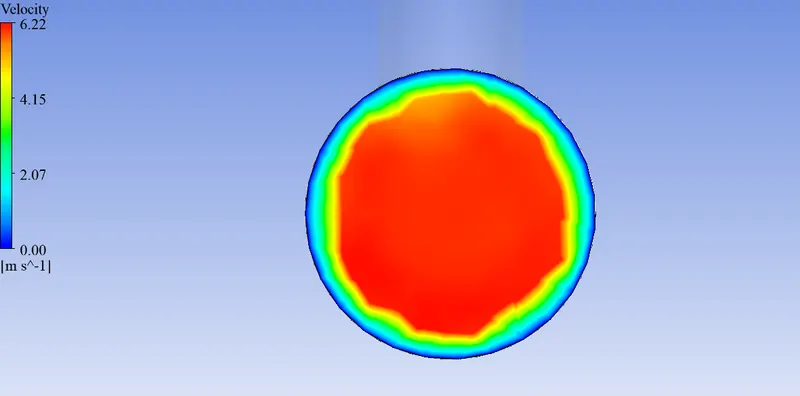
Velocity contour plots on the cut planes along and across the pipe:
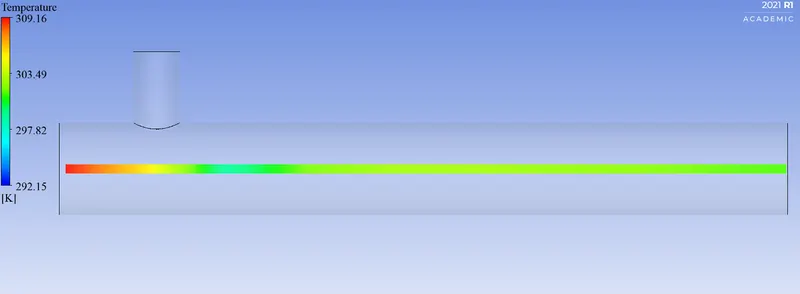
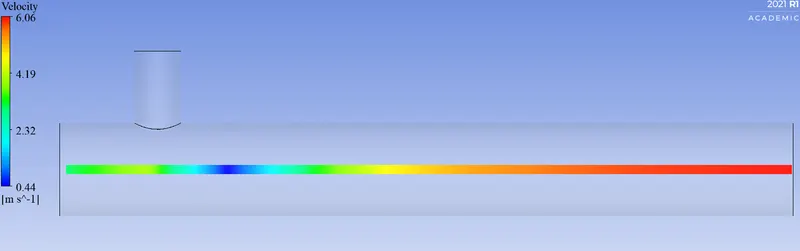
Temperature and Velocity line plot along the length of the pipe:
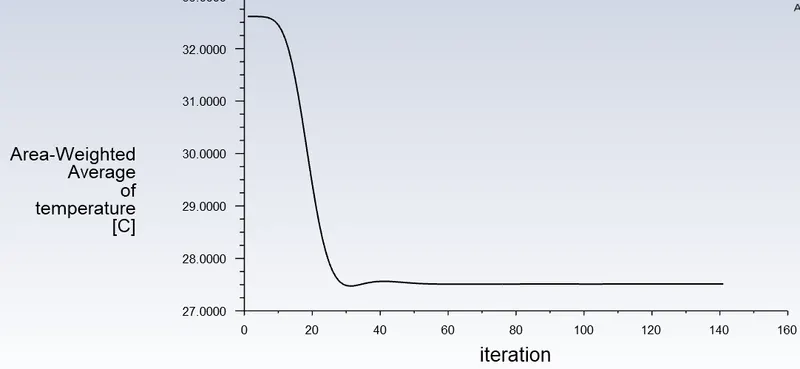
Convergence Plot:
Comparison of cell count, Average outlet temperature and Number of iterations for convergence:
| Case | momentum ratio | Cell Count | Average Outlet Temperature | Number of Iterations for Convergence | Standard Deviation of Temperature |
| a | 2 | 26975 | 303.4597325 | 180 | 1.676448499 |
| 4 | 26975 | 300.7902439 | 126 | 0.568009341 | |
| b | 2 | 39293 | 303.4549825 | 83 | 1.312658681 |
| 4 | 39293 | 300.6616573 | 140 | 0.608717803 |
Effect of length and Momentum ratio on results:
From the above table,
1. Comparing case 'a' and 'b', we can conclude that there not much additional mixing by increasing the length of the pipe.
2. Increasing the momentum ratio has a good effect on mixing. But the average outlet temperature reduces.