To perform a static analysis on two models of plate with holes in solidWorks.
Aim:
To perform a static analysis on two models of plate with holes in solidWorks.
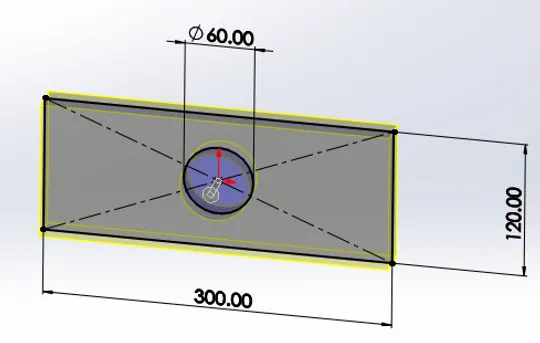
The dimensions for the first case is as follows:
CASE 1
Length=300mm
Height=120mm
Thickness=30mm
Circular Hole at the centre:
Diameter=60mm
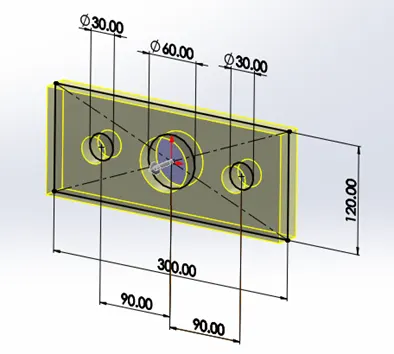
The dimensions for the second case is as follows:
CASE 2
Length=300mm
Height=120mm
Thickness=30mm
Circular Hole at the centre:
Diameter=60mm
Two holes of 30 mm diameter which are placed 90mm away from the central hole on both sides.
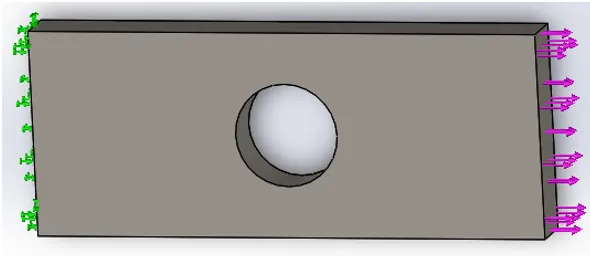
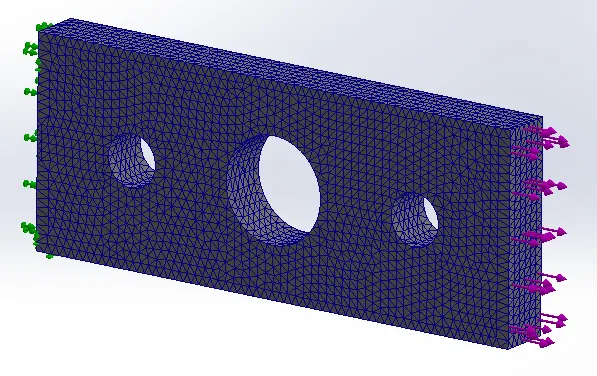
Apply a fixed relation to one of the short sides of the plate and apply a force of 1000N on the other such that the plate is stretched.
Run the analysis and compare the results for stress, strain and displacement
Describe your findings in a detailed report.
Type the report in the space provided below itself. Attach appropriate images and tables to the report.
Introduction:
Stress concentration
Stress concentration is defined as the localisation of high stresses due to the irregularities [resent in the component and abrupt change in cross-section. In order to consider the effect of stress concentration and find our localised stress, stress concentration factor is considered is used. Its is denoted by K, defined as
K = (Highest value of actual stress near discontinuity / Nominal stress obtained by elementary equations for minimum cross-section)
Causes of stress concentration:
- Variation in material properties due to internal crack and flaw like blow holes, cavity in weld, air hole in steel component, non-metallic or foreign inclusion.
- Concentrated load application over a small area e.g., Contact b/w crane hook and chain, contact b/w the cam and the follower etc.
- Abrupt changes in section e.g. In order to mount gears, sprockets, pulley and ball bearing on a transmission shaft, steps cut on the shaft and shoulders are provided for assembly consideration.
- Discontinuity in the components e.g., Oil holes, key ways and spline, screw threads etc.
- Machining Scratches e.g., Stamp marks or inspection mark.
Reduction of Stress Concentration:
Although it is not possible to completely eliminate the effect of stress concentration, there are methods to reduce stress concentrations. This is achieved by providing a specific geometric shape to the component.
In practice, reduction of stress concentration is achieved by the following methods:
- Incorporating additional Notches and Holes in Tension Member.
- Fillet Radius, Undercutting and Notch for Member in Bending
- Drilling Additional Holes for Shaft e.g., for a transmission shaft with a keyway.
- Reduction of Stress Concentration in Threaded Members when a small undercut is taken between the shank and the threaded portion of the component and a fillet radius is provided for this undercut, Also, where the shank diameter is reduced and made equal to the core diameter of the thread.
Von-Misis stress
Von-Misis stress is a single value that incorporates multiple stress orientations into a single value that can be compared against tensile test data. It is based on a failure criterion known as Distortion energy criterion.
Case 1:
Applying Material:
Applying Fixture and Tensile force of 1000N:
Meshing the Body:
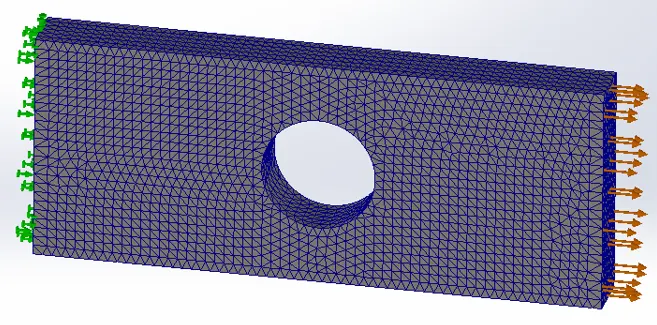
Meshing the body splits it up into lots of little pieces (elements), and the stresses and deformation in each piece can be modelled relatively simply (internally in solidWorks).
Smaller elements (and therefore a large number of them) make the solution more accurate and more able to capture large changes in stress over small lengths. However, smaller elements also cost more computing time and resources.
If the mesh is not set up to be dense enough, it can cause the solution to have inaccuracy.
With a finer mesh, the stress gradient looks smoother.
After creating the mesh solidWorks is ready to run the simulation.
Running the Study:
Now, it is showing the exaggeration of the deformation that the part may experience under that load. So, the deformation that displays by default is amplified relative to how much it really deforms. This helps us verify that the simulation is set up properly.
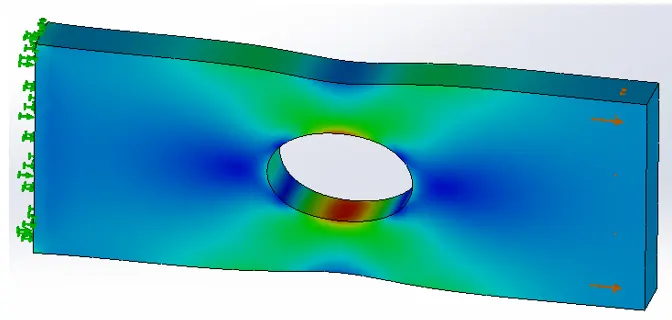
Non-exaggerated view:
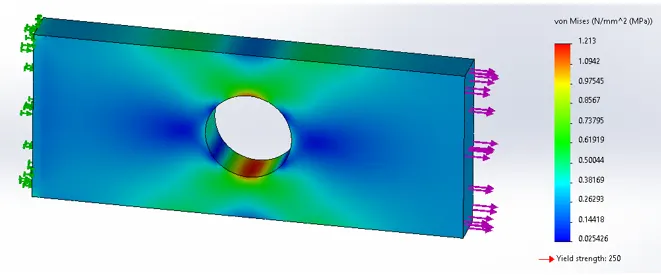
Results:
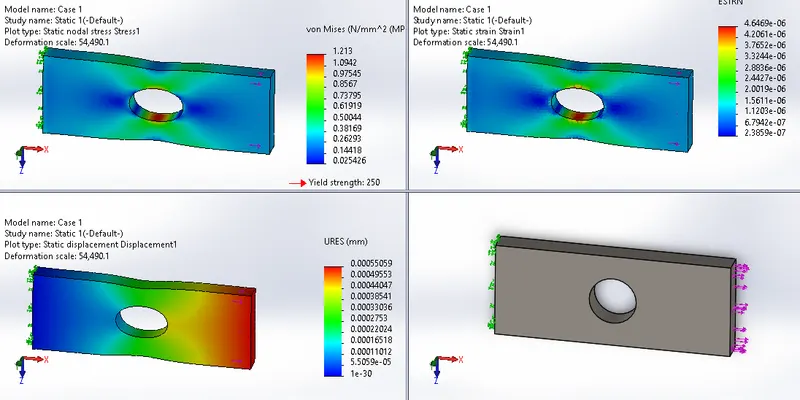
Observations:
- It can be observed from the stress diagram that the green band of colour have concentrated towards the hole. This is due to the fact that the stress lines, come closer where the cross-section is reduced. When there is sudden change in cross-section the stress lines bend.
- Max stress (σ max) can be identified based on the high end of the colour scale. Max Stress according to solidWorks is 213(N/mm^2). It occurs inside the hole (marked by red colour).
- Maximum Stress concentration (σ max) can also be evaluated using charts published in Data books by using stress concentration factors (K). It can be evaluated as:
Tensile stress at hole (σ nominal) = P / (w - d) t, where P = Applied load, w = width of the plate, d = Diameter of the hole and t = thickness of the plate.
σ max = K * σ nominal
K = stress concentration factor
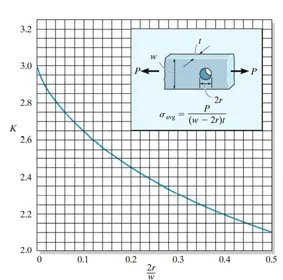
Since, 2r/w = 0.5, K = 2.16
(σ nominal) = P / (w - d) t = 1000 / ((120 - 60) * 30) = 0.556 N/mm^2
σ max = K * σ nominal = 2.16 * 0.556 = 1.20096 N/mm^2.
As it can be seen from above manual calculation and solidWorks calculation for maximum stress concentration are very close.
- Also, the maximum strain value is achieved at the vicinity of the hole.
- From, Displacement diagram we can see the displacement in the rightmost part is more because the displacement of blue, green, yellow and orange region have been added up.
- Since, applied load is less than the critical load and induced stress is also less than the yield strength therefore the component will not fail.
Case 2:
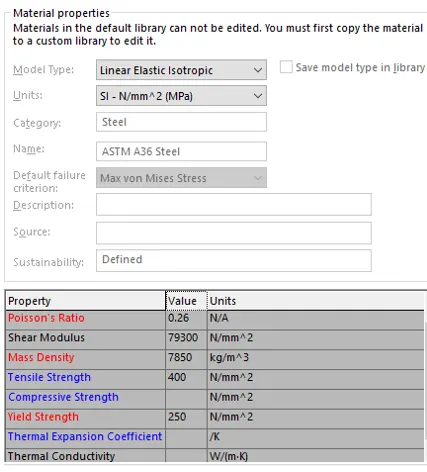
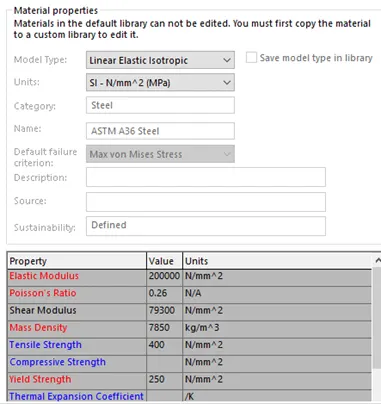
Applying Material:
Applying Fixture, Tensile force of 1000N and meshing the component:
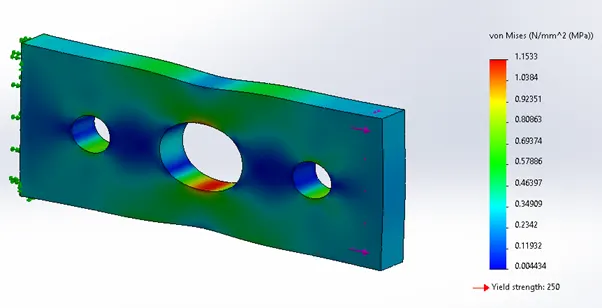
Running the Study:
Non-exaggerated view:
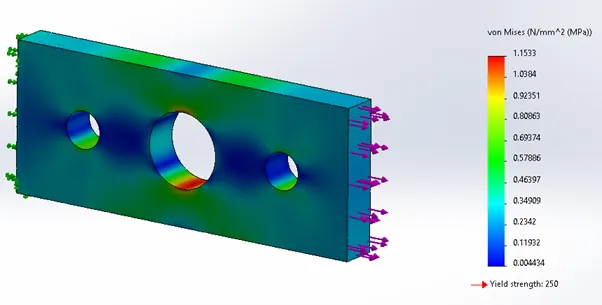
Results:
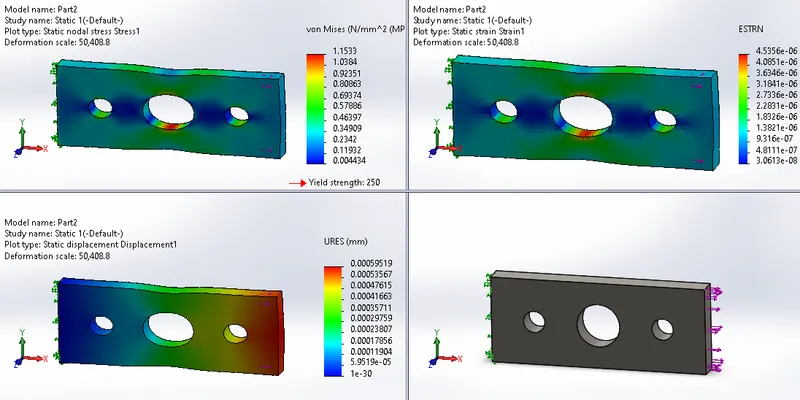
Comparison between the two results:
|
S.no. |
Maximum Stress (N/mm^2) |
Maximum Strain |
Maximum Displacement (mm) |
|
Case 1 |
1.213 |
4.6469 x 10^(-6) |
0.00055059 |
|
Case 2 |
1.153 |
4.5356 x 10^(-6) |
0.00059519 |
- As observed from the data, Maximum Stress in case 1 is greater than that of in case 2. This is because of the redistribution of stress line around the discontinuity (holes) is more in case 2.
- Maximum Strain in both the cases, lies in the inner part of the middle hole. Maximum Strain in case 1 is greater than in case 2.
- The Displacement in case 2 is more than in case 1, because in case 2, the displacement of material under applied stress is present in all three holes.
Note:
A lot of time when we design with ductile materials, we ignore stress concentrations. We don’t care what the max stress is, as long as it is super localise because our presumption is once the part will be in service it will be going to yield a tiny bit right there and that will equalise the stress across the material that is available to hold the load. Hence, we do not care if it yields at that one small spot.
Conclusion:
Rectangular plate in Case 2 is preferable over the one in Case 2. As the Maximum Stress in case 2 is less than that of in the case 1, due to the redistribution of stress line around the discontinuity (holes).
Rectangular plate in Case 2, will also minimize the weight and cost of the component due to less material use.