Structural dynamics
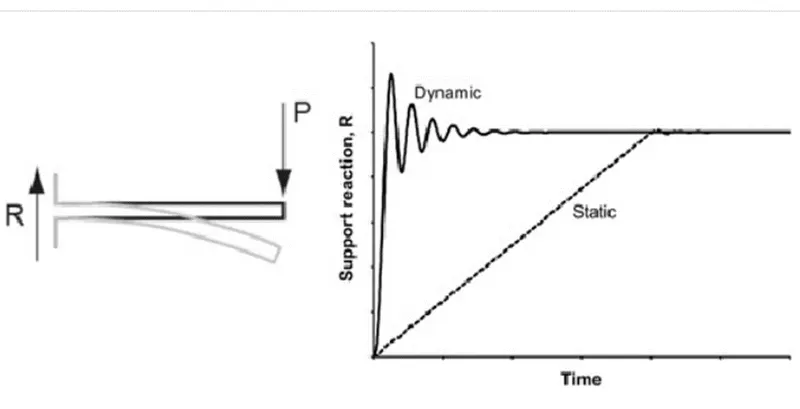
1. The main difference between static and dynamic analysis is TIME If the load is applied so slowly, that inertia effects won’t play a role, all you need is static analysis. Dynamic analysis handles impacts and other FAST happening situations, but also vibrations.
Static Analysis: Static analysis of structures considers static loads acting on the structure such as dead,live load which does not vary with time and are not considered to be sudden.
Dynamic Analysis: Dynamic analysis of structures considers dynamic loads acting on the structure such as wind,earthquake which varies with time. These loads are sudden and does not follow a constant pattern and vary with time.

2.
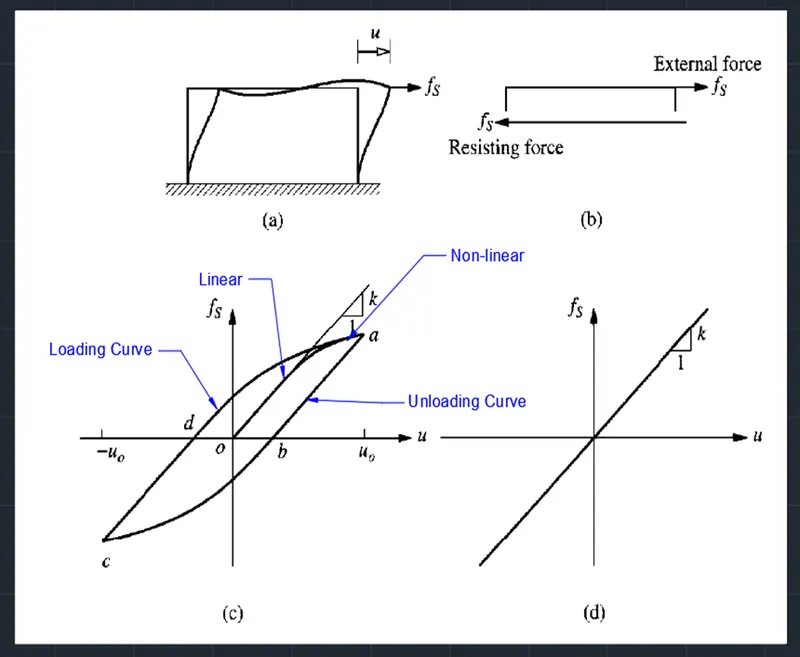
a. Elastic behavior - The ability of a deformed material body to return to its original shape and size when the forces causing the deformation are removed. A body with this ability is said to behave (or respond) elastically. From the force-displacement graph at point O to a certain point, it shows a linear path, hence the body shows elastic properties at a certain limit with the forces applied.
b.Inelastic behavior - The deformation of a material that does not disappear on the removal of the force that produces it. From the force-displacement graph, inelastic behavior corresponds to the nonlinear path. Inelasticity is experienced by the body as soon as the path goes out of the linear curve.
c.Plastic behavior - The behavior of plastic structures beyond the bending collapse load is influenced by the changes in the geometry of a structure during the process of plastic deformation. In the present paper, an investigation of the load-deflection relationship for simply supported rectangular reinforced concrete plates is presented
d.Non-linear Inelastic behavior - Materials have elastic behavior usually only up to a certain load, which is called the ‘yield point’. After that, the deformations are plastic. From the force-displacement graph, this behavior occurs when the line from point “O” tends to bend to point “a”.
Below graph represents the behaviour of all four mentioned and obtained from loading
3. The Single Degree of Freedom System is a combination of 3 pure independent systems such as the stiffness, the damping, and the mass component.
- Mass Component: The roof mass without the stiffness or damping of the frame. The external force fi on the mass component is related to the acceleration by fi = mű
- Stiffness Component: The frame without damping or mass. The external force fs on the stiffness component is related to displacement u by fs = Ku
- Damping Component: the frame with its damping property with no stiffness or mass. The external force on the damping component is related to velocity by FD = ců
Hence, the equation is mű + fd + fs = p(t) i.e., p(t) = mű + ců+ ku where p(t) is external force
4.
Natural period: The time taken for undamped system to complete one cycle of free vibration is called as the natural period of vibration and it is denoted by the formula Tn = 2π/ωn and the unit is seconds.
Natural frequency: The natural frequency is defined as the number of cycles i.e, one full cycle of free vibration completed in one second and it is denoted by the formula f=1/Tn It is denoted in radians/sec.
The relation between natural period and natural frequency is that frequency is inversely propotional to the period of vibration fn=1/Tn.
5. Response spectrum: It is a concept of characterizing the ground motion and their effects on structures of different time period Tn. A plot of the peak value of a response activity (u,v,a) as a function of natural vibration period Tn of the system is called the response spectra.
- The peak response of all linear single degree of freedom systems can be computed by response spectra plot.
- Three types of plot are generally plotted with u and Tn as deformation response spectra and a similar plot is done with u* as relative velocity spectrum and with u** as acceleration response spectrum.
- Each plot is done with fixed damping ratio and several such plots with different damping ratio are created for the range of damping values encountered in the structures.
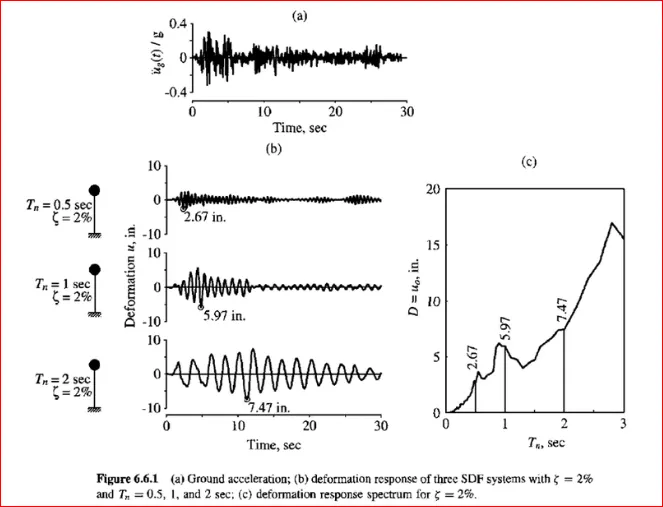
The above image contains the plot with deformation with respect to time time.
- The 1st plot (a) represents the ground acceleration recorded during a earthquake.
- The second plot (b) represents the plots of deformation respone of three independent SDF systems. In each plots of b has been done with fixed damping ratio as 2% and variation in natural time period as 0.5s,1s,2s and the corresponding deformations are obtained with respect to time.
- The third plot (c) represents the recorded dimensions and Tn is done to record the peak responses.
So based on the time period of vibration the deformation of the system can be obtained which can be multiplied with stiffness to obtain equivalent static force which can be further used for the analysis of the structure.