Structural dynamics
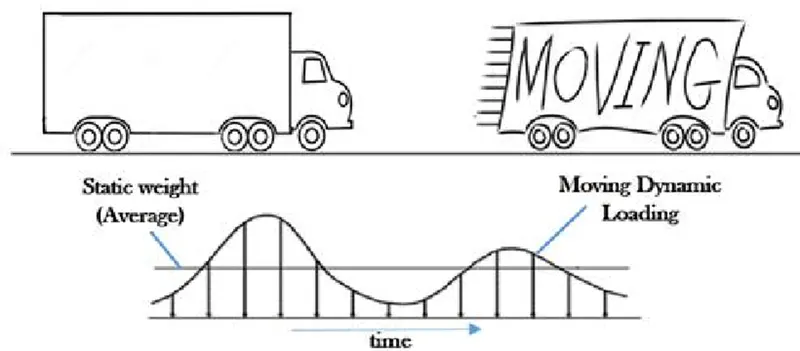
- Differentiate Static analysis and Dynamic analysis with proper representing pictures
Static Analysis
- In Static analysis, the structure is subjected to static loading which is a constant load with respect to time.
- Motion of the structure can be disregarded in static analysis
- Used to calculate stress, strain, and deformation under constant loads
- Generally faster and simpler than dynamic analysis
- May not be as accurate for problems involving time or frequency
- The displacement obtained by static analysis is more.
- Study of static load help determine the maximum allowable load to be applied to the structure
Dynamic Analysis
- In Dynamic analysis, the structure is subjected to dynamic loading which is any load whose magnitude, direction and position vary with respect to time.
- The inertial loads developed by the system due to acceleration are taken into account.
- Used to calculate stress, strain, and deformation under time-varying loads
- More accurate than static analysis for problems involving time or frequency
- May be more complicated and take longer to run
- The displacement obtained by dynamic analysis is less.
- Study of dynamic load help determine the stresses at the different points of the structure due to changing conditions over time.
- Explain the following with relevant force-displacement graph
- Elastic behavior
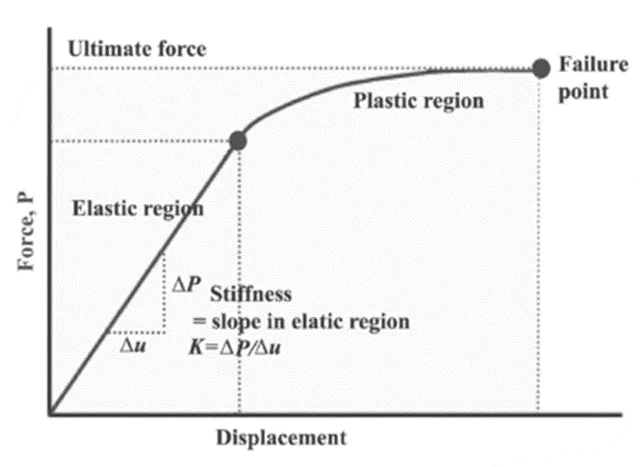
Elastic behavior is the ability of the material to return to its original shape and size when force causing the deformation are removed. From the force-displacement graph in elastic region, it shows a linear path, hence the body shows elastic properties up to a certain limit with the forces applied.
- Inelastic behavior
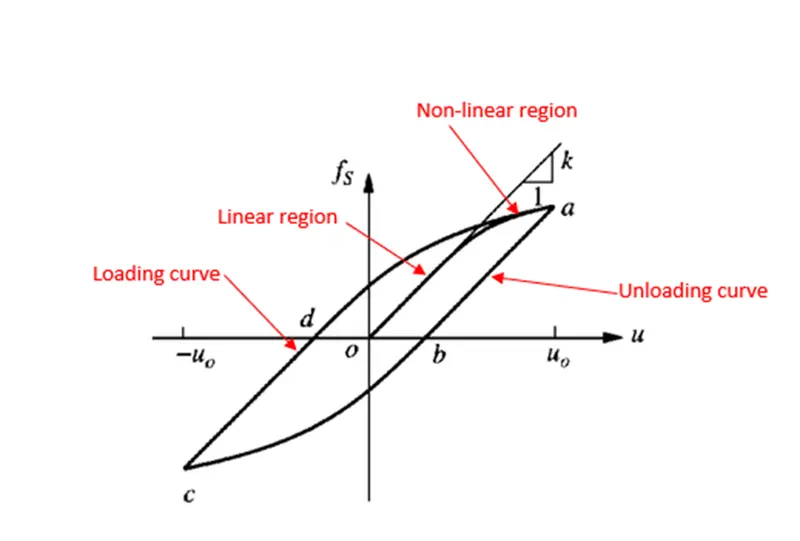
Inelastic behavior is the property of the material when the material can't retain its previous shape after a certain deformation. From the above force-displacement graph, inelastic behavior corresponds to the nonlinear path. Inelasticity is experienced by the body as soon as the path going out of the linear curve.
- Plastic behavior
For load beyond the elastic limit, a material exhibits plastic behavior. This means the material deforms irreversibly and does not return to its original shape and size, even when the load is removed. When stress is gradually increased beyond the elastic limit, the material undergoes plastic deformation. From the force-displacement graph, plastic behavior is shown in plastic region
- Non-linear Inelastic behavior
Materials have elastic behavior only up to a certain load, which is called the Yield point. After that, the deformations are plastic. From the above force-displacement graph, inelastic behavior corresponds to the nonlinear path. Inelasticity is experienced by the body as soon as the path going out of the linear curve.
- Explain Mass, Stiffness & Damping components in the equation of motion
The Single Degree of Freedom System is a combination of 3 pure independent systems such as the stiffness, the damping, and the mass component.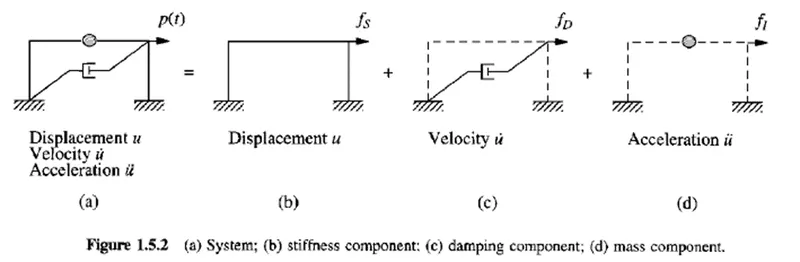
Stiffness Component – the frame without damping or mass. The external force fs on the stiffness component is related to displacement u by fs = ku if the system is linearly elastic.
Damping Component – the frame with its damping property with no stiffness or mass. The external force on the damping component is related to velocity by fd = cu’
where fd is the damping force, c is the viscous damping coefficient and ů is the velocity.
Mass Component – the roof mass without the stiffness or damping of the frame. The external force fi on the mass component is related to the acceleration by fi=mu”
fi + fd + fs = p(t)
mu” + cu’ + ku = p(t)
The external force p(t) is applied to the complete system. They may therefore visualize among the 3 components of the structure. That is inertial, stiffness and damping force.
- Provide relationship between Natural period (Tn) & Natural frequency (f) and provide their definitions
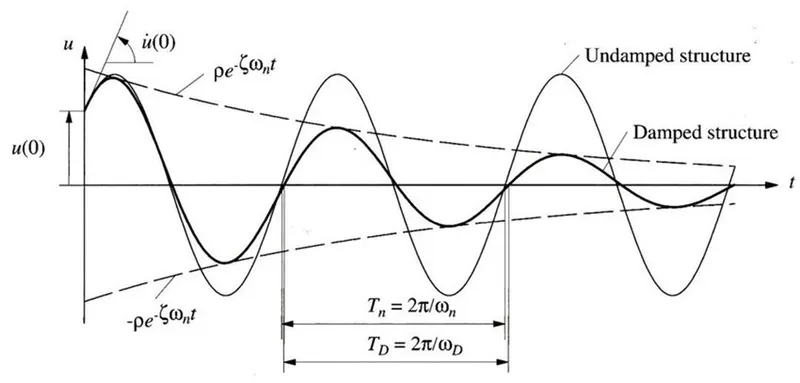
Natural period (Tn)
The time required to complete one cycle of vibration (unit is seconds). It is related to the natural circular frequency of vibration, ωn, in units of radian per second.
Tn = 2π/ωn
Natural frequency (f)
Natural frequency is the frequency of a body under free vibration. It is number of cycles per unit time. The unit of frequency is hertz.
fn=1/Tn
- Explain in detail about Response spectrum & its Graph
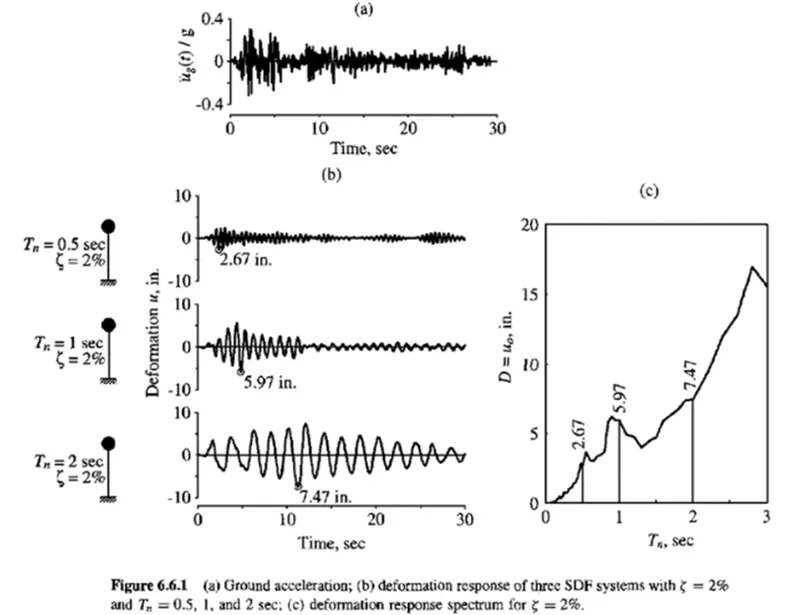
A response spectrum is a graphical plot of the frequency of an oscillator and its damping. The response spectrum plot represents the peak or steady-state response (velocity, displacement, or acceleration) of a series of oscillators of varying natural frequency. In vibration analysis of any system, the response spectrum is very useful as the resulting plot can provide the response of any linear system with respect to its natural frequency. The response spectrum finds its usage in interpreting seismic or earthquake events and slug flow events.
Response Spectrum Analysis is a scientific method for estimating the structural response of dynamic vibration events. To perform the response spectrum analysis, the first job is to define the response spectrum of the system.
- A response spectrum is a function of frequency or period, showing the peak response of a simple harmonic oscillator that is subjected to a transient event. The response spectrum is a function of the natural frequency of the oscillator and of its damping. Thus, it is not a direct representation of the frequency content of the excitation (as in a Fourier transform), but rather of the effect that the signal has on a postulated system with a single degree of freedom (SDOF).
- Response spectrum analysis is a method to estimate the structural response to short, nondeterministic, transient dynamic events. Examples of such events are earthquakes and shocks. Since the exact time history of the load is not known, it is difficult to perform a time-dependent analysis. Due to the short length of the event, it cannot be considered as an ergodic ("stationary") process, so a random response approach is not applicable either.
- The response spectrum method is based on a special type of mode superposition. The idea is to provide an input that gives a limit to how much an eigenmode having a certain natural frequency and damping can be excited by an event of this type.
The equation of motion for the mass can, if there are no external forces, be written as
Dividing by the mass, and using customary notation,
Here, the undamped natural (angular) frequency is
and the damping ratio is
For given values of ,
,  , and
, and  , this equation can be solved for a sufficiently long time. The displacement, velocity, and acceleration response spectra are defined as the maximum values caused by the acceleration history .