Steady Vs Unsteady flow over a cylinder
STEADY VS UNSTEADY FLOW OVER CYLINDER
- AIM -
Simulation of flow over cylinder and explanation of vortex Karman street by solving various conditions.
- EXECUTIVE SUMMARY -
Theodore Von Karmann a Hungarian-American mathematacian, who was active primarily in field of aerodynamics and astrodynamics. He discovers that if spacing ratio is equal to 0.281 then the vortex street is going to be stable. Spacing ration is the ratio of distance between the center of the two inline row vortices to the distance between center of vortices moving in another row.
A bluff body as a result of its shape has seprated flow over as substantial part of its surface. An important feature of a bluff body flow is that there is a very strong interaction between the visous and viscid regions. Each bluff body has a particular strouhal number depending on characteristics of flow seperation.
In our case, if the diameter of a circular cylinder is increased keeping the velocity constant, the vortex shedding frequency will decreases. Similarly, an increase in velocity will increase in vortex shedding frequency and vice versa. In this study keeping the geometry constant and the Reynold number is changes by changing velocity and also monitoring by changing solver methods. The strouhal number is calculated in the unsteady solver method and reynold number is keep on changing by changing the velocity by keeping the gometry and other fluid property constants.
- INTRODUCTION -
The vortex Karman street is a repeating pattern generated due to a pattern of swirling vortices caused by a process known as vortex shedding, which is responsible for the unsteady separation of fluid around bodies. The beauty of vortex shedding is one can use it in both detrimental and favorable ways. In fluid dynamics, the vortex creation and its shedding have equal importance to understand the phenomenon to implement in real practice. The study focuses on demonstrate simulation on the cylindrical bluff body to visualize the vortex shedding in different conditions. Majorly the variation in result, strouhal number, drag, lift, and plots of the vortex are visualized and analyzed by varying Reynolds number.
The simulation of flow over cylinder performed in two parts. In first,
- Simulate the flow over a cylinder in the steady and unsteady case and find strouhal number for Re = 100.
In the second part -
- Calculating drag and lift for different Reynolds number of 10, 100, 1000, 10000, and 100000 for the steady-state solver.
- From this result in the discussion on the effect of Reynolds number on the result of the coefficient of drag.
Vortex has the low pressure in the center. Trapped vortices result in a steady flow and free vortices make the flow unsteady. Vortex pattern can be seen in clouds, bird formation, and most importantly vortex flow pattern over the delta-V(which is the triangular rear of a fighter jet). When a jet moves at a certain angle of attack the lower surface of wing faces flow the vortices are formed under it. Since at center of the vortices is low pressure, now the vortex is forming the upper surface of the wing which creates additional lift.
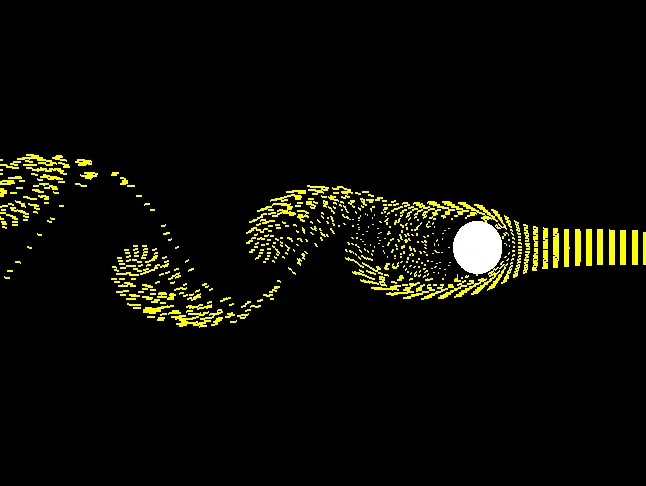
The study performed to understand von Karman street shedding the way it affects real-life problems and the nature of vortex shedding in different situations. The purpose is to understand the factors that affect the nature of vorticity and on which it depends. This study specifically focused on the various plots of results and the comparison study between steady and unsteady solver.
- THEORY AND METHODOLOGY -
Vortex shedding is caused when fluid hits structure or geometry then forming alternating vortices in a continuous repetition manner at a particular frequency. Now the vortex is a region in which the flow revolves around an axis line. In general, it is represented as twice the angular rotation(`w`). The velocity of the fluid is very affecting the vortex shedding. Vortex shedding is a phenomenon, when the fluid moves across a structural member, vortices are shed alternately from one side to another, and where alternating low-pressure zones are generated on the downwind side of the structure giving rise to fluctuating forces acting at a right angle to flow direction.
The nature of the vortex is like two sets of vectors working in the opposite manner to create a vortex such that in the direction it moving upward is called upwash and another side is moving downward. Any object comes in an upwash region that has the natural lift(The manner in which birds fly in the group).
A steady flow means the flow in which all condition remains constant at any point over the domain with respect to time the quantity of liquid flowing per second at any part of the control volume is constant, this definition is for the ideal case. In turbulent flow, the constant fluctuation is always present so to achieve steady-state means to produce the rate of change of velocity and pressure remains equal on both sides of the average value. An unsteady flow is a flow in which a quantity of liquid flowing per second is not constant. Unsteady flow is a transient phenomenon. Unsteady flow may also include periodic motion such as that of waves of beaches. The difference between mean steady deviation and unsteady flow is that there is so much deviation from the mean.
- In first place comparison between to steady and unsteady cases at Re = 100. In this case the strouhal number plays important role because number represents a major of the ratio of inertial forces due to unsteadiness of flow or due to local acceleration to inertial forces due to change in velocity from one point to other in flow field. The strouhal number is dimensionless number useful for analyzing oscillating unsteady fluid flow dynamics problem.
`St = (omega*l)/v`
Where,
St = Strouhal number
`omega` = oscillation frequency
l = characteristics length
v = flow velocity
- In this study, the data is generated and comparison made on the basis of changes in reynold number. The variation in the results closely observer in this cases. For such instance the geometry and fluid property remain constant only thing that changes is inlet velocity. For this purpose we have to change reynold number as per mention in following table.
Reynold number
`Re = (rho*v*d)/mu`
`rho = fluid density`
`mu = fluid dynamic viscosity`
V = inlet velocity
D = Diameter of cylinder
Table no. 1 Reynold number calculations
| CASE NO. | FLUID DENSITY (`rho`) (kg/m^3) | FLUID DYNAMIC VISCOSITY (`mu`) | DIAMETER OF CYLINDER (D) (m) |
INLET VELOCITY (V) (m/s) |
| I | 1 | 0.05 | 2 | 0.25 |
| II | 1 | 0.05 | 2 | 2.5 |
| III | 1 | 0.05 | 2 | 25 |
| IV | 1 | 0.05 | 2 | 250 |
| V | 1 | 0.05 | 2 | 2500 |
- Geometry details and mesh description -
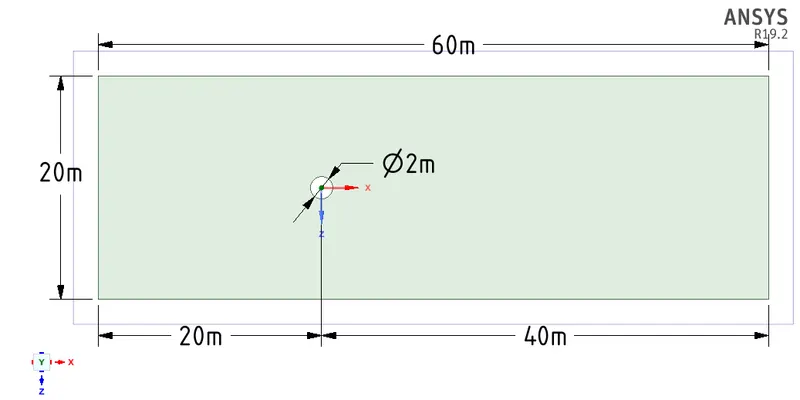
Fig No. 1 Geometry details
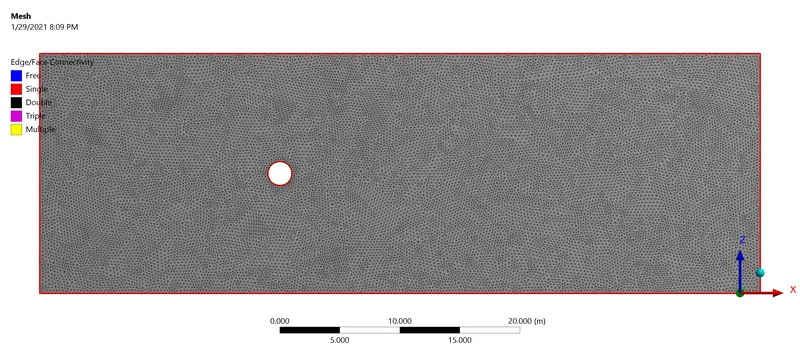
Fig no. 2 Mesh
Table No. 2 Mesh details
| Mesh details | Parameters |
| Physics preference | CFD |
| Solver preference | fluent |
| Element Size | 0.25 m |
| Growth Rate | 1.2 |
| Mesh Methods | All Triangles |
| Edge Sizing | |
| No. Of divisions | 36 |
| Inflation Layer | |
| Inflation option | first layer thickness |
| first layer height | 5 e-3m |
| Maximum layer | 6 |
| Growth Rate | 1.2 |
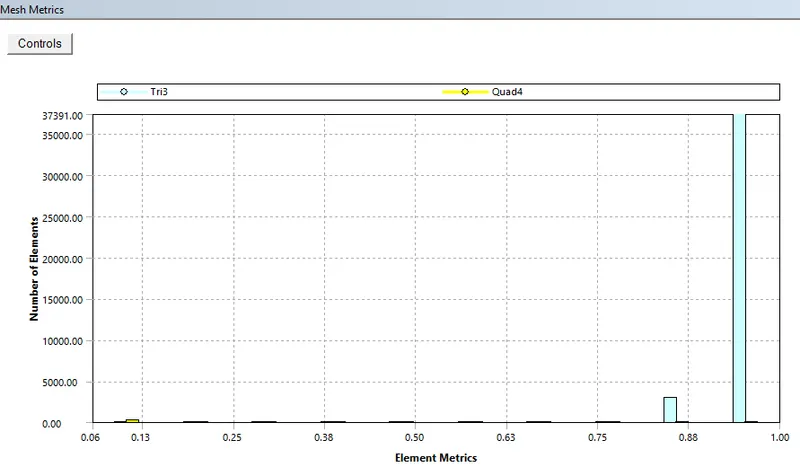
Fig No. 3 Mesh metrics
- Material Properties -
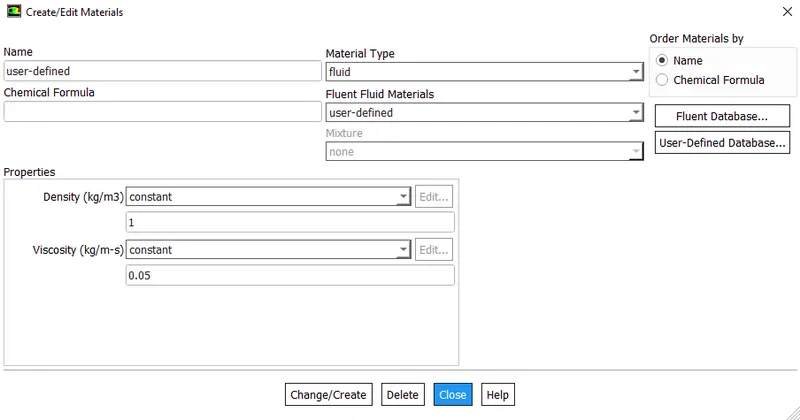
Fig No. 4 Material properties
- BOUNDARY CONDITIONS -
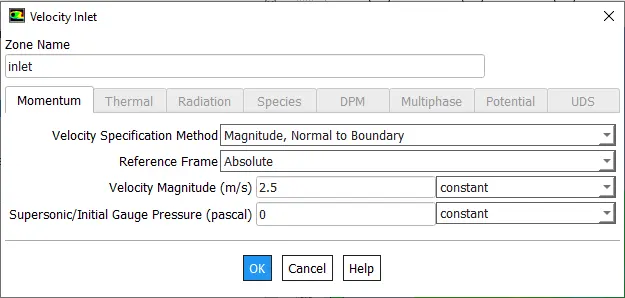
Fig No. 5 Inlet Boundary condition
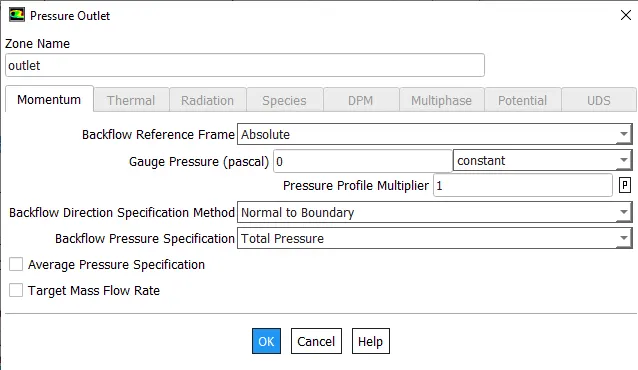
Fig No. 6 Outlet Boundary Condition
- RESULTS AND DISCUSSION -
- PART I - Simulation of flow over a cylinder in the steady and unsteady case for Re = 100.
- STEADY STATE CASE -
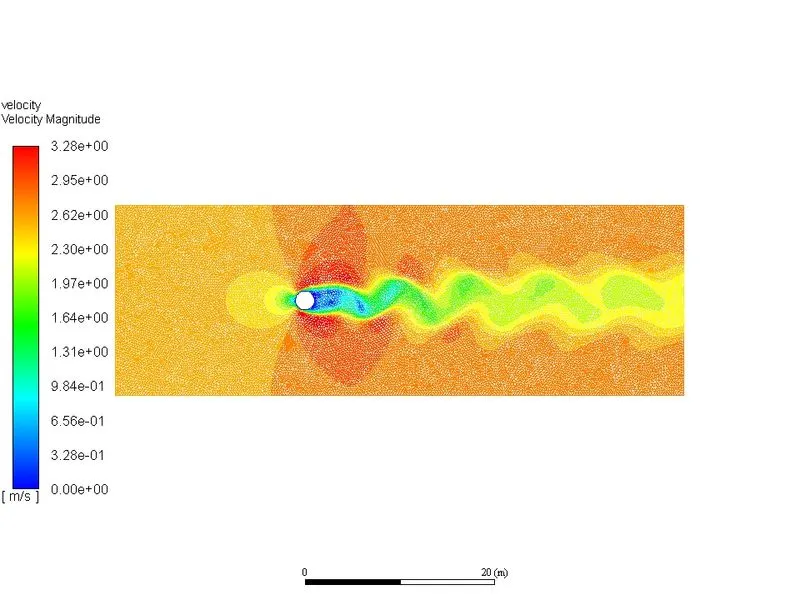
Fig No. 7 Velocity Contour
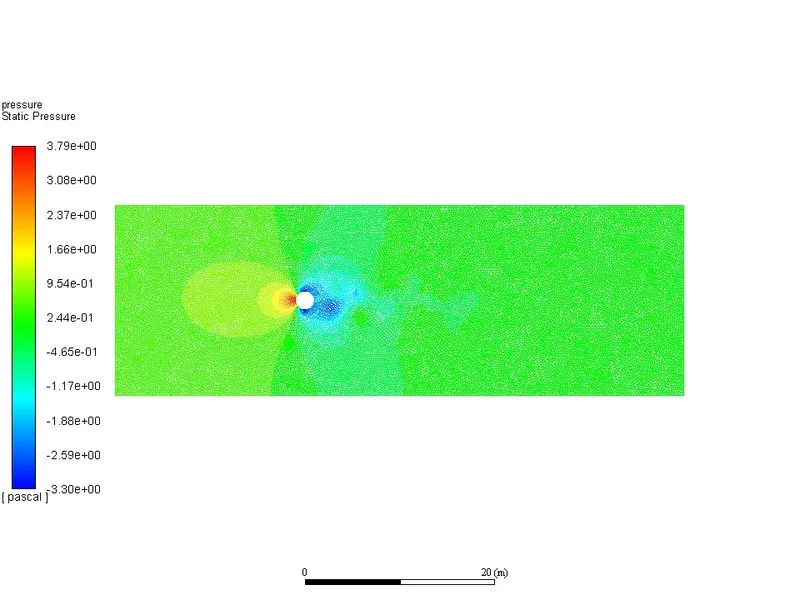
Fig No. 8 Pressure contour
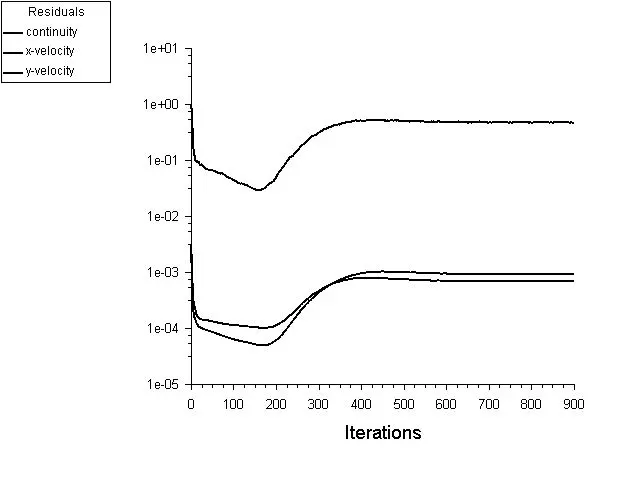
Fig No. 9 Residual Plot
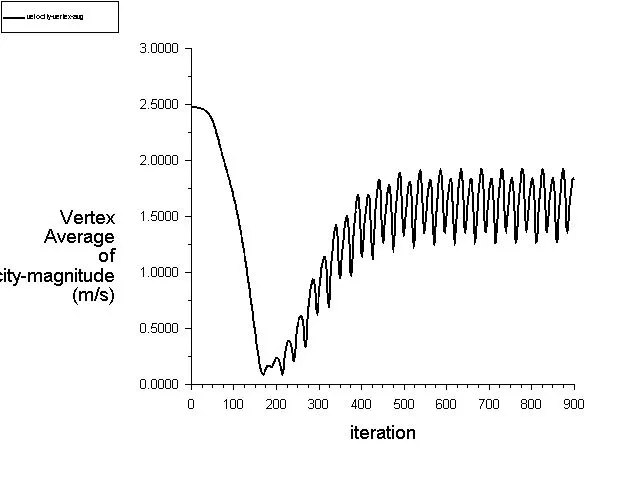
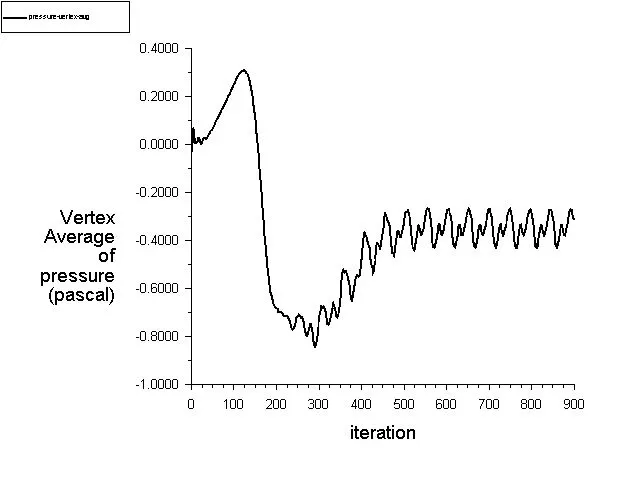
Fig no. 10 Velocity Vertex average Fig No. 11 Pressure Vertex Average
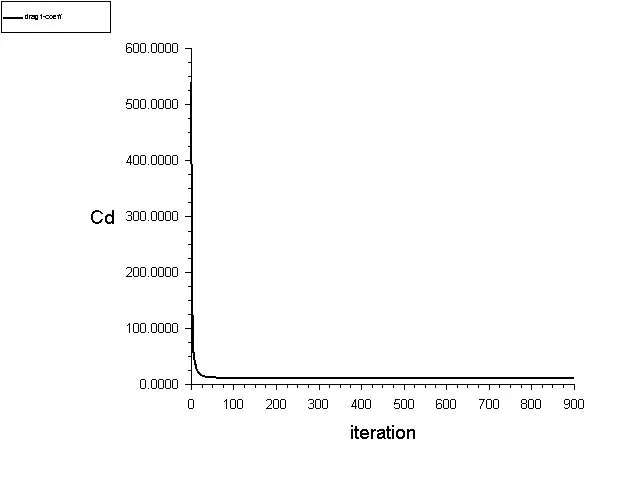
Fig No. 12 Drag Coefficient
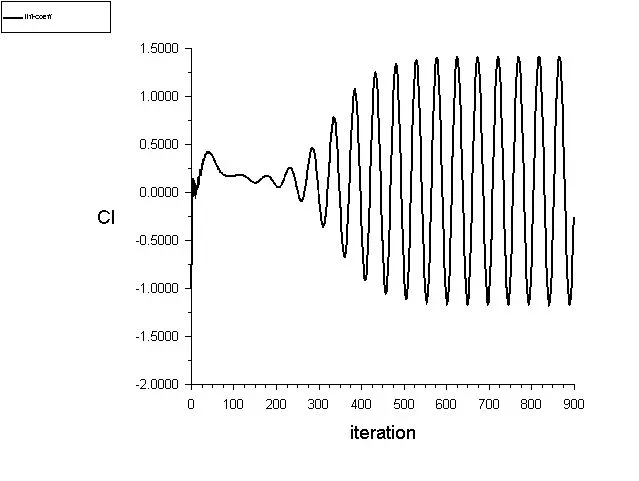
Fig No. 13 Lift Coefficient
In this case not able to find the strouhal number because the graph of coefficient of lift is is not with respect to time scale instead it is with iteration. Thats the reason we cannot compare it with time and hence not able to find strouhal number.
- UNSTEADY CASE -
Shear layers seprates from bluff body now since they have vorticity they have tendency to curl up to form vortex. The pressure at center starts to fall in the vortex, the moment the pressure starts to drop it acts like sink from all around. No flow can cross the streamline, so opposite side shear layer gets sucked in into the previous vortex and this vorticity from opposite end in reverse directio so this vortex dilute the strength of cancellation effect. This will cut the vortex and start to flow with the mainstream flow but at slightly smaller velocity. Depending on the velocity of vortex if it is high then drag of body is low, if velocity is high then drag experienced by body is high.
This vortex becomming free and its shedding can be easily visualized in above animation of pathlines. This theory proposed by the Gerrard.
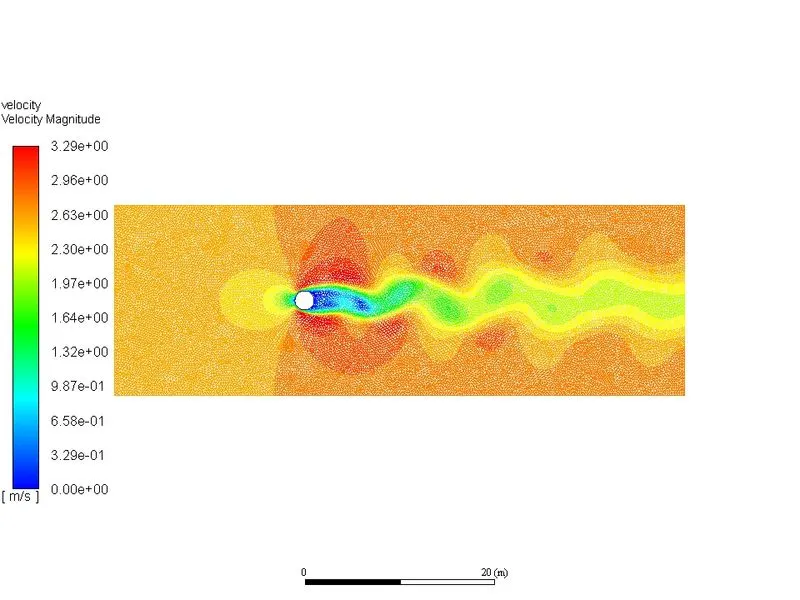
Fig No. 14 Velocity Contour
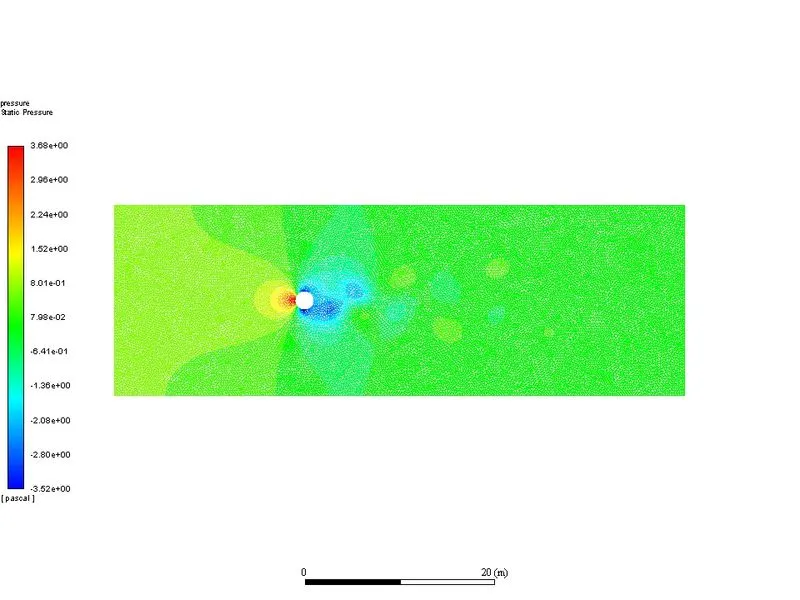
Fig No. 15 Pressure Plot
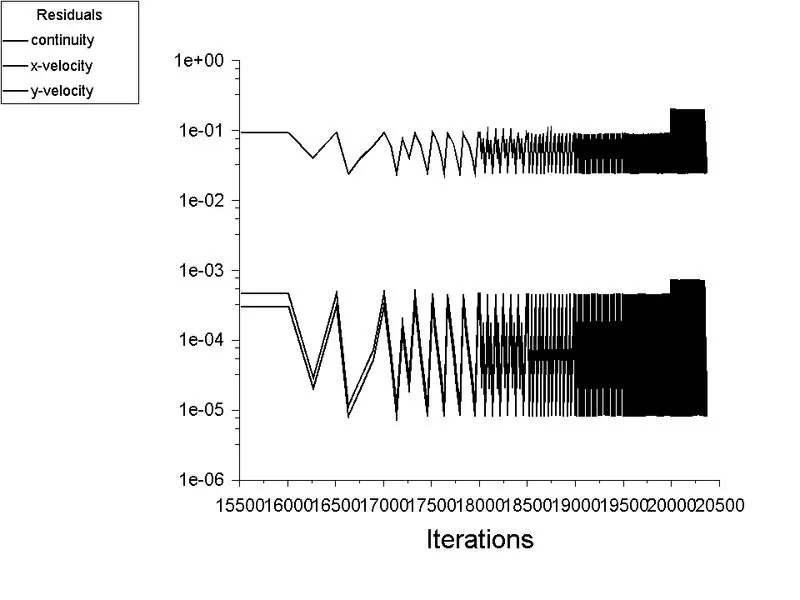
Fig No. 16 Residual Plot
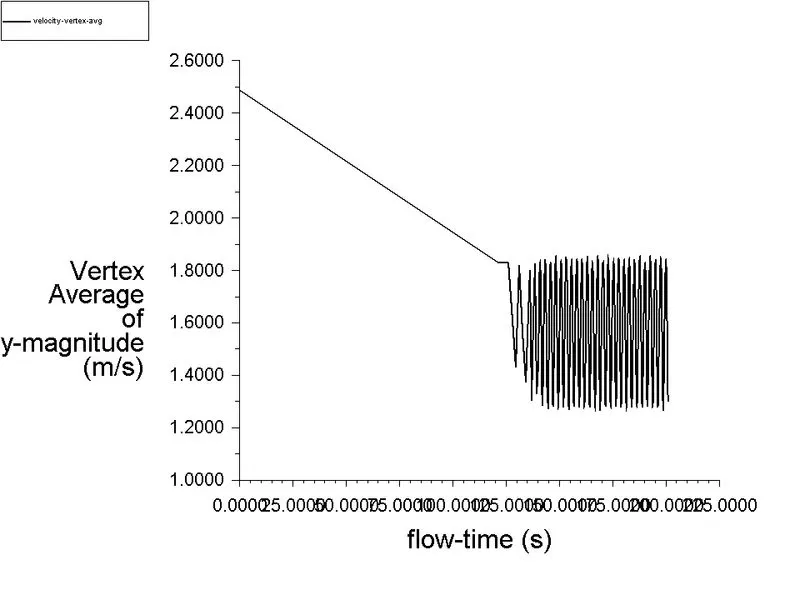
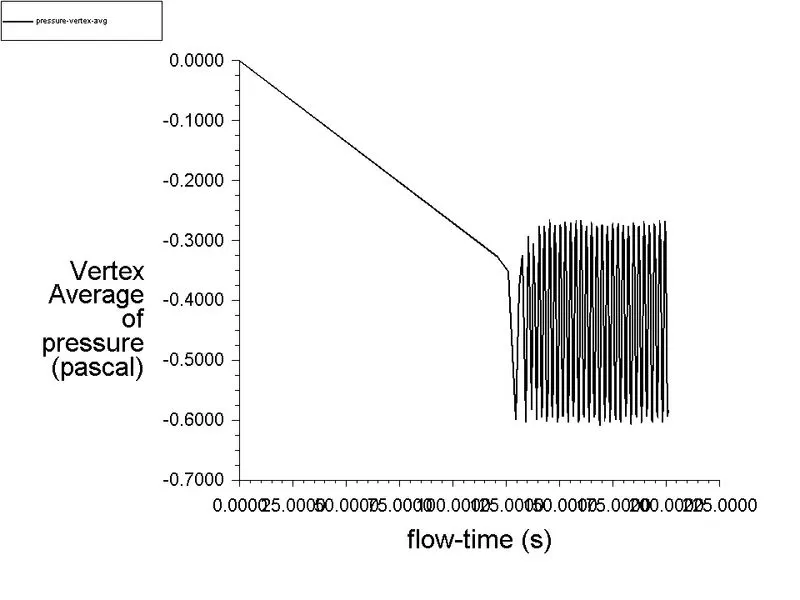
Fig No. 17 Vertex Average of Velocity Magnitude and Pressure
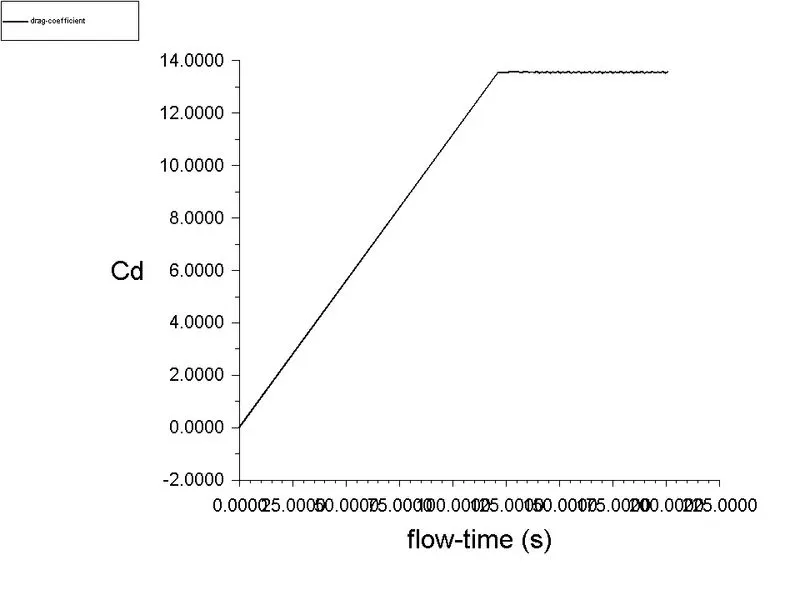
Fig No. 18 Coefficient of discharge
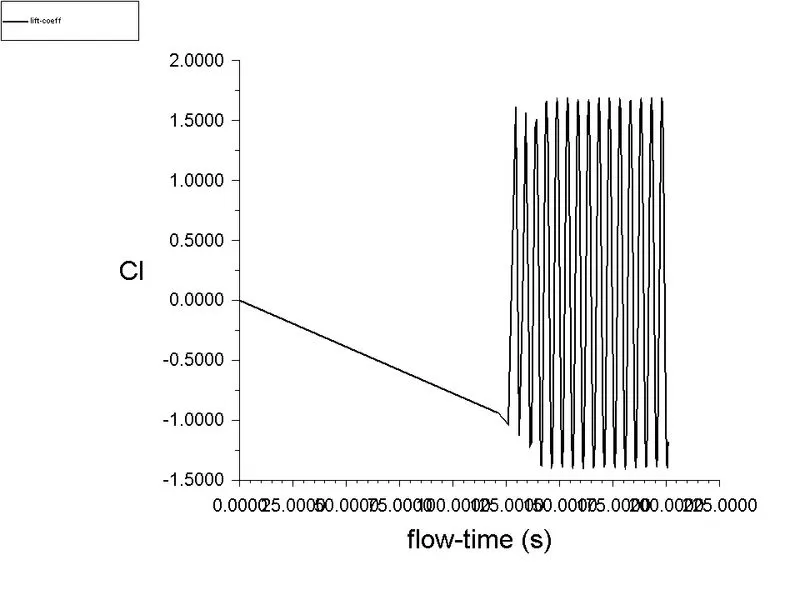
Fig No. 19 Coefficient of lift
The strouhal number -
`omega = (Number of cycle)/(time)`
`omega = 6/50=0.12`
`St = (omega*l)/v`
`St = (0.12*2)/2.5=0.096`
Strouhal number for the unsteady case is 0.076 with velocity = 2.5m/s
--------------------------------------------------------------------------------------------------
- PART 2 - Calculate the coefficient of lift and drag by setting the Reynolds number to 10, 100, 1000, 10000 & 100000.
- CASE I - Reynold number = 10.
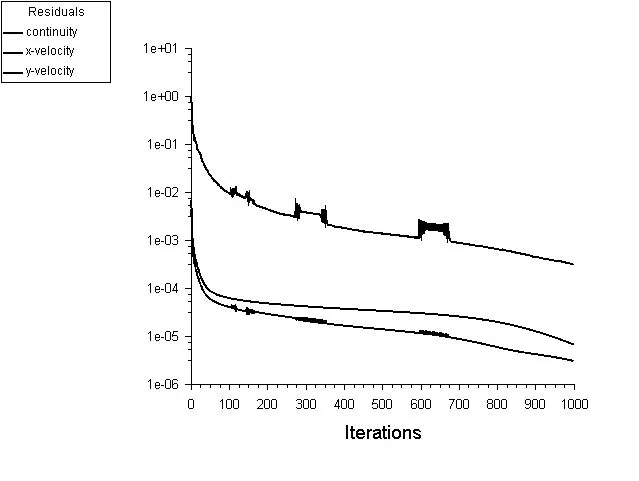
Fig No. 20 Residual
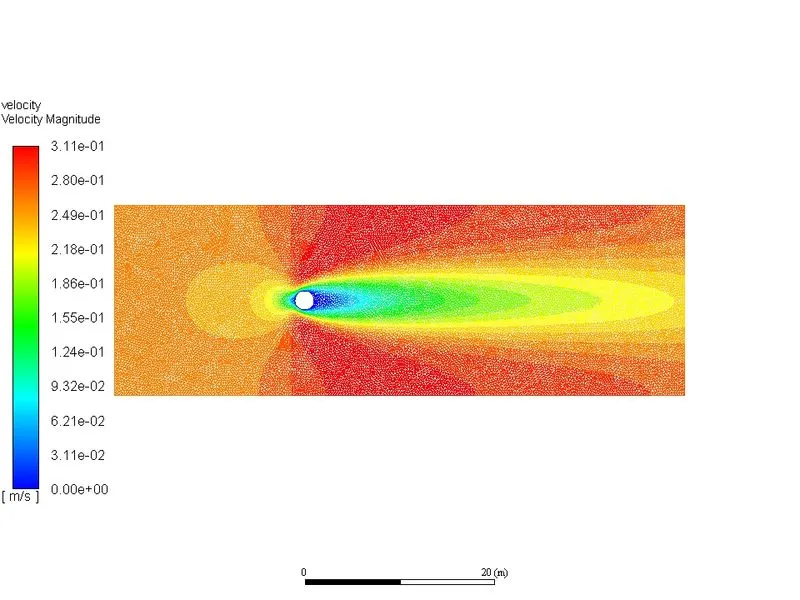
Fig No. 21 Velocity Contour
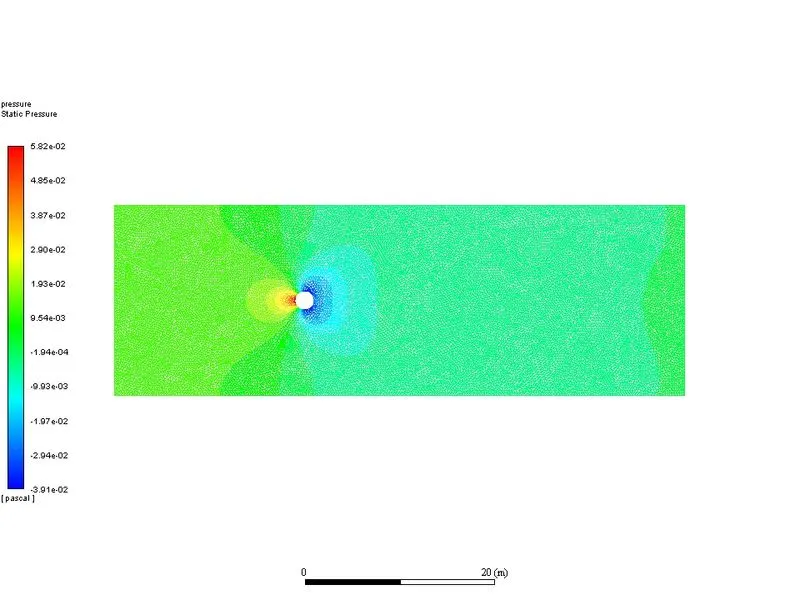
Fig No. 22. Pressure Contour
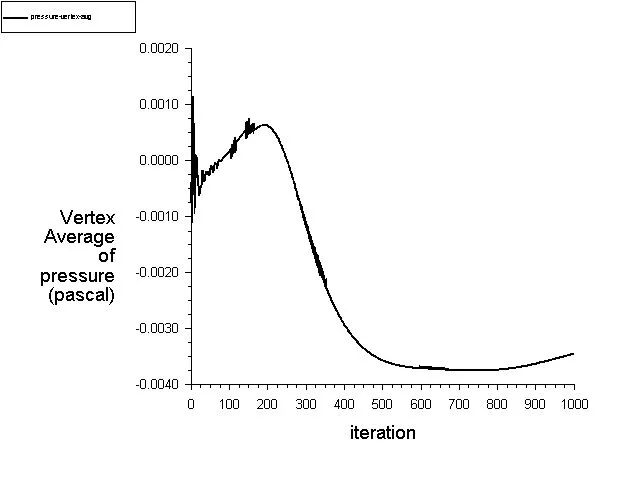
Fig No. 23. Vertex Average of Pressure magnitude at monitor point
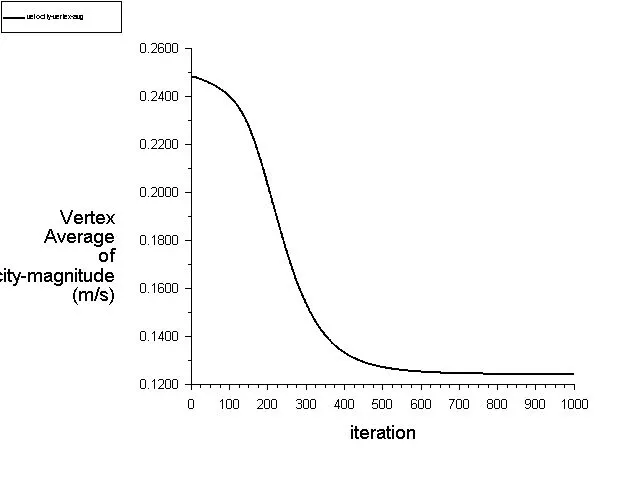
Fig No. 24. Vertex Average of Velocity Magnitude at monitor point
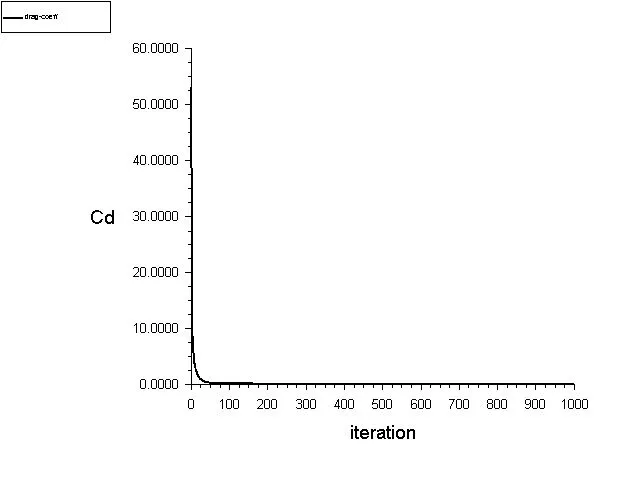
Fig No. 25. Coefficient of drag
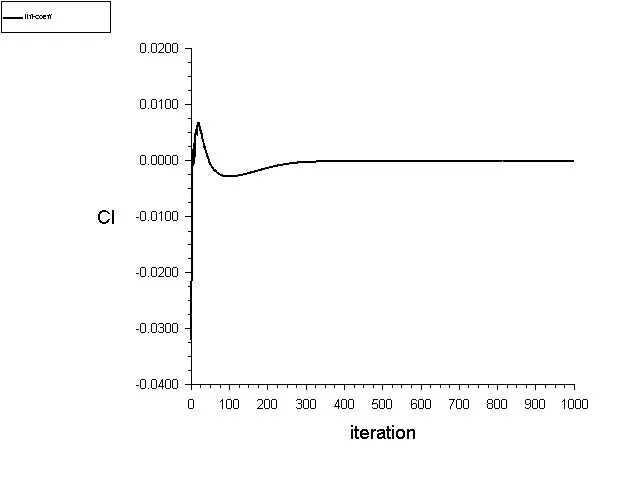
Fig No. 26. Coefficient of Lift
------------------------------------------------------------------------------------------------------------------
- CASE II - Reynolds Number = 100.
Fig No. 27. Residual
Fig No. 28. Velocity Contour
Fig No. 29. Pressure Contour
Fig No. 30. Vertex Average of Velocity Magnitude at monitor point
Fig No. 31. Vertex Average of Pressure Magnitude at monitor point
Fig No. 32. Coefficient of Discharge
Fig No. 33. Coefficient of Lift
---------------------------------------------------------------------------------------------------------------------------
- CASE III - Reynold Number = 1000.
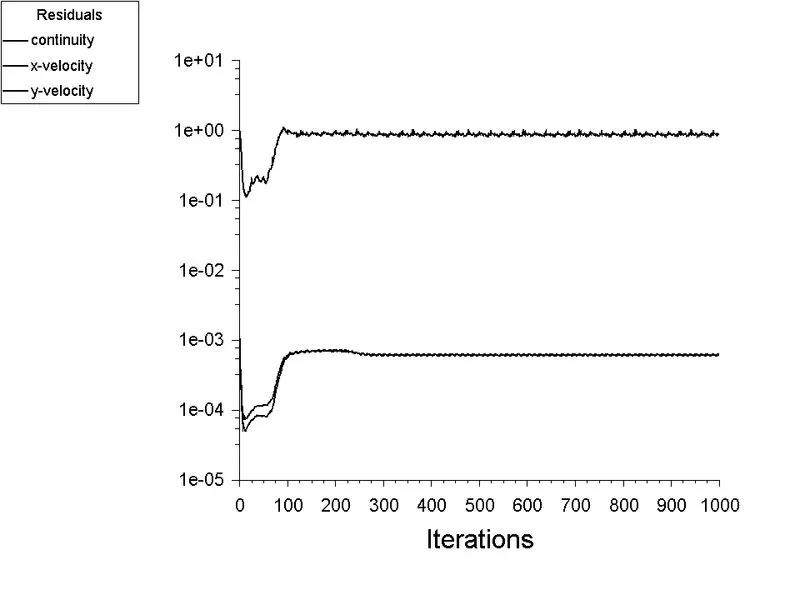
Fig No. 34. Residual
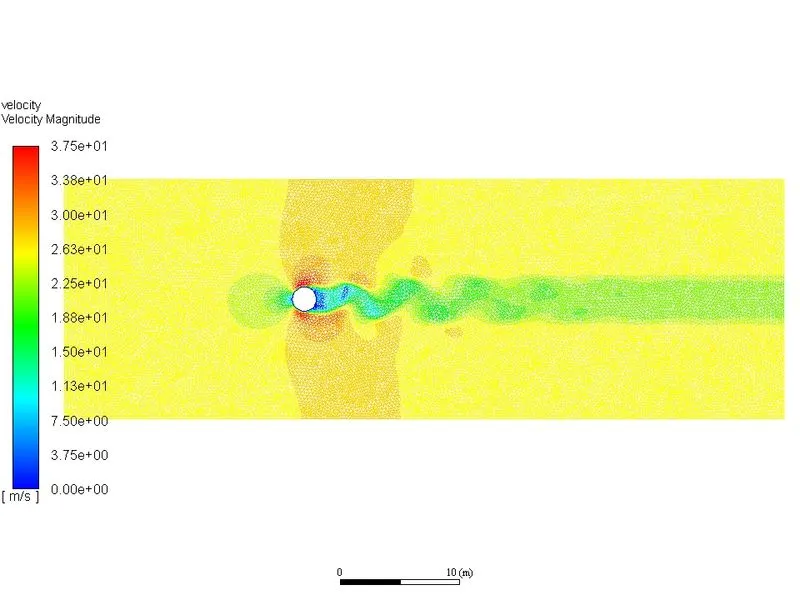
Fig No. 35. Velocity Contour
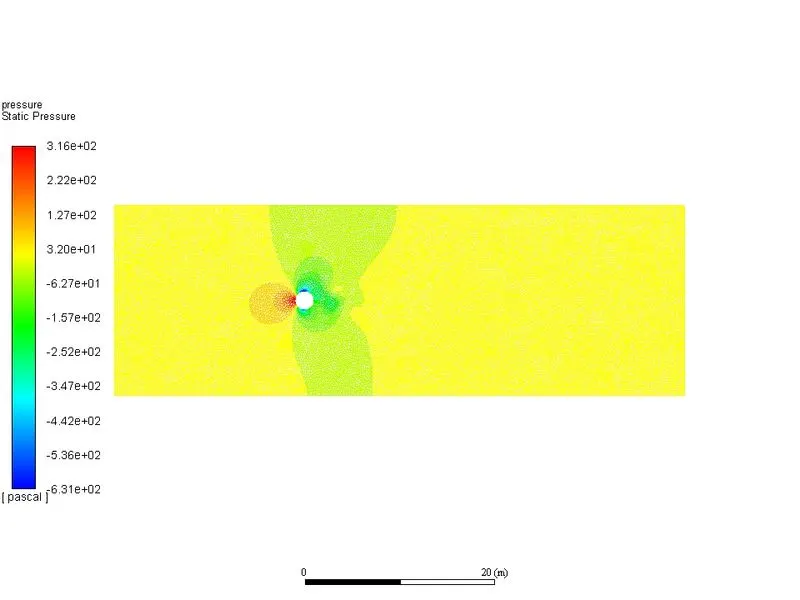
Fig No. 36. Pressure Contour
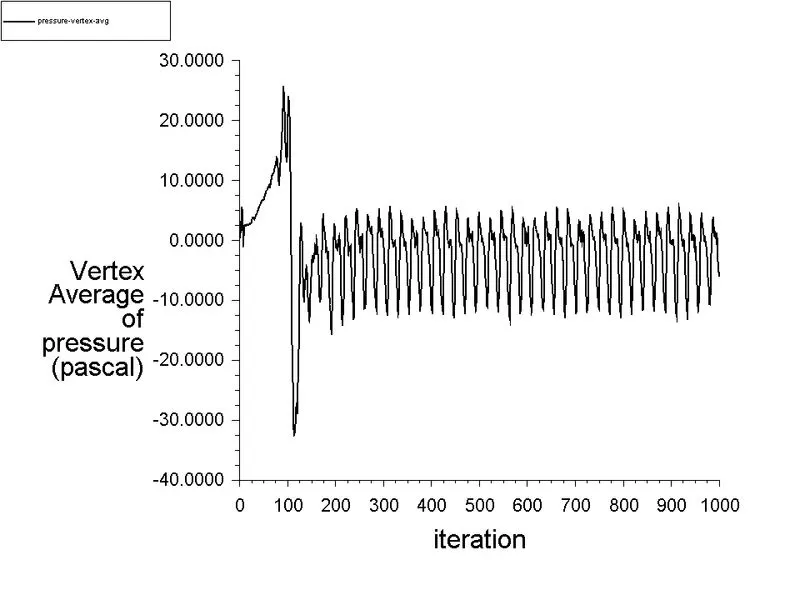
Fig No. 37. Vertex Average of Pressure at monitor point
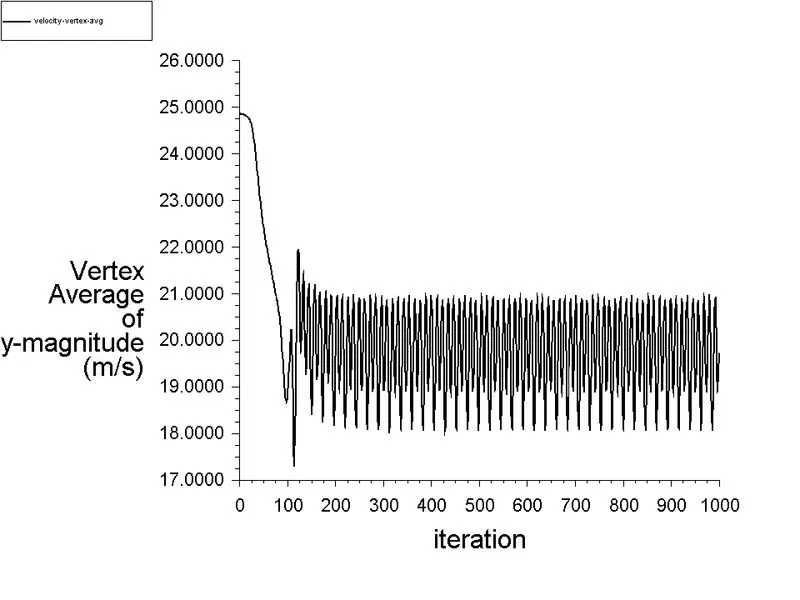
Fig No. 38. Vertex Average of Velocit at monitor point
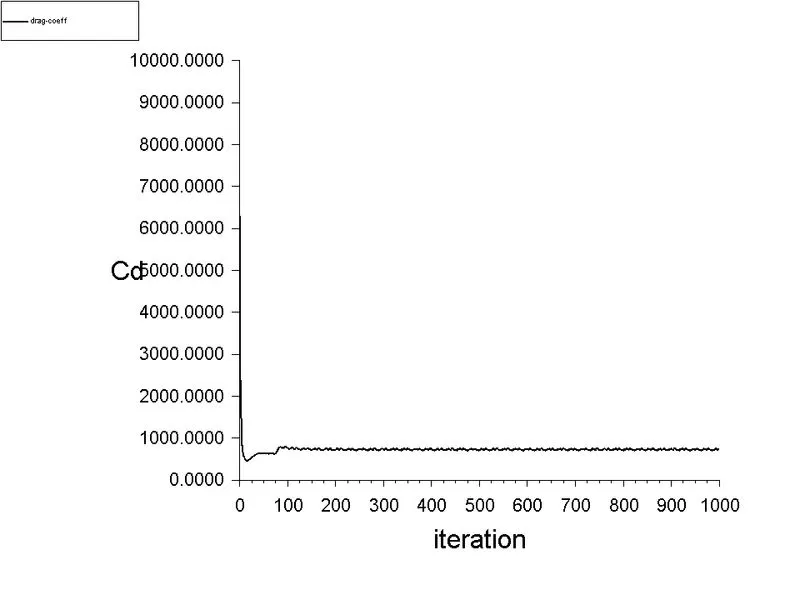
Fig No. 39. Coefficient of Discharge
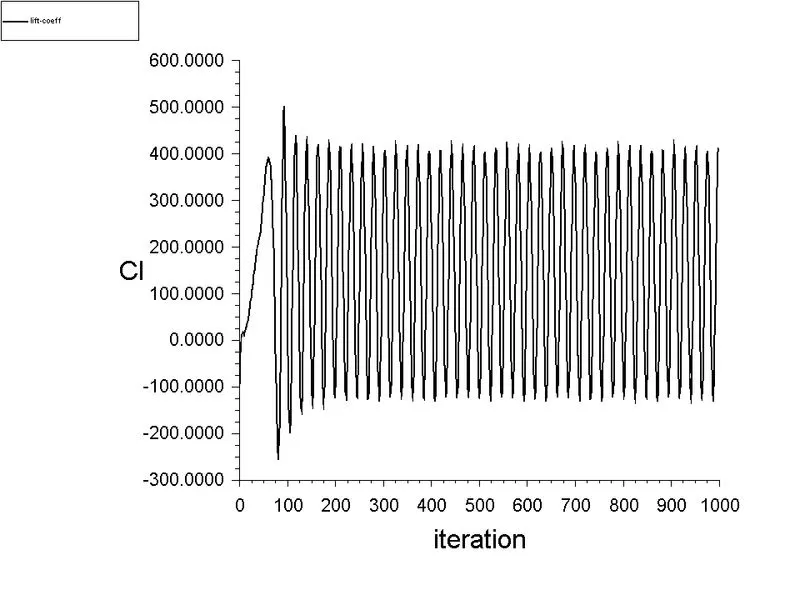
Fig No. 40. Coefficient of Lift
----------------------------------------------------------------------------------------------------------------------
- CASE IV - Reynold Number = 10000.
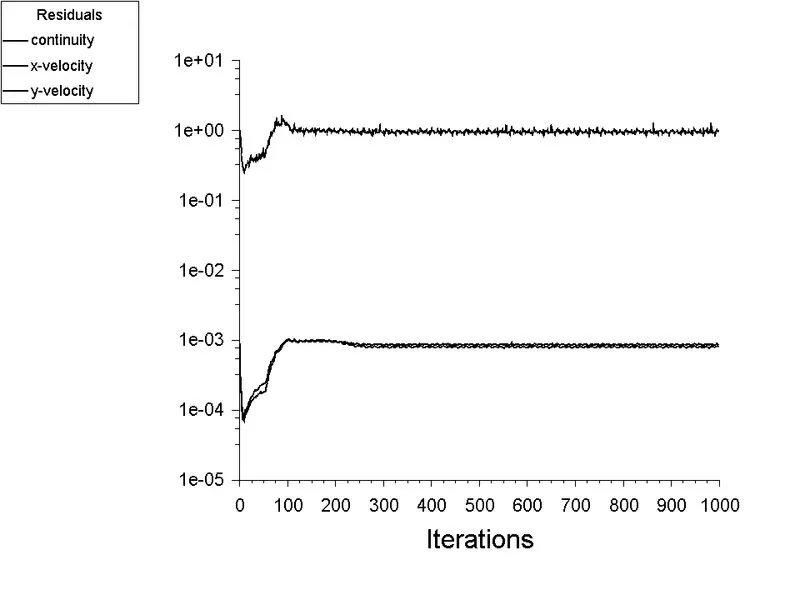
Fig No. 41. Residual
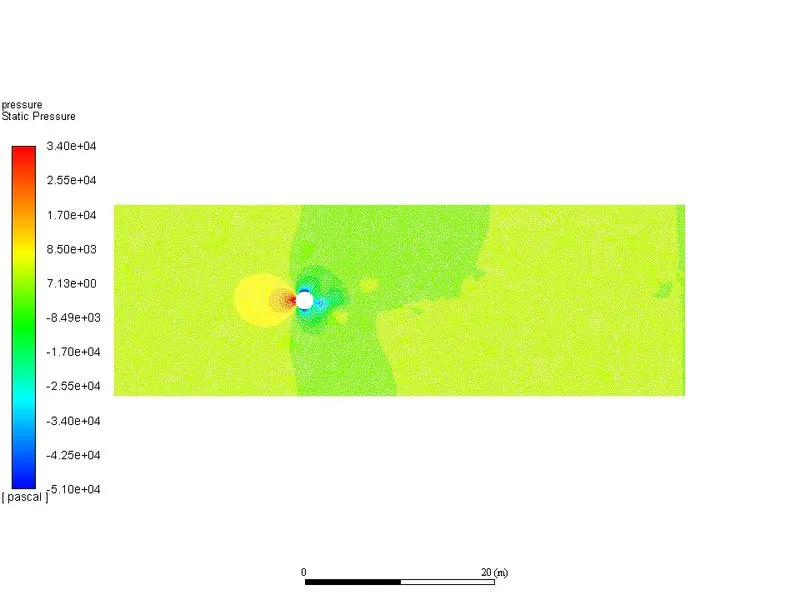
Fig No. 42. Pressure Contour
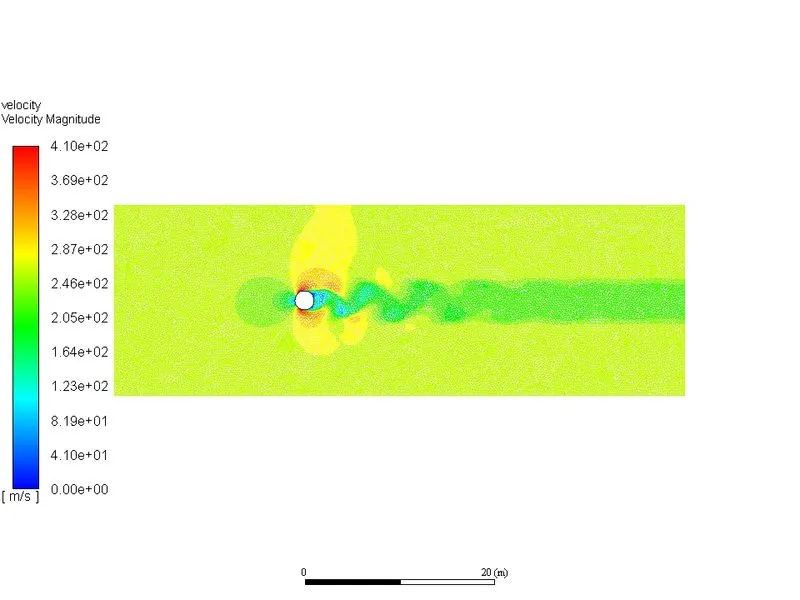
Fig No. 43. Velocity Contour
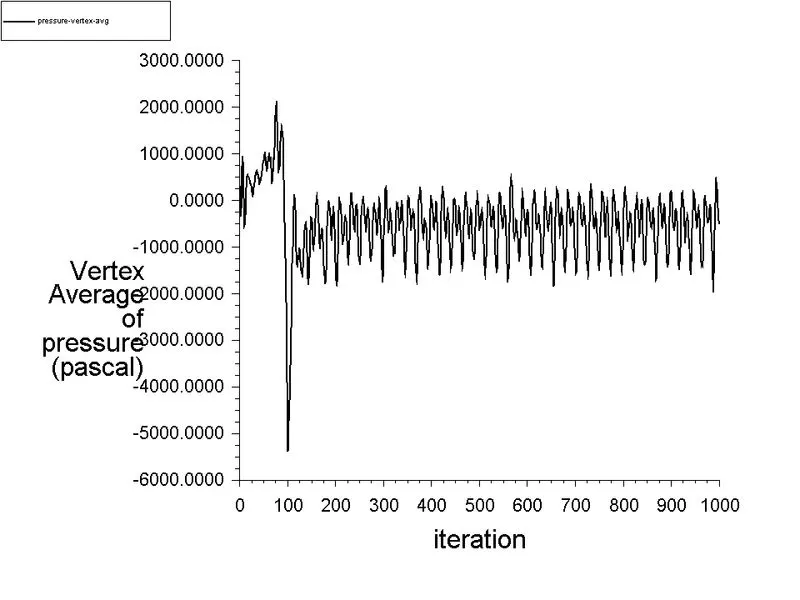
Fig No. 44. Vertex Average of Pressure
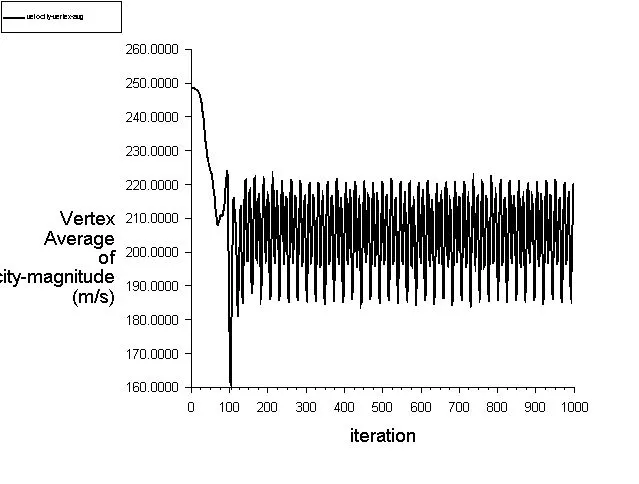
Fig No. 45. Vertex Average of Velocity Magnitude
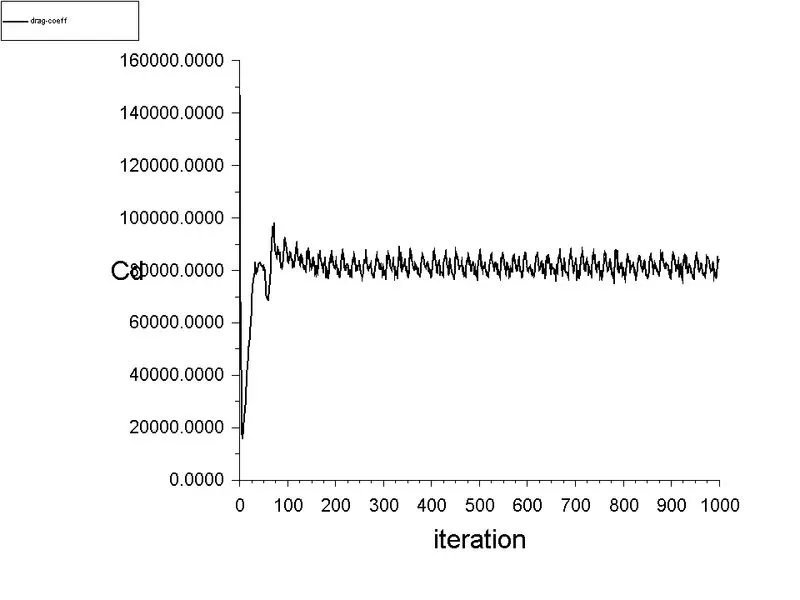
Fig No. 46. Coefficient of Drag
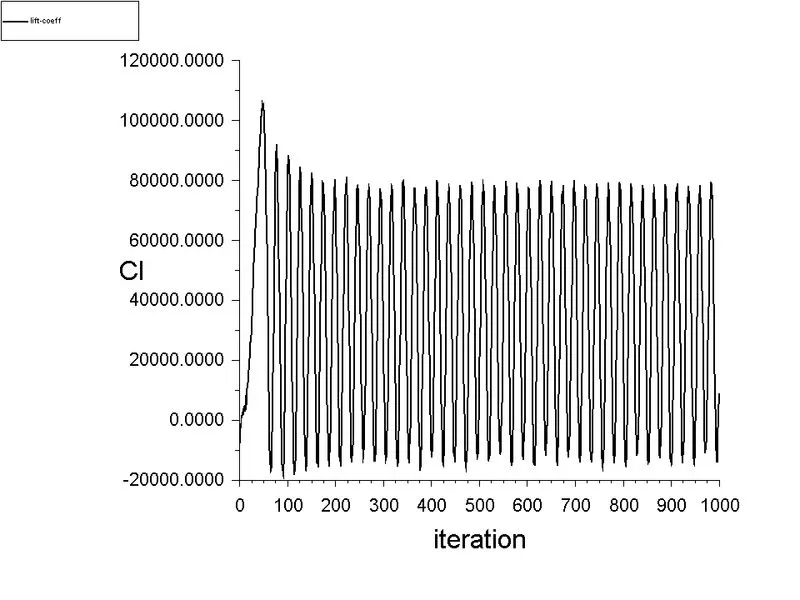
Fig No. 47. Coefficient of Lift
-------------------------------------------------------------------------------------------------------------------
- CASE V - Reynold Number = 100000
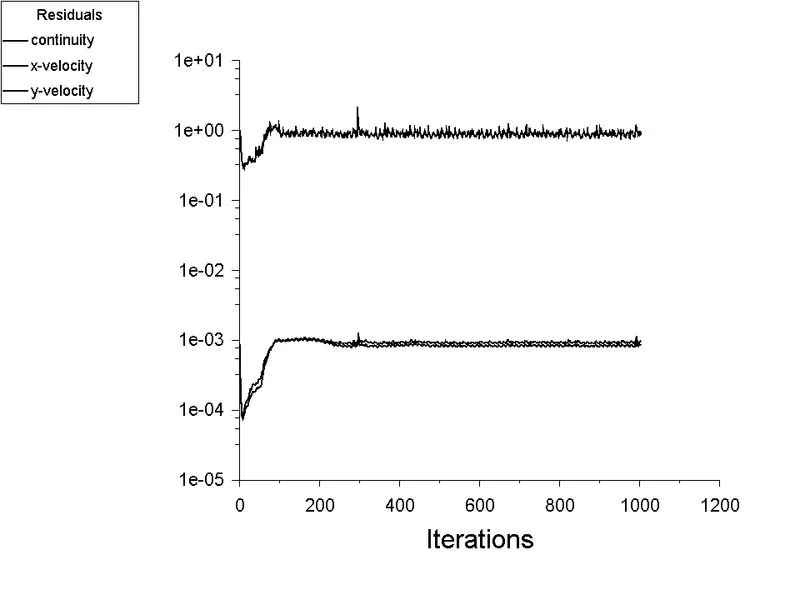
Fig No. 48. Residual
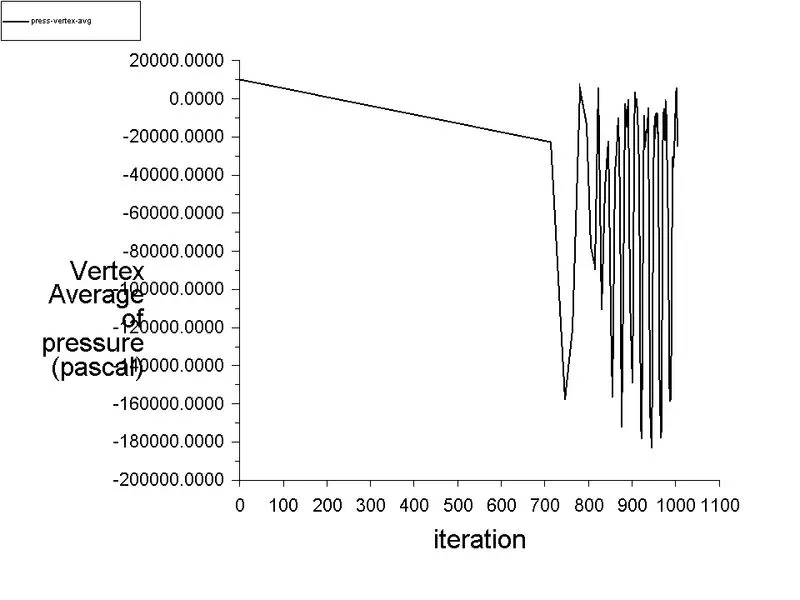
Fig No. 49. Vertex Average of Pressure
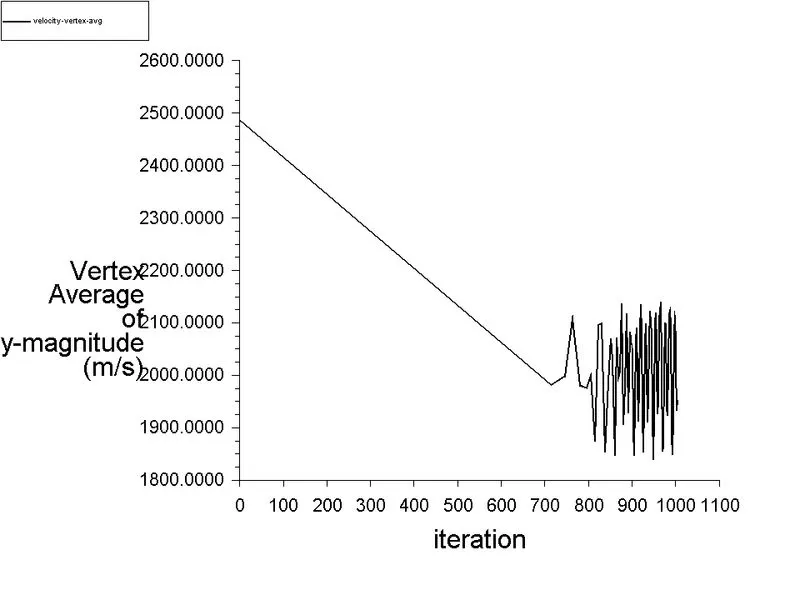
Fig No. 50. Vertex Average of Velocity Magnitude
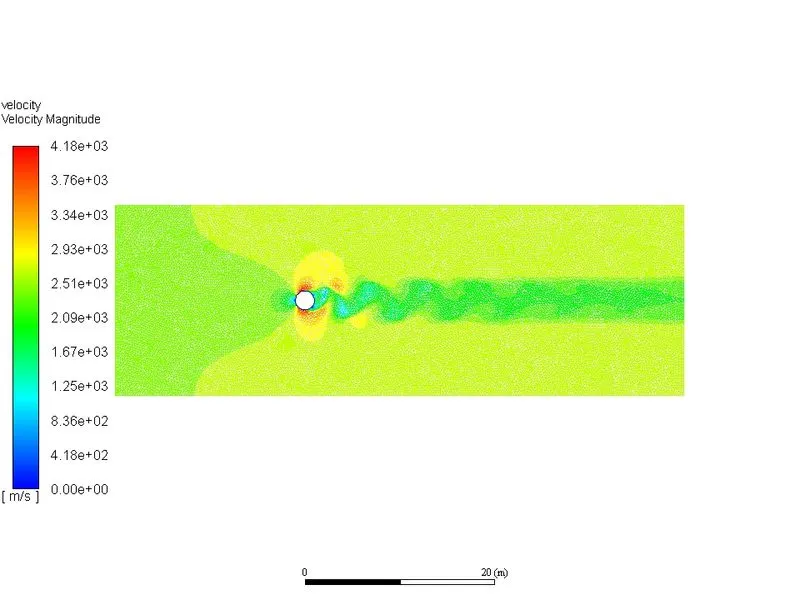
Fig No. 51. Velocity Contour
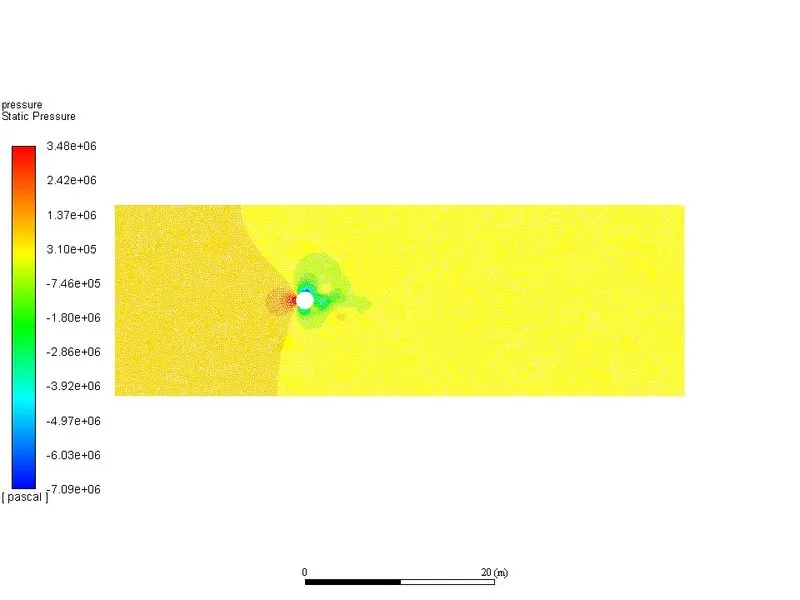
Fig No. 52. Pressure Contour
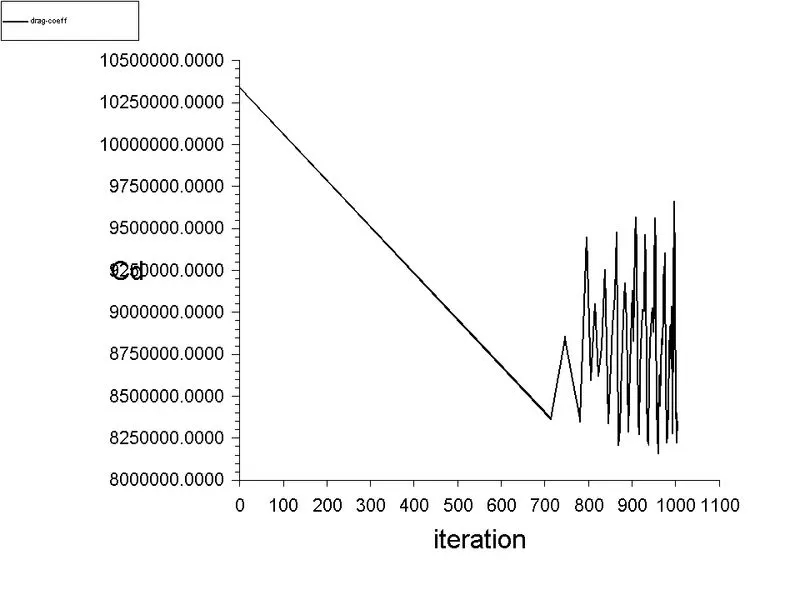
Fig No. 53. Coefficient of Drag
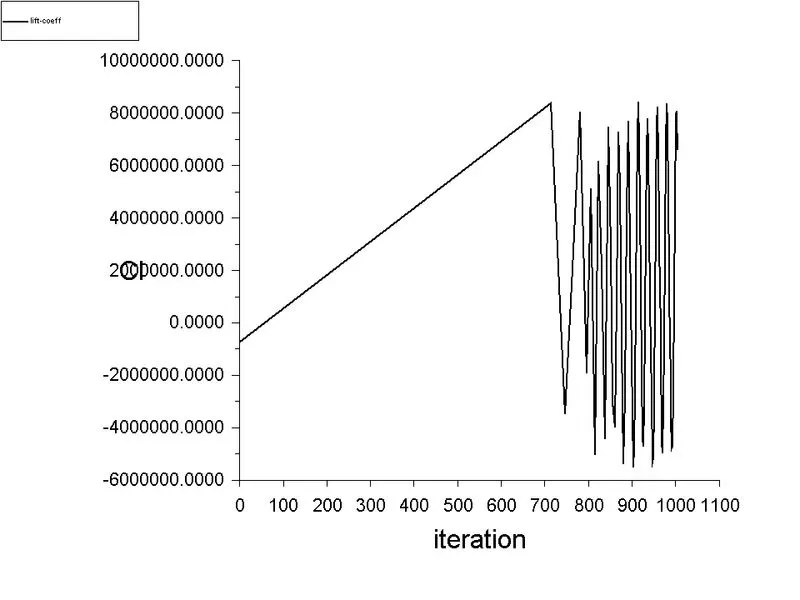
Fig No. 54. Coefficient of Lift
-----------------------------------------------------------------------------------
Table No. 3 Coefficient of drag and lift.
| REYNOLD NUMBER | COEFFICIENT OF DRAG (Cd) | COEFFICIENT OF LIFT (Cl) | VELOCITY VERTEX AVERAGE (m/s) |
| 10 STEADY STATE | 3.3320 | 1.44e-3 | 0.12479 |
| 100 STEADY STATE | 1.36615 | 1.7435 | 1.8350 |
| 1000 STEADY STATE | 0.6844 | 0.8196 | 19.7392 |
| 10000 STEADY STATE | 0.7459 | 0.19476 | 220.3234 |
| 100000 STEADY STATE | 0.7823 | -0.1017 | 2105.08 |
| 100 UNSTEADY STATE | 1.35852 | -1.1735 | 1.7315 |
From the table, the reynold number purely varies based on velocity in that case the drag and lift are varying drastically. Velocity vertex average in the monitor point is high and thats the reason the vertex generated produces highest amount of lift and drag. The velocity of the flow creates the high vortices and this also creates turbulent flow.
- CONCLUSION -
- The convergence of the flow solution not only depends upon residual plot but majorly on the steadiness of the lift graph. The convergence and stability observed in lift graph purely symbolizes the onvergence in solution.
- The negative lift coefficient indicated downward application of force. Or acting in opposite manner in which direction vector.
- Cofficient of drag decreases as the reynold number increases.
The preferred material for the study is here and here.
In both literature the basics of von karman street is thoroughly explain as well as the experimental data attched so as to guide toward the fundamentals of vortex how to control and implement the concept in various practical application.