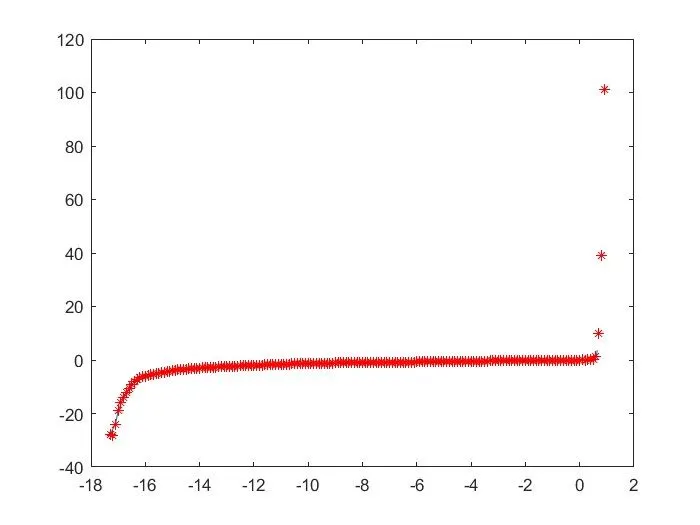
Project - Data Handling and Interpolation
%Loading excel data file
M=readmatrix("VI.xlsx");
V=M(:,1);
I=M(:,2);
Vq=-17.3:0.1:0.9;
Iq=interp1(V,I,Vq,'linear') %liner interpolation
plot(V,I,Vq,Iq,'r*')       %Plot the values
Command window results :
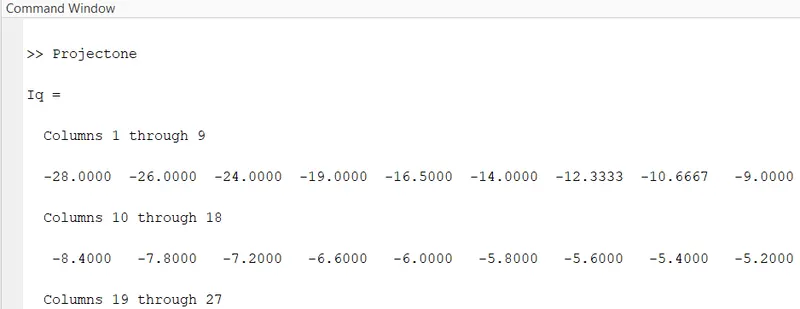
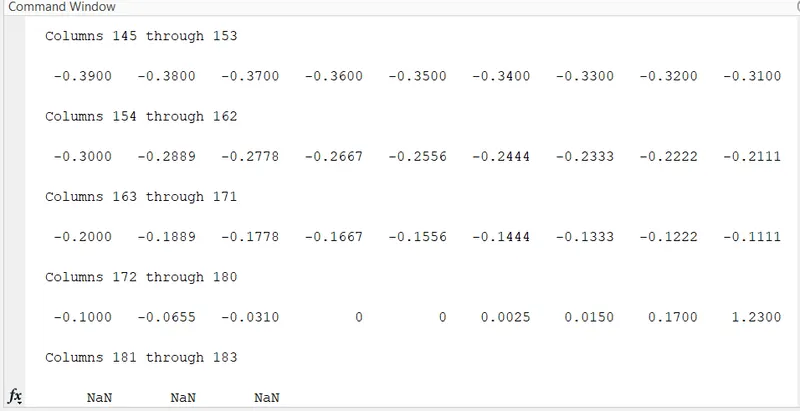
Missing data :
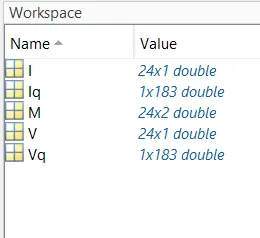
Workspace results:
Linear polation
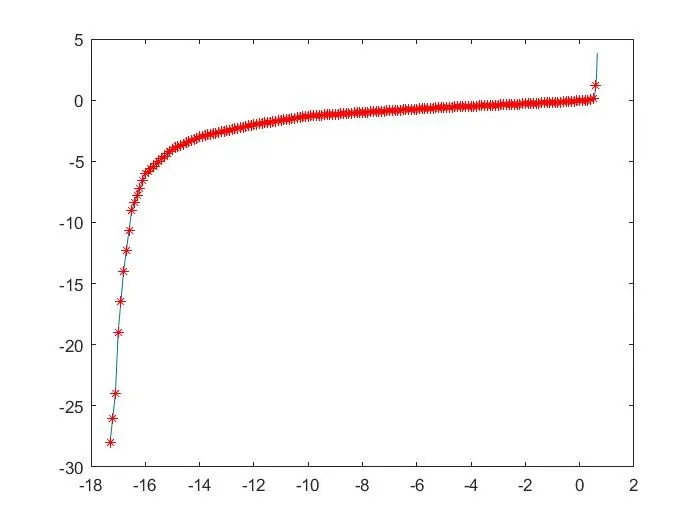
Determining the plot throgh spline method
%Loading excel data file
M=readmatrix("VI.xlsx");
V=M(:,1);
I=M(:,2);
Vq=-17.3:0.1:0.9;
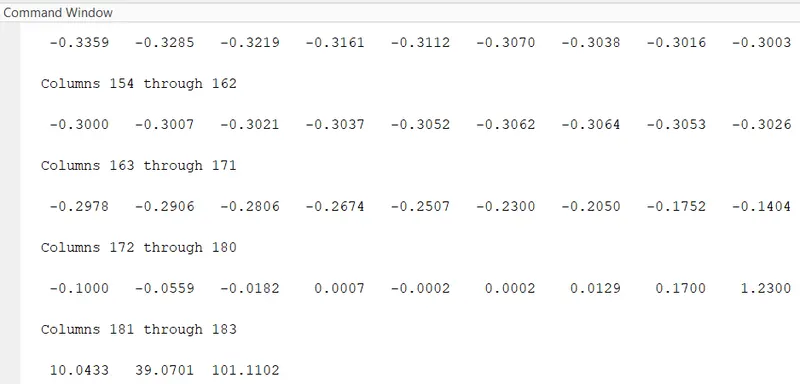
Iq=interp1(V,I,Vq,'spline')
plot(V,I,Vq,Iq,'r*')
Command window results:
Plot results: