Project - Data Handling and Interpolation
Aim: Data Handling and Interpolation
Objective:
- To read the excel file in the Matlab program.
- To perform the interpolation in the range of -17.3:0.1:0.9.
- To generate the interactive plot for the interpolated data.
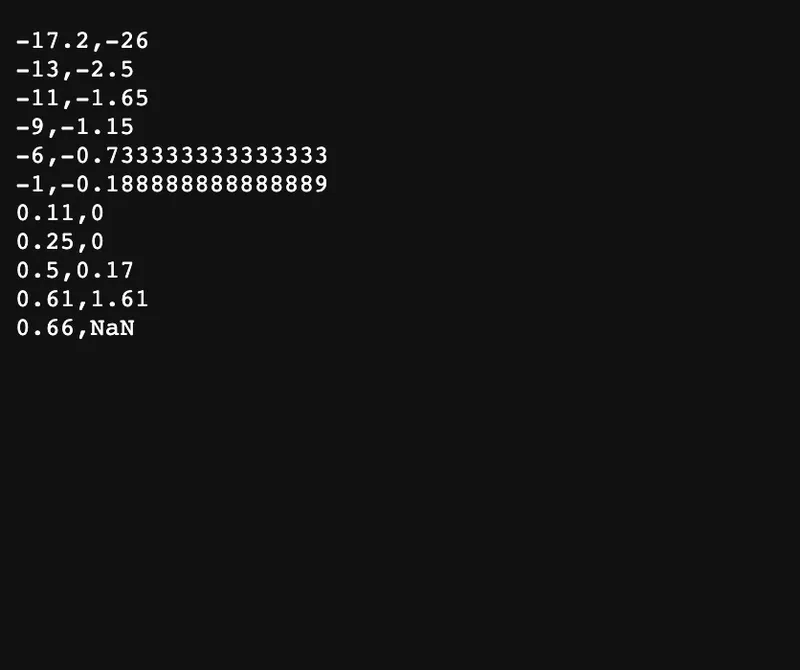
- To store them in a text file.
Solution:
file=xlsread("VI.xlsx");%reading the data from the excel file
v=file(:,1);%extracting voltage values from the excel file
i=file(:,2);%extracting current values from the excel file
x=-17.3:0.1:0.9;%range of interpolation
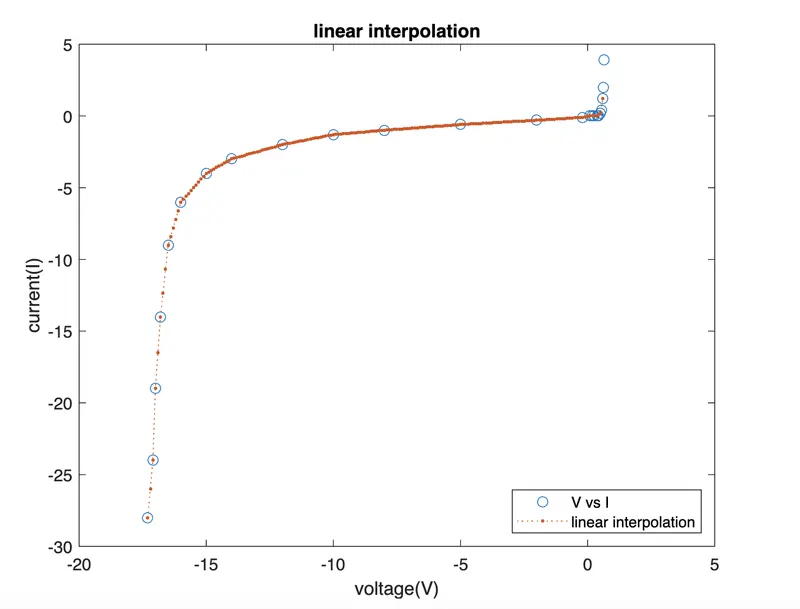
y1=interp1(v,i,x);%linear interpolation
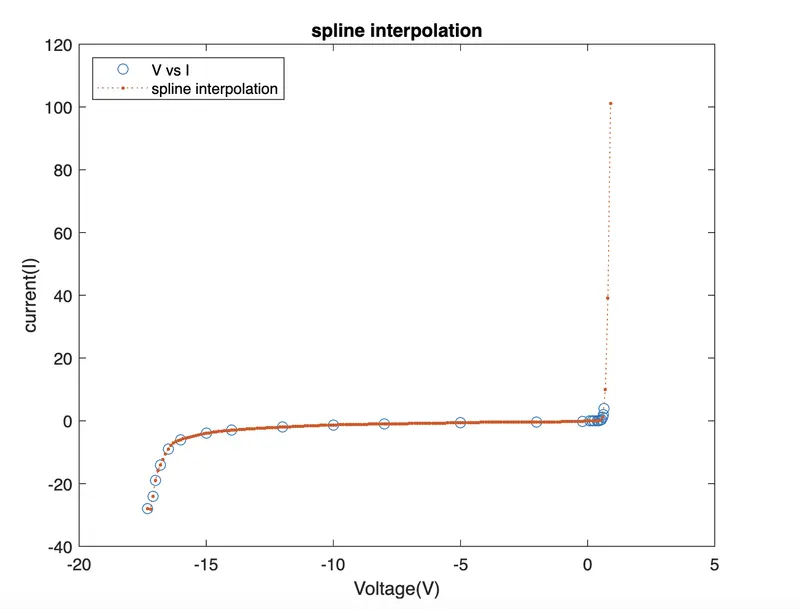
y2=interp1(v,i,x,'spline');%spline interpolation
figure(1);
plot(v,i,'o',x,y1,':.');%plotting of linear interpolation
xlabel("voltage(V)");
ylabel("current(I)");
title("linear interpolation");
legend('V vs I','linear interpolation')
figure(2);
plot(v,i,'o',x,y2,':.')%plotting of spline interpolation
xlabel("Voltage(V)");
ylabel("current(I)");
title("spline interpolation");
legend('V vs I','spline interpolation')
vnew=xlsread("VI.xlsx",2);%reading the new voltage data from the excel file
%finding the values of current using linear interpolation
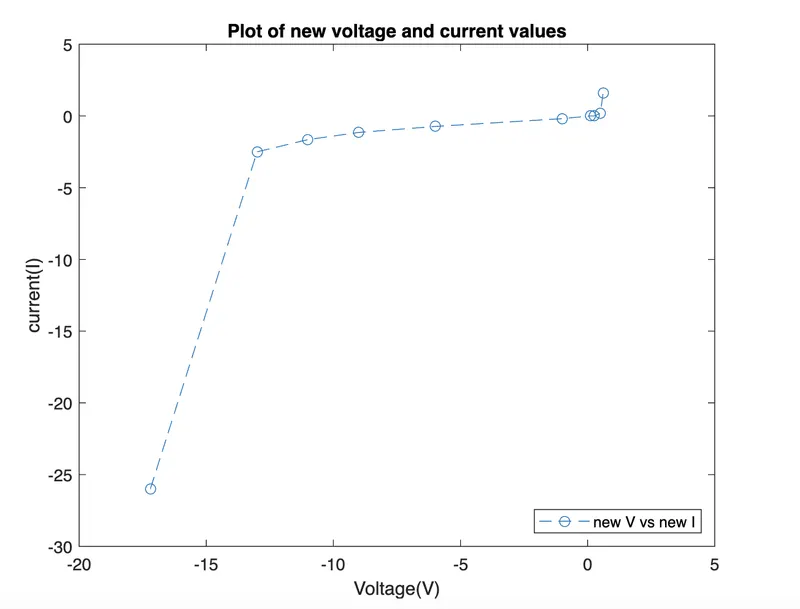
inew=interp1(v,i,vnew);
figure(3);
plot(vnew,inew,'o--')%plotting of new current and voltage data
xlabel("Voltage(V)");
ylabel("current(I)");
title("Plot of new voltage and current values");
legend('new V vs new I')
file2=[vnew inew];%saving the values into a matrix
%creating an output.text file to save the new voltage and new current
writematrix(file2,'VI_output.txt');
VI_output.txt