Project - Data Handling and Interpolation
AIM:
To read the excel file in the MATLAB program and perform the interpolation in the range of [-17.3:0.1:0.9] and generate the interactive plot for the interpolated data.
OBJECTClVES OF THE PROJECT:
- To write a MATLAB program to read the excel file.
- Perform the interpolation in the range of -17.3:0.1:0.9 and plot for the interpolated data.
- Computing the current values for given voltages and storing the outputs in a text file.
MATLAB PROGRAM
clear all
close all
clc
% Reading the data from the given excel file (Sheet 1)
data= xlsread('VI.xlsx','Sheet1');
% Storing the voltage data from column 1
V=data(:,1);
% Storing the current data from column 2
I=data(:,2);
% Defining the range to a variable
Vrange=[-17.3:0.1:0.9];
% Interpolating the data
Iq_linear=interp1(V,I,Vrange,"linear");
Iq_spline=interp1(V,I,Vrange,"spline");
figure(1)
% Plotting the original set of data
subplot(3,1,1)
plot(V,I,'color','b')
grid on
xlabel('Voltage')
ylabel('Current')
title('Original data')

% Plotting the interpolated data
subplot(3,1,2)
plot(Vrange,Iq_linear,'color','g')
grid on
xlabel('Voltage range')
ylabel('Current values')
title('Linear Interpolated data')

subplot(3,1,3)
plot(Vrange,Iq_spline,'color','g')
grid on
xlabel('Voltage range')
ylabel('Current values')
title('Spline Interpolated data')

% Plotting the original and interpolated data
figure(2)
subplot(2,1,1)
plot(V,I,'linestyle','none','marker','o','markersize',5,'MarkerFaceColor','g')
hold on
plot(Vrange,Iq_linear,'color','b')
xlabel('Voltage')
ylabel('Current')
grid on
title('Original data and Linear Interpolated data')
legend('Original data','Linear Interpolated data')

subplot(2,1,2)
plot(V,I,'linestyle','none','marker','o','markersize',5,'MarkerFaceColor','g')
hold on
plot(Vrange,Iq_spline,'color','r')
grid on
xlabel('Voltage')
ylabel('Current')
title('Original data and Spline Interpolated data')
legend('Original data','Spline Interpolated data')

% defining the voltage datas
VV =[-17.2;  -17.1;  -13.8;  -13.5;  -13.0;  -12.5;  -11;   -9;   -5.76;   -6;   -1;    0.11;    0.25;   0.5;    0.61];
% Interpolating for given set of data
II_linear=interp1(V,I,VV,'linear');
II_Spline=interp1(V,I,VV,'spline');
% Creating a txt file to store the outputs
fid=fopen('interpolated data .txt','w');
% Printing the headline
fprintf(fid,'The current values for given voltages are listed below\n\n');
fprintf(fid,'%16s  %16s\n','Voltage','Current');
% Implementing for loop to print the outputs for all the given values
for i=1:length(VV)
    fprintf(fid,'%16f  %16f\n',VV(i),II_linear(i));
end
fclose(fid); % closing the file
% Plotting for the given set of data
figure(3)
subplot(211)
plot(VV,II_linear,'color','r')
grid on
xlabel('Given Voltage')
ylabel('Interpolated Current values')
title('Linear Computed data')

subplot(212)
plot(VV,II_Spline,'color','b')
grid on
xlabel('Given Voltage')
ylabel('Interpolated Current values')
title('Spline Computed data')
Above written is the MATLAB code to read the excel file and perform the interpolation in the range and plot for the interpolated data. Interpolation means determining a value from the existing values in a given data set. Here the existing values are the experimental values provided in the excel file from which the interpolated values are determined. Interpolation can be done in various methods such as linear, cubic, next, spline, etc., In this project, the interpolation is done in two methods i.e., linear and spline.
OUTPUT:
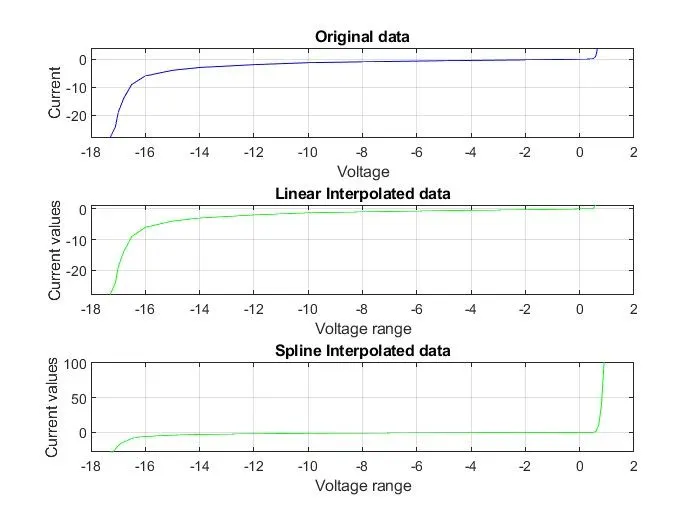
Both spline and linear interpolation is carried out and the respective plots are plotted. The below figure shows the individual plots of original, linear and spline interpolated data.
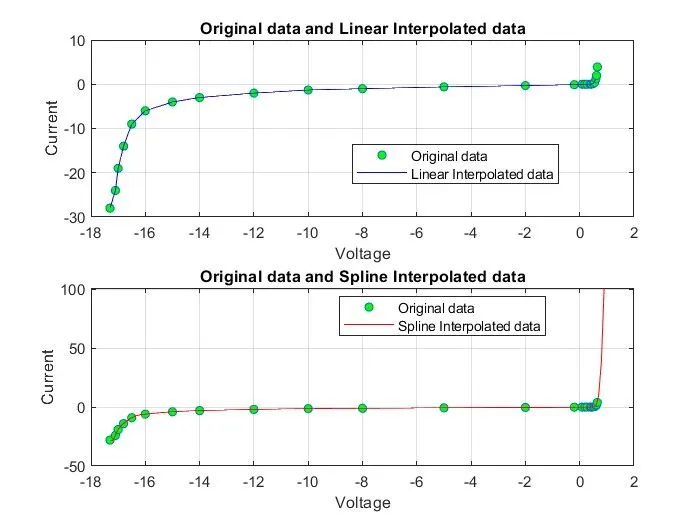
The below figure shows the variations of original data plotted with both interpolated data.
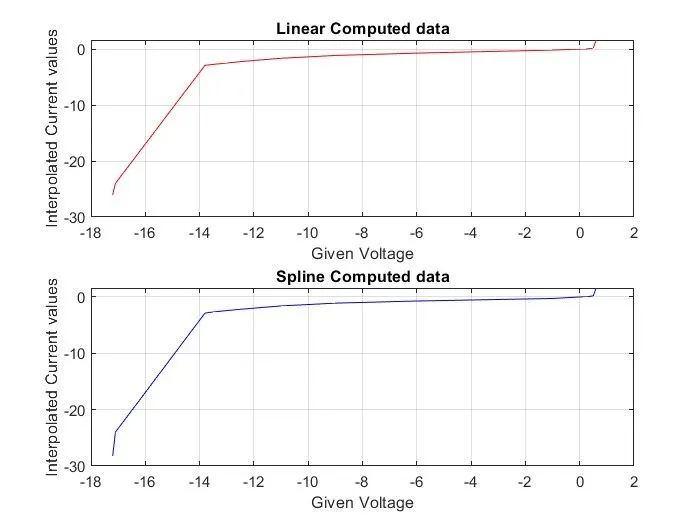
The below figure shows the plots for the given voltage and interpolated current values.
The interpolated current values are exported to a text file: interpolated data
CONCLUSlON:
MATLAB code is written to perform the interpolation in the range and plot the interpolated data and also computes the current values for given voltages below and stores them in a text file.