Parsing NASA thermodynamic data
AIM:
To write a MATLAB code that extracts the 14 co-efficients and calculates the enthalpy, entropy and specific heats for all the species in the data file. To calculate the molecular weight of each species. And to Plot the Cp, Enthalpy and Entropy for the local temperature range specific for each species, save those files and dump them in separate folders.
THEORY:
Enthalpy: Is a thermodynamic quantity equivalent to the total heat content of a system. It is equal to sum of internal energy of a system and the product of pressure and volume.
Specific heat: The quantity of heat required to raise the temperature of one gram of a substance by one degree Celsius. In this process pressure and volume plays the major role, therefore specific heat can be measured in two ways by keeping pressure constant or volume constant. The specific heat is measured by keeping the pressure constant is known as specific heat at constant pressure (Cp). Similarly, specific heat measured at constant volume is known as specific heat at constant volume.
Entropy: Is a measure of randomness or disorder of the system. The greater the randomness, the higher the entropy. It is state function extensive property.
The equations to determine specific heat, Enthalpy and Entropy is shown below,

OBJECTClVES OF THE PROJECT:
- Write a MATLAB code to know the number of species in the data and to extract their coefficients.
- Calculating Specific heat, Enthalpy and Entropy using those coefficients and plotting the graph of all three against temperature.
- The code also involves in creating a separate folder and saving the obtained plots in the specific folder.
- Write the code for calculating the Molecular weight of the species.
MAIN MATLAB PROGRAM
close all
clear all
clc


%% Determining the No. of species in the data

f1 = fopen('THERMO.dat','r'); % opening the file
species = 0;

while ~feof(f1) % checking till it is not end of file

    L = fgetl(f1);

    Ts = strsplit(L,' '); % splitting the line

    q = length(Ts); % determining the end of q

    % in data at the end of line numbering is done for each species

    if strcmpi(Ts(q),'1') % counting the 1's will give us no of species
    species = species+1;
    end
end

fprintf('Number of species in data is %fnn',species) % printing the number of species in the data provided

%% Extracting the global temperature

f1 = fopen('THERMO.dat','r');

header = fgetl(f1);
tline = fgetl(f1);

a = strsplit(tline,' ');

global_temp = str2num(tline);

global_low_temp = str2num(a{2});
global_mid_temp = str2num(a{3});
global_high_temp = str2num(a{4});

% Skipping three header lines

for i=1:3
    fgetl(f1);
end

%% Extracting the coefficients data and local temperatures

for i=1:species

    % 1. For local temperatures

    data = fgetl(f1);
    a = strsplit(data,' ');
   s_name(i) = a(1); %(the starting chars are the name of species)

   % the line containing the loc temps has G common in all lines
   % by determining the position of G temp positions can be determined

   g_position=findstr(data,'G ');
   p=strsplit(data(g_position:end),' '); % temp data are towards end of line from G

   loc_temp1(i) = str2double(p(2));
   loc_temp2(i) = str2double(p(3));
   loc_temp3(i) = str2double(p(4));

% 2. For the coefficients data

    line1 = fgetl(f1);
        sl1 = findstr(line1,'E');
        cf1(i) = str2num(line1(1:sl1(1)+3));
        cf2(i) = str2num(line1(sl1(1)+4:sl1(2)+3));
        cf3(i) = str2num(line1(sl1(2)+4:sl1(3)+3));
        cf4(i) = str2num(line1(sl1(3)+4:sl1(4)+3));
        cf5(i) = str2num(line1(sl1(4)+4:sl1(5)+3));


        %Line 2

        line2 = fgetl(f1);
        sl2 = findstr(line2,'E');
        cf6(i) = str2num(line2(1:sl2(1)+3));
        cf7(i) = str2num(line2(sl2(1)+4:sl2(2)+3));
        cf8(i) = str2num(line2(sl2(2)+4:sl2(3)+3));
        cf9(i) = str2num(line2(sl2(3)+4:sl2(4)+3));
        cf10(i) = str2num(line2(sl2(4)+4:sl2(5)+3));


        %Line3

        line3 = fgetl(f1);
        sl3 = findstr(line3,'E');
        cf11(i) = str2num(line3(1:sl3(1)+3));
        cf12(i) = str2num(line3(sl3(1)+4:sl3(2)+3));
        cf13(i) = str2num(line3(sl3(2)+4:sl3(3)+3));
        cf14(i) = str2num(line3(sl3(3)+4:sl3(4)+3));


        % making a separate folder in the name of the species

        mkdir('File parsing plots',s_name{i})

%% Calculating H, S, Cp

tmid = loc_temp3(i);
trange = linspace(loc_temp1(i),loc_temp2(i),100);

[h,Cp,s] = therm_calc(cf1(i),cf2(i),cf3(i),cf4(i),cf5(i),cf6(i),cf7(i),cf8(i),cf9(i),cf10(i),cf11(i),cf12(i),cf13(i),cf14(i),tmid,trange);
get = s_name{i};
M = Mw(get);

fprintf('Molecular weight of %s is: %f', s_name{i}, M)
fprintf('n')

% Plotting the graphs of Sopecific heat,Enthalpy and Entropy against
% temperature
    figure(1)
    plot(trange,h,'linewidth',3,'color','r')
    xlabel('Temperature')
    ylabel('Enthalpy')
    title(' Enthalpy v/s Temperature')

    figure(2)
    plot(trange,Cp,'linewidth',3,'color','r')
    xlabel('Temperature')
    ylabel('Specific heat')
    title(' Specific heat v/s Temperature')

    figure(3)
    plot(trange,s,'linewidth',3,'color','r')
    xlabel('Temperature')
    ylabel('Entropy')
    title(' Entropy v/s Temperature')

    cd 'C:UsersNikhilOneDriveDesktopskill lyncPractiseFile parsing plots'
    path = cd(s_name{i});

        % saving the plots in the folder described
        saveas(figure(1)','plot1 H vs T','jpg')
        saveas(figure(2)','plot2 Cp vs T','jpg')
        saveas(figure(3)','plot3 S vs T','jpg')

        cd 'C:UsersNikhilOneDriveDesktopskill lyncPractise'

end

%% For molecular weight

get = input('Enter the species name: ','s');

M = Mw(get)
The above written is the MATLAB code to determine the number of species , extract their respective coefficients, and calculate the enthalpy, entropy and the specific heat for all the species. Initially we are starting with the commands like clear all close all and clc. After clearing the previous program datas, we are opening the file using the command fopen by giving the permission to read the file which contains the data in it.
After opening the file, the first part of our program is to determine the number of species in the data file. This is to know the number of times to implement the for loop in further stages of program.
In the data file towards the end we can observe the numbering done, here by counting the number of 1’s we can determine the number of species. In order to do this, we are implementing the while loop to run till it is not the end of file by using the command feof (test for end of file) is used with logical (not) gate.
Using the command fgetl (which extracts the line from the data file) the lines are extracted and using the strsplit command the obtained string is splitted.
Once the string is splitted, the length of the string is determined by using length command, then using the above commands and strcmpi command in the if statement we are comparing whether the character at the end of the line is equal to 1. If the above condition is satisfied then the species count is incremented by 1, by doing this until the while loop is not broken we get the number of times the 1’s are present at the end of the line in the data file thereby determining the number of species in the data file,
Using the line’ fprintf('Number of species in data is %fnn',species)’ the total number of species is peinted in the command window.
The next part of the program is extracting the global temperatures, again we are opening the file using line ‘f1 = fopen('THERMO.dat','r');’. Then using the 1st fgetl the header data is extracted and the nexy line contains the temperature datas, after calling the line having the temperature datas. Using strsplit the temperature datas are splitted and using the command str2num the string is converted to numerical values, further assigning the temperature values to the respective low, mid and high values. In order to skip the three header lines the command fgetl is used 3 times.
The next part is extracting the coefficients for all the species here we are implementing the for loop to run for all the species.
In the data file it is observbed that all the species have 4 lines, where the first line has the species name and the local temperature values. The first character in that line represents the species, which is assigned by the line ‘s_name(i) = a(1)’.
The line containing the local temperatures has ‘G’ common in all lines, by determining the position of ‘G’ using the command findstr temperature positions can be determined by suitable calculations.
Using the line ‘p=strsplit(data(g_position:end),' ')’ the temperature line is splitted from the G till the end, further by using the command str2double and respective positions of temperatures the local minimum, maximum and mid temperatures are assigned.
The next three lines contains the coefficients, each coefficient has an E in it, so the position of the E is determined. The first coefficient starts from the 1st position of the line to the 1st E and the next three characters, so the line ‘cf1(i) = str2num(line1(1:sl1(1)+3));’ extracts the first coefficient in a character string which is converted to numeric value using str2num. using the same logic the 2nd coefficient starts where the first coefficients ends in other words the position after the 1st coefficient ends is the starting position for the 2nd coefficient. Similarly to the 3rd till the 5th coefficient as the line contains 5 coefficients and the next two lines having remaining coefficients. With the same logic all the remaining coefficients are determined.
The line ‘mkdir('File parsing plots',s_name{i})’ is to create a new folder where the plots obtained at the end are saved.
The next stage in the program is to calculate the required parameters using the respective coefficients and create the required plots.
A separate function is written (therm_calc)in order to obtained the required results
MATLAB FUNCTION FOR CALCULATION OF Cp, H & S
% Function to calculate Enthalpy

function [H,Cp,S] = therm_calc(cf1,cf2,cf3,cf4,cf5,cf6,cf7,cf8,cf9,cf10,cf11,cf12,cf13,cf14,tmid,trange)

R = 8.314;

for n=1:length(trange)

    t = trange(n);

  if (t>=tmid)

H(n) = (cf1+((cf2*t)/2)+((cf3*(t^2))/3)+((cf4*(t^3))/4)+((cf5*(t^4))/5)+(cf6/t))*R*t;

Cp(n) = R*(cf1+(cf2*t)+(cf3*(t^2))+(cf4*(t^3))+(cf5*(t^4)));

S(n) = R*((cf1*log(t))+(cf2*t)+((cf3*(t^2))/2)+((cf4*(t^3))/3)+((cf5*(t^4))/4)+cf7);

else

H(n) = (cf8+((cf9*t)/2)+((cf10*(t^2))/3)+((cf11*(t^3))/4)+((cf12*(t^4))/5)+(cf13/t))*R*t;

Cp(n) = R*(cf8+(cf9*t)+(cf10*(t^2))+(cf11*(t^3))+(cf12*(t^4)));

S(n) = R*((cf8*log(t))+(cf9*t)+((cf10*(t^2))/2)+((cf11*(t^3))/3)+((cf12*(t^4))/4)+cf14);

end
end
end
The above written is the function to calculate the required initially we are defining the inputs and outputs for the function. Our objective is to calculate the specific heat, enthalpy and entropy for lower to higher range of temperature. In order to get it we are creating an array of temperature from lower to upper local temperature using the linspace command. Since the calculation needs to be done for all the values of the temperature in the array we are implementing the for loop to execute till the end of temperature array.
In the 14 coefficients extracted the first 7 coefficients are for higher temperatures and the remaining are for lower temperatures so to achieve this condition an if statement is implemented where two set of equation are written and if the condition( if temperature is greater than the local mid temperature) satisfies the 1st set executes or else(if temperature is less than local mid temperature) the 2nd set executes.
We also have to determine the molecular weights for all the species so another function is created to determine the molecular weight of the species. The function to determine molecular weight of the species is mentioned below.
MOLECULAR WEIGHT FUNCTION
% Function to calculate Specific heat

function [Molecular_weight] = Mw(get)

gases = ['C', 'H', 'O', 'A', 'N'];

atomic_wt = [12.011, 1.00784, 15.999, 39.948, 14.0067];

Molecular_weight = 0;

for i=1:length(get)

    for j=1:length(gases)

        if strcmpi(get(i),gases(j))
           Molecular_weight = Molecular_weight+atomic_wt(j);
           position=j;
        end
    end
    n=str2double(get(i));

    if n>1
        Molecular_weight = Molecular_weight+atomic_wt(position)*(n-1);
    end

    end
In the above function, the characters of the species are stored separately as an array that represents the atoms and respectively another array having the atomic masses of those atoms is created.
The function takes the input as the name of the species and compares it to the arrays created of atoms and atomic masses and performs the operation specified in the function to determine the molecular weight of the species.
Another if statement is added to check for the numeric values between the species name which incase represents the species having more than one similar atoms ( ex., H2O)
In the next stages of our main program the plot commands are used to achieve the respective graphs. To save the obtained graphs in the directory created earlier the path where the folder exists needs to be defined. Once the path is defined the lines,
saveas(figure(1)','plot1 H vs T','jpg')
saveas(figure(2)','plot2 Cp vs T','jpg')
saveas(figure(3)','plot3 S vs T','jpg')
are used to save the plots with the specified name and the file type required. Since the for loop is still running the command should be given to come back to the folder where the program exists which is done in the next line of the main program.
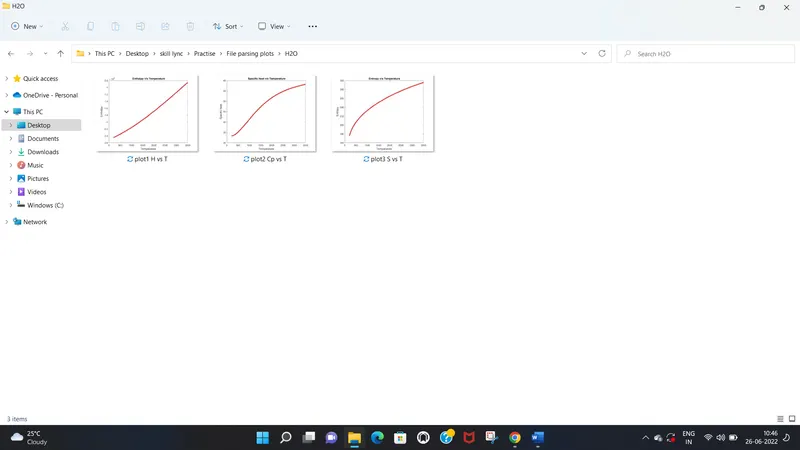
The image shows the file name of the species where the plots are saved once the program is executed.

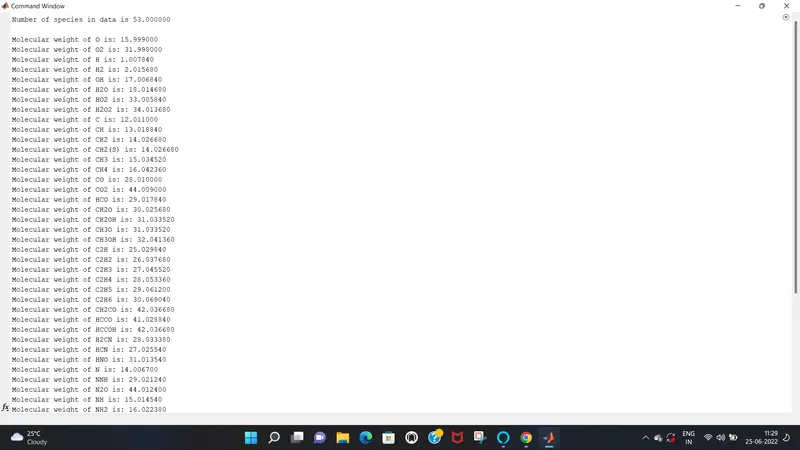
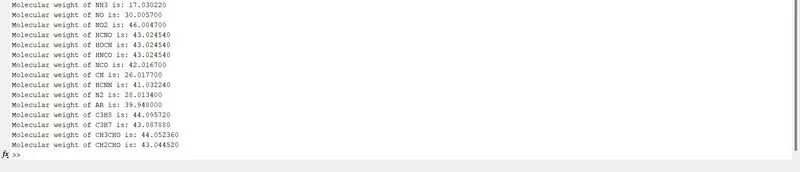
Using the fprintf command the molecular weights of all the species are displayed in the command window the screenshot of the output is shown below.
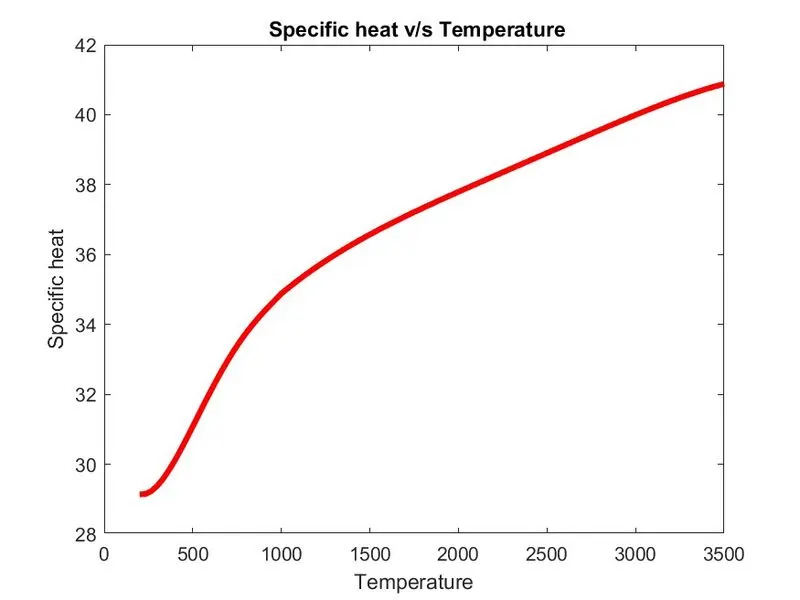
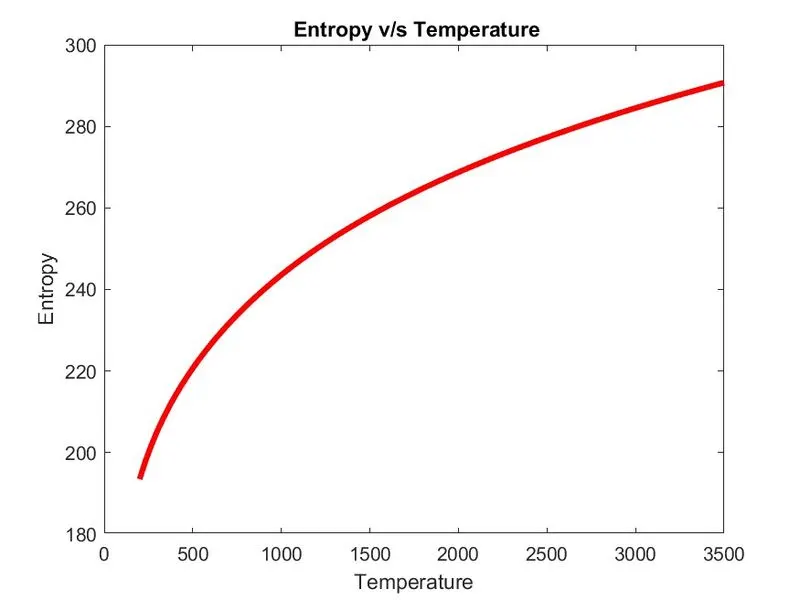
PLOTS FOR O2
PLOTS FOR N2
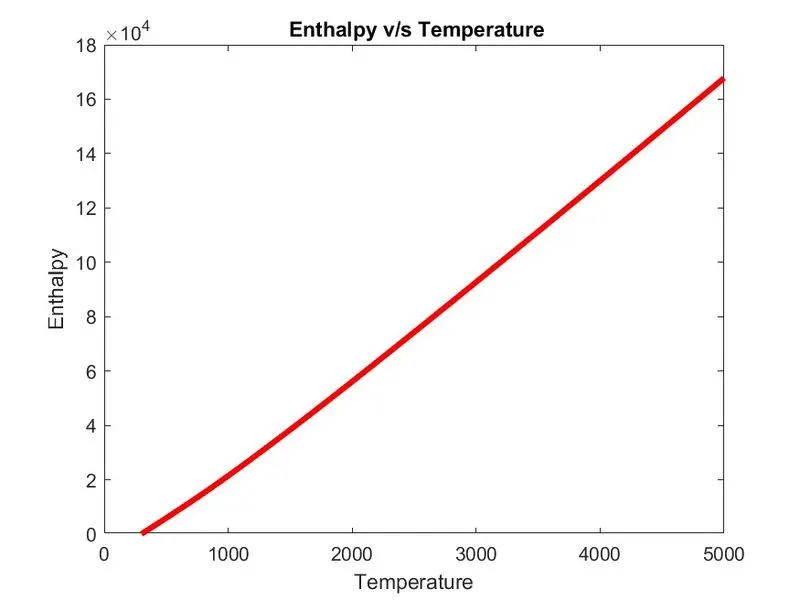
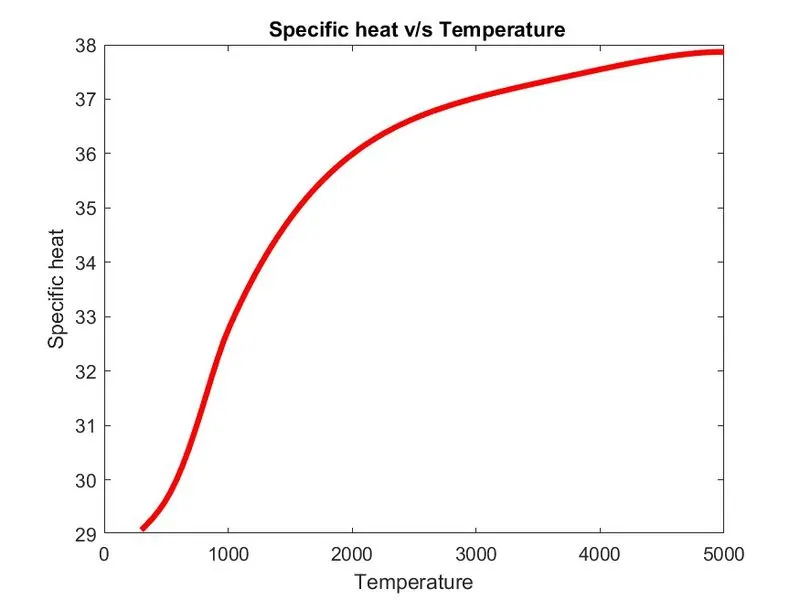
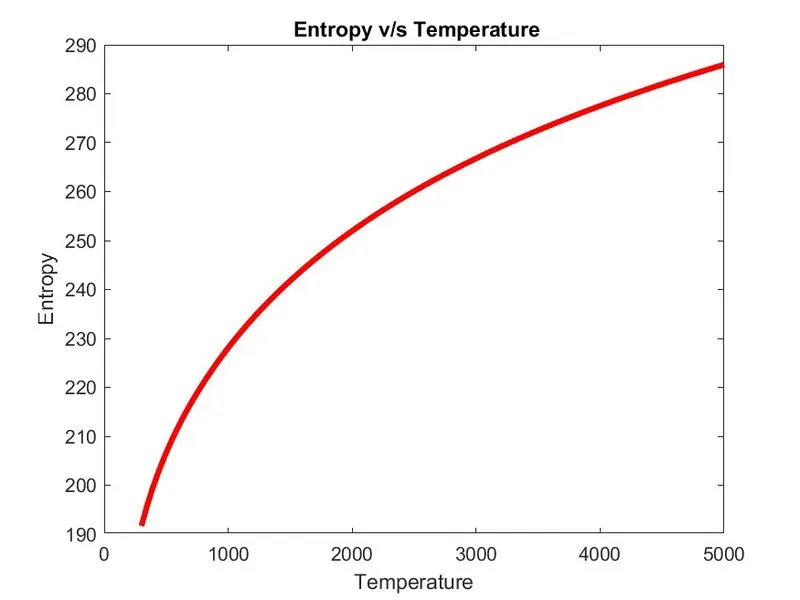
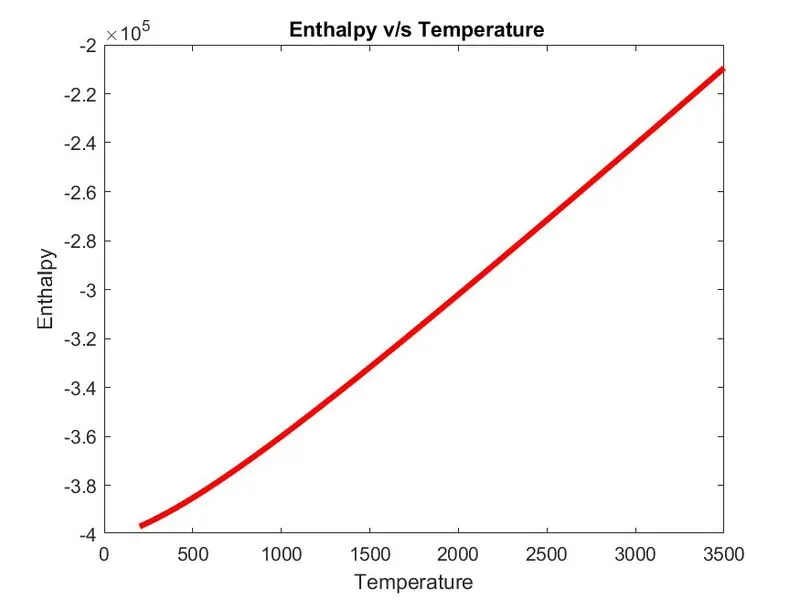
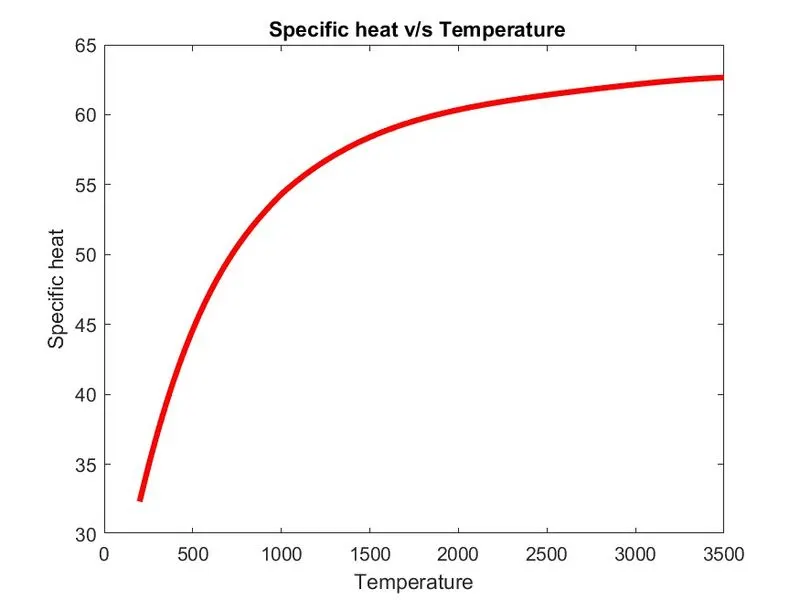
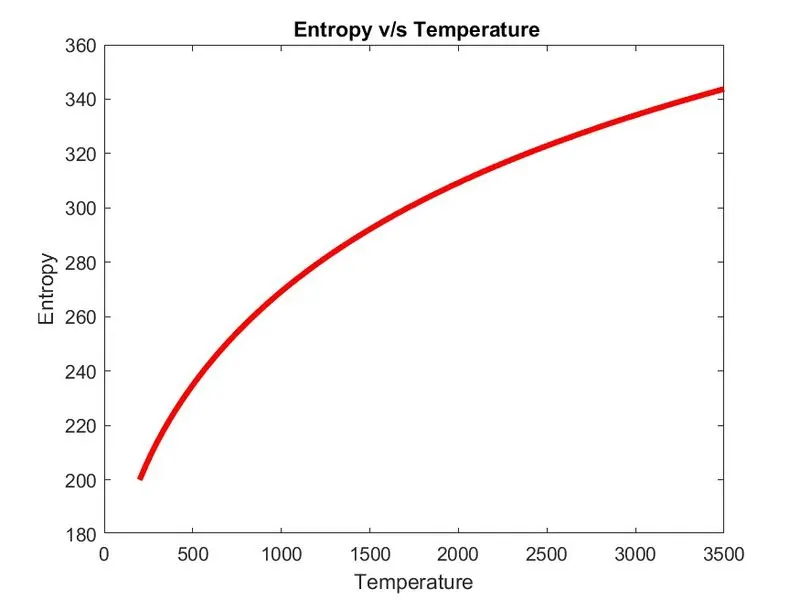
PLOTS FOR CO2
CONCLUSlON:
- The code takes the therm.dat as an input and provides the plots for different species in the data file.
- The code can be written in other ways, such as asking the user to input the name of the species and provide the results to that particular species as done at the last for molecular weight.
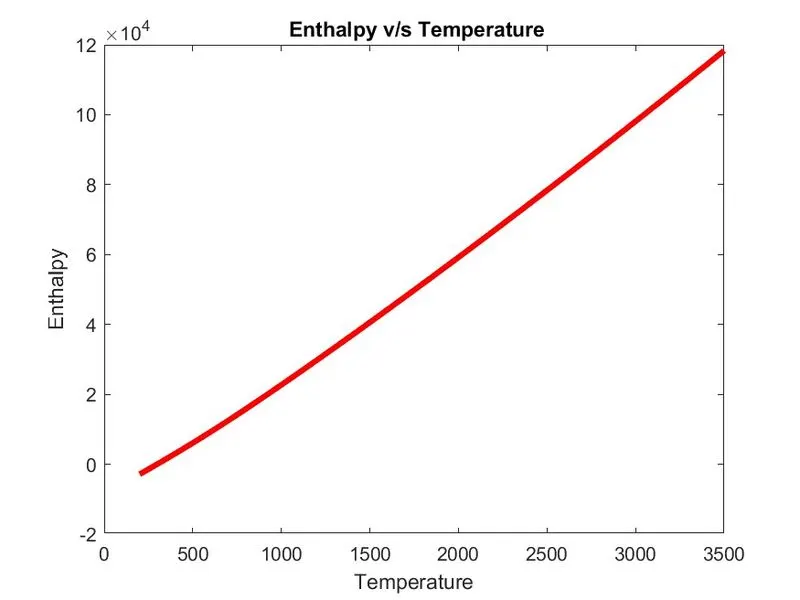
- All the plots obtained at the end are saved separately in a folder specified in the program and from the graph it is observed that Specific heat, enthalpy, and entropy rise with rise in temperatures.
REFERENCE
https://in.mathworks.com/help/matlab/ref/str2double.html
https://in.mathworks.com/help/matlab/ref/savefig.html#bt0w30o-1-H
https://in.mathworks.com/help/matlab/ref/strsplit.html#d123e1416430