Project
Aim
To carry out a system-level simulation of an all-terrain vehicle.
Objective
- Study system-level simulation of an all-terrain vehicle.
- Prepare a technical report explaining the model properties & comments on the results.
Solution
Introduction
Baja SAE is a Collegiate Design Series competition run by the Society of Automotive Engineers International (SAE International). Teams of students from universities all over the world design and build small off-road cars. The cars all have engines of the same specifications.
The goal in Baja SAE racing is to design, build and race off-road vehicles that can withstand the harshest elements of rough terrain. The vehicles used in Baja SAE racing are often similar in appearance to dune buggies.
Simulink Model (Open Loop System)
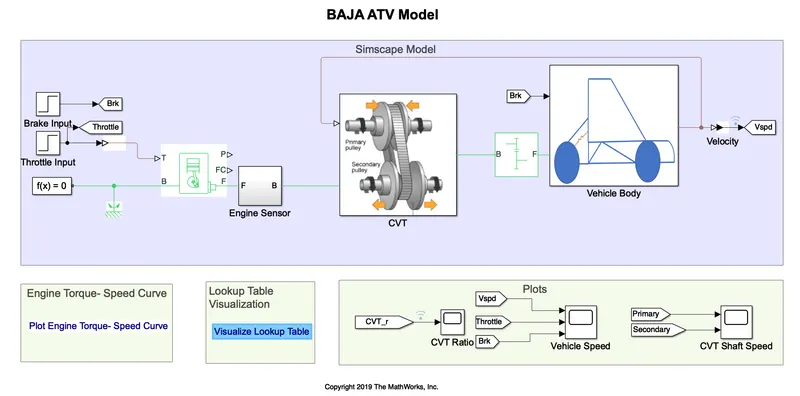
Following is a simple simulink model of a Baja SAE vehicle.
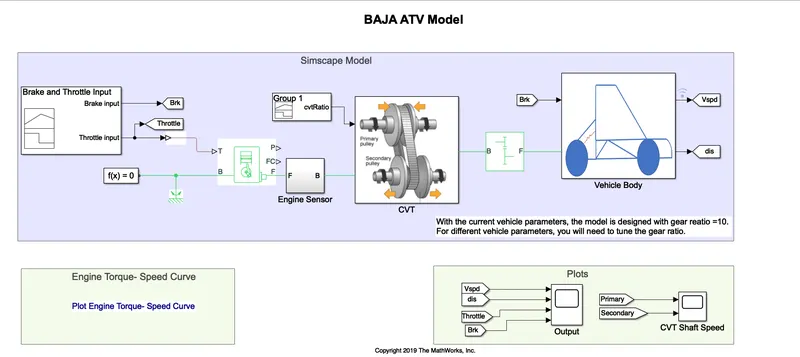
The three main systems that can be mathematically modelled and analysed in a Baja SAE vehicle is
- Engine
- Transmission
- Vehicle Dynamics which includes Vehicle body, suspension and tyre.
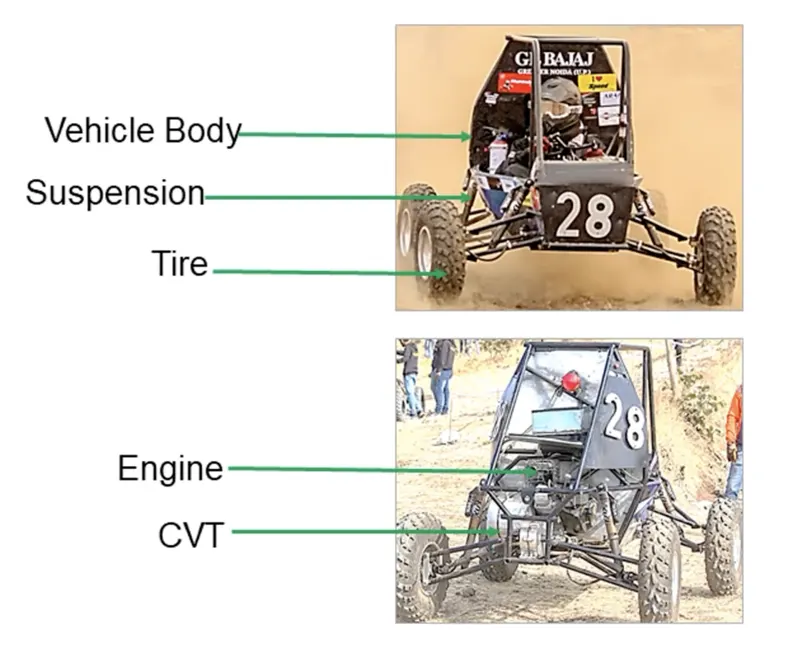
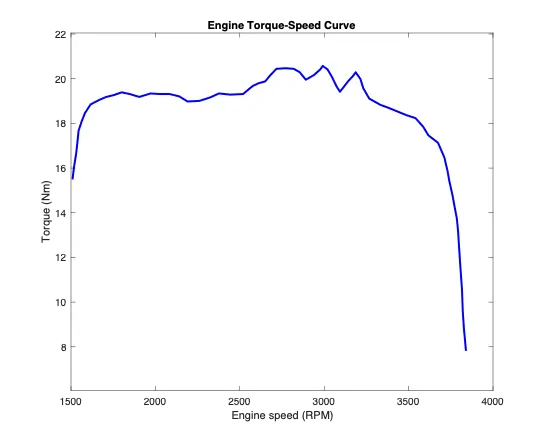
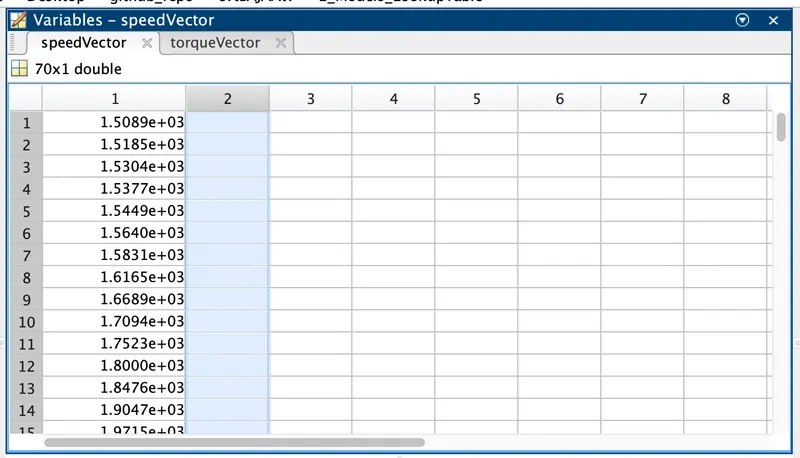
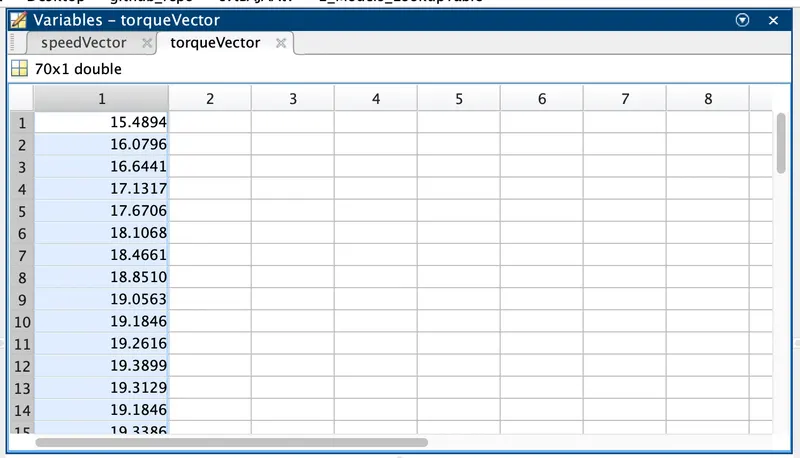
Engine : In simulink, to represent a Baja SAE standard Engine, a generic engine block is used to simulate the characteristics of a Baja Engine. The speed and torque characteristics of a standard baja engine is extracted using a method called 'Data Point Extraction' using a feature of simulink called 'Grab It' and the extracted data can be fed into the speed vector and torque vector fields respective of a generic engine block.
Following is the graph of engine characteristics of a Standard Baja Engine
Speed Vector Data
Torque Vector Data
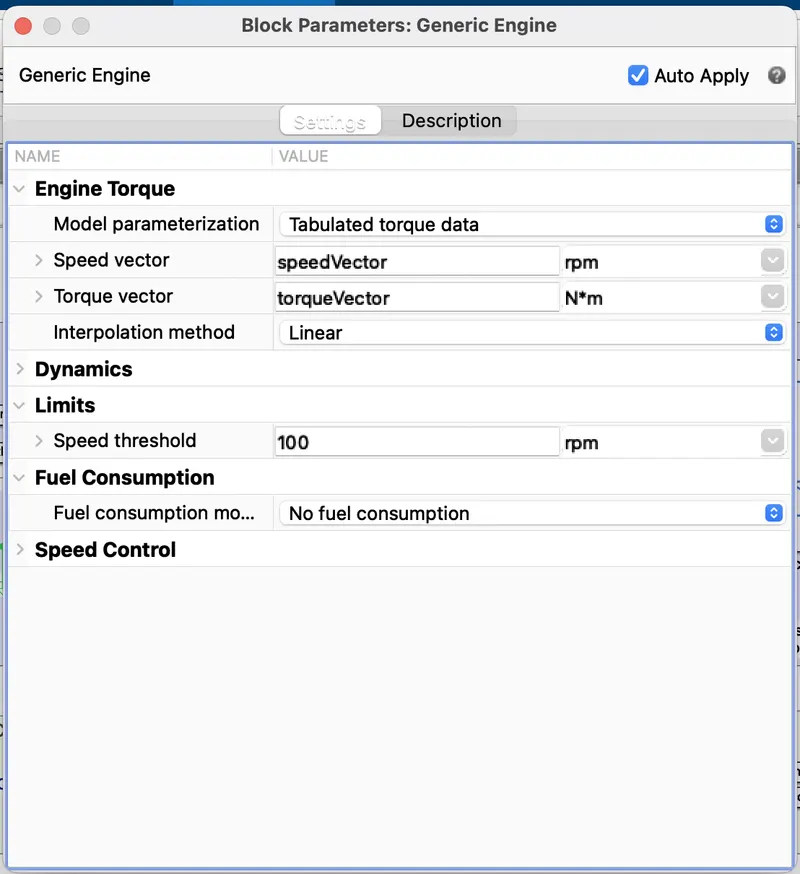
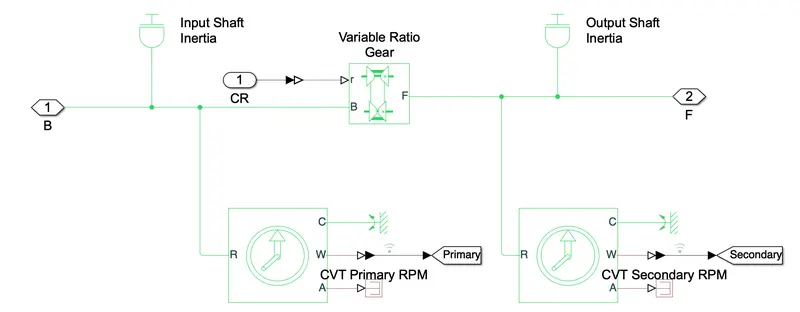
Transmission : For baja, a simple automatic transmission system such as CVT is used to meet the demand of varying driving conditions. Engines have a rpm range in which they deliver power at their best efficiency. The goal of a CVT is to modify the transmission ratio continuously to keep the engine in that desired range extracting power and torque efficiently. A CVT consists of three principle components such as a primary conical clutch, a secondary conical clutch and a belt. Both, the primary and the secondary clutch has a stationary sheave and a moving sheave which reacts to the centrifugal force. A CVT can continuously change the gear ratio by varying the effective diameter of the primary and the secondary conical clutch.
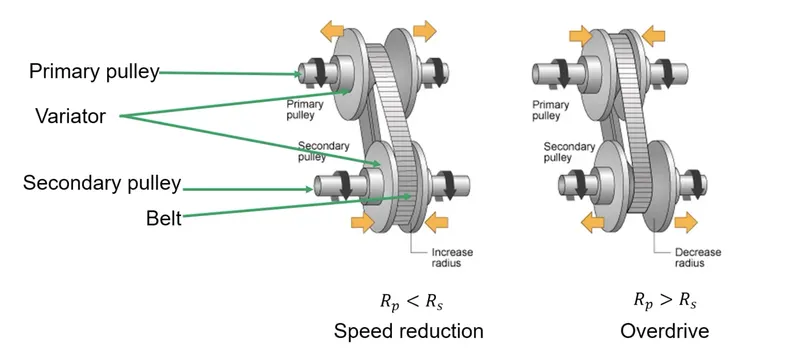
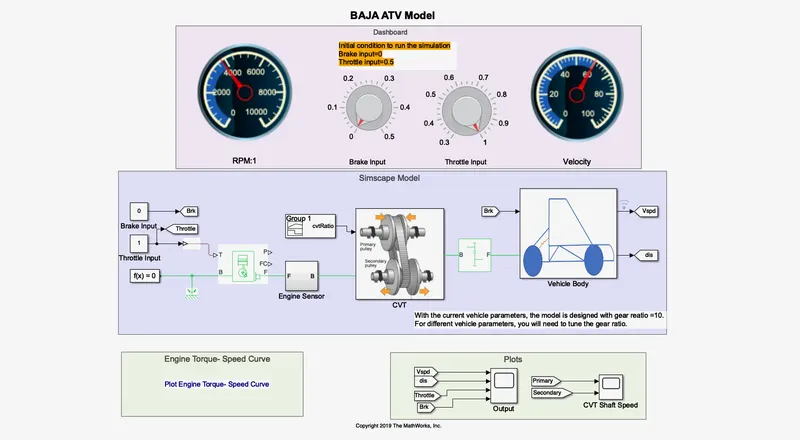
To simulate the CVT in simulink, a variable ratio gear block is used as shown. The primary and the secondary pulley is represented using input and output inertia block respectively. Sensor block are used to log the primary and secondary pulley rpm.
Vehicle Dynamics: The vehicle dynamics of the Baja vehicle can be modelled in simulink/simscape using blocks such as vehicle body block, tyre block and brake block with their parameters as input to these blocks.
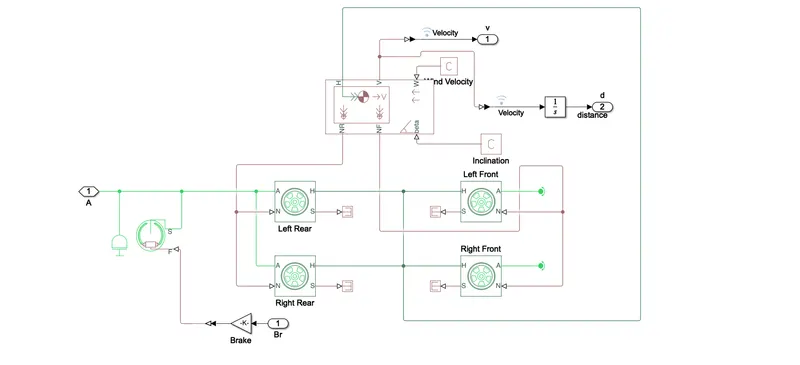
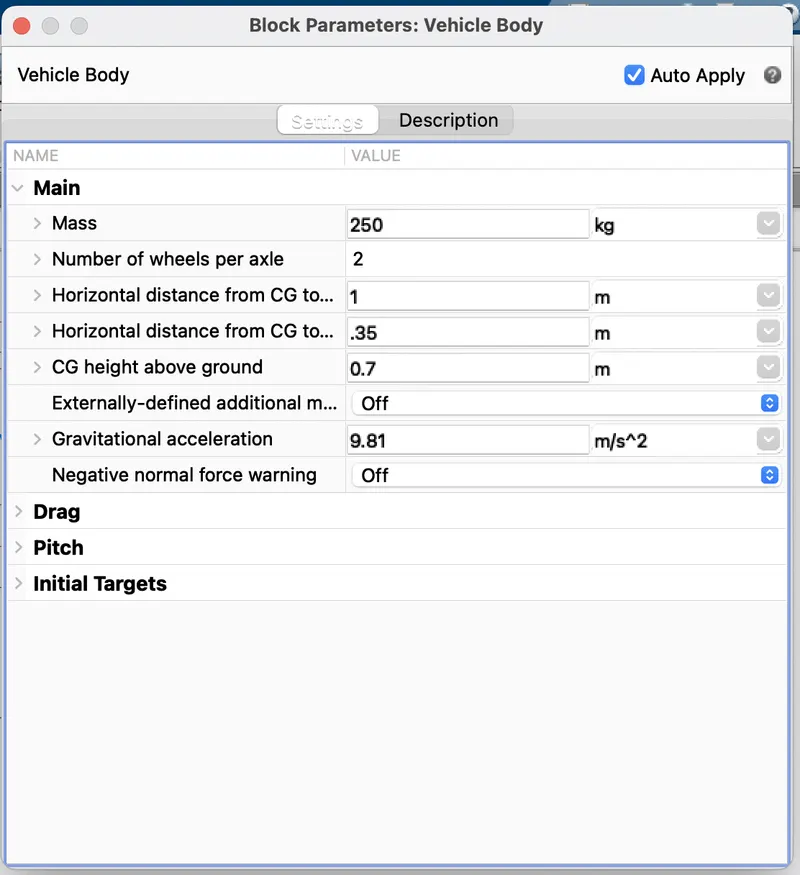
Vehicle body representation of a Baja vehicle.
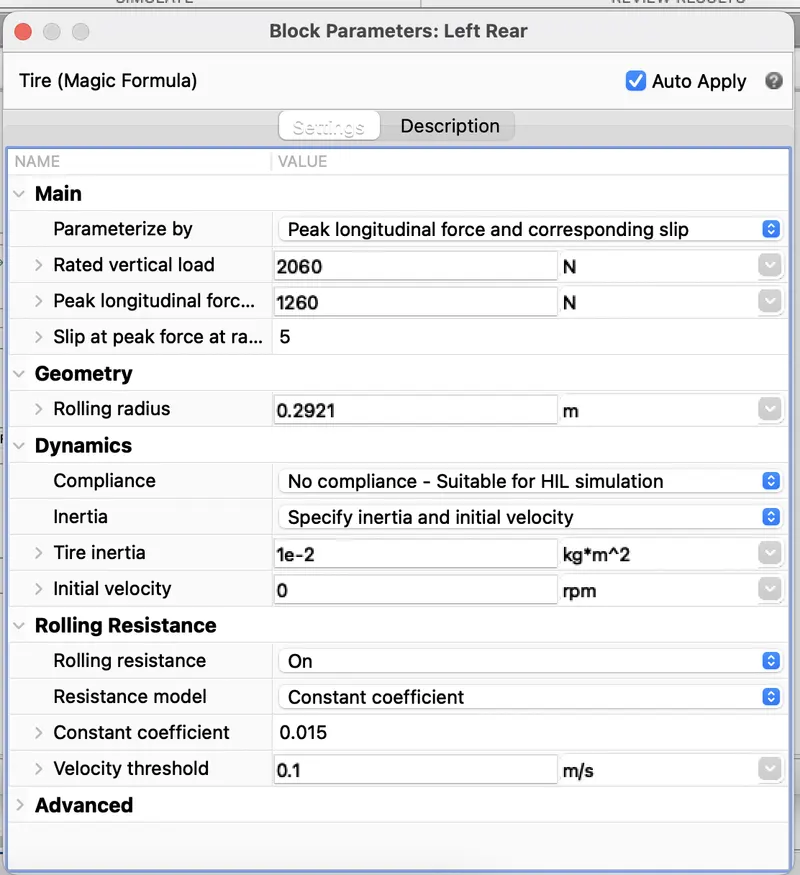
Tyre representation of a Baja vehicle
Simulink/Simscape Blocks Used are:
- Signal Builder
- Generic Engine Block
- RPM sensor block
- Variable Ratio Gear Block
- Inertia Block
- Simple Gear Block
- Vehicle Body Block
- Tyre Block
- Brake Block
- Integrator Block
- Gain Block
- Ramp Block
- Scope
Explanation
Part 1
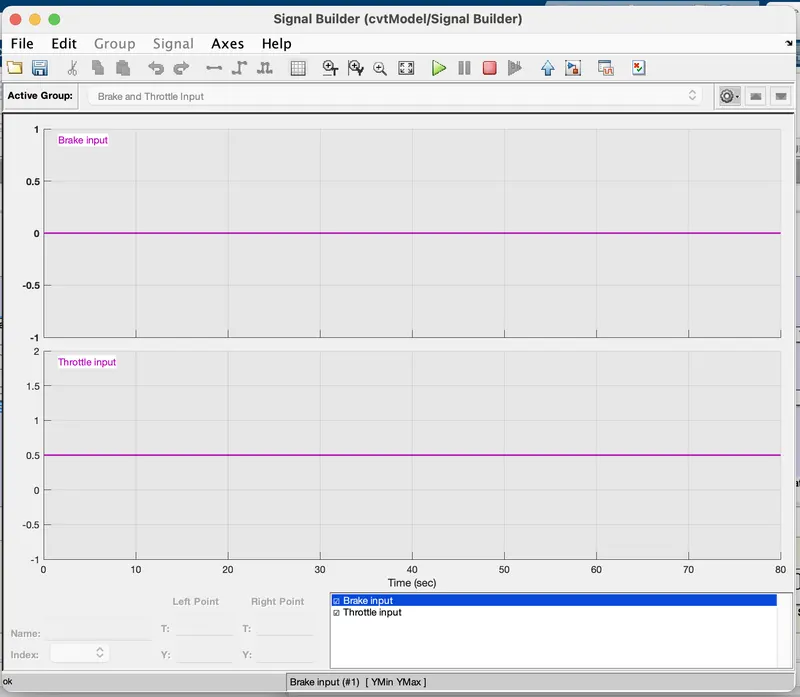
The given model is simulated with zero brake input and 50% throttle input built using signal builder as shown. with following vehicle parameters:
- mass: 250 kg
- final gear ratio : 10
- Horizontal distance from CG to front axle: 1 m
- Horizontal distance from CG to rear axle: 0.35 m
- Distance of CG from ground : 0.7 m
- Rated vertical load : 2060 N
- Peak Longitudinal force at rated load : 1260 N
- Rolling radius : 0.2921 m
Various combination of parameters can be changed and analysed to develop a optimised solution for the vehicle and those parts based on the simulation parameters can be fixed for final manufacturing of the vehicle.
In our case the simulation is carried out for 3 different final drive ratio to determine the best optimal drive ratio for this vehicle.
For final gear ratio of 5, the following result were obtained
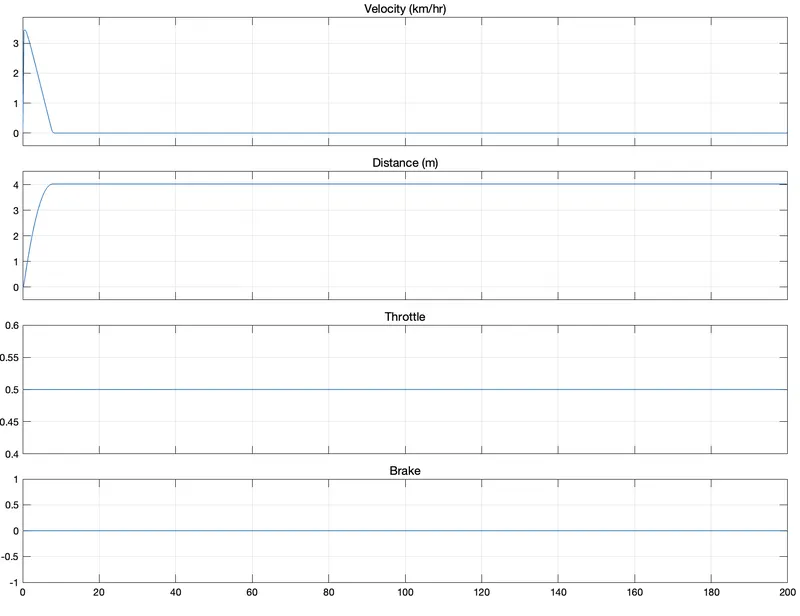
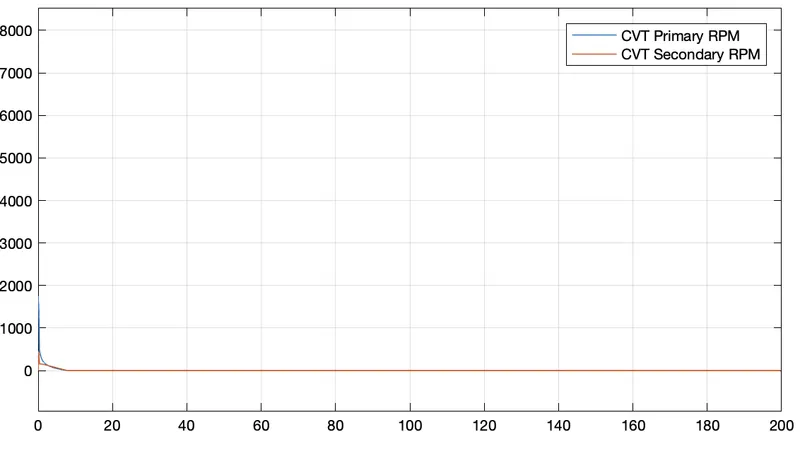
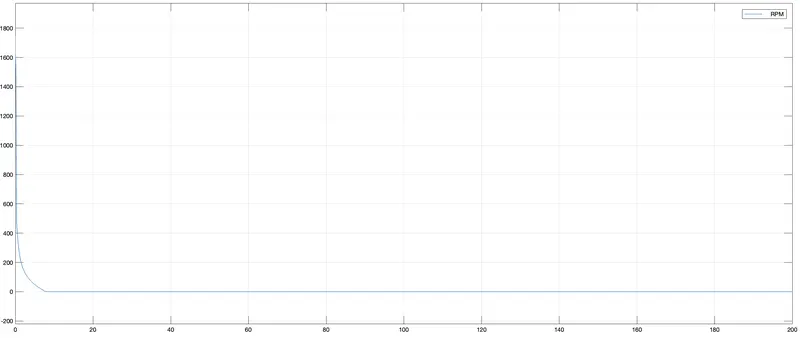
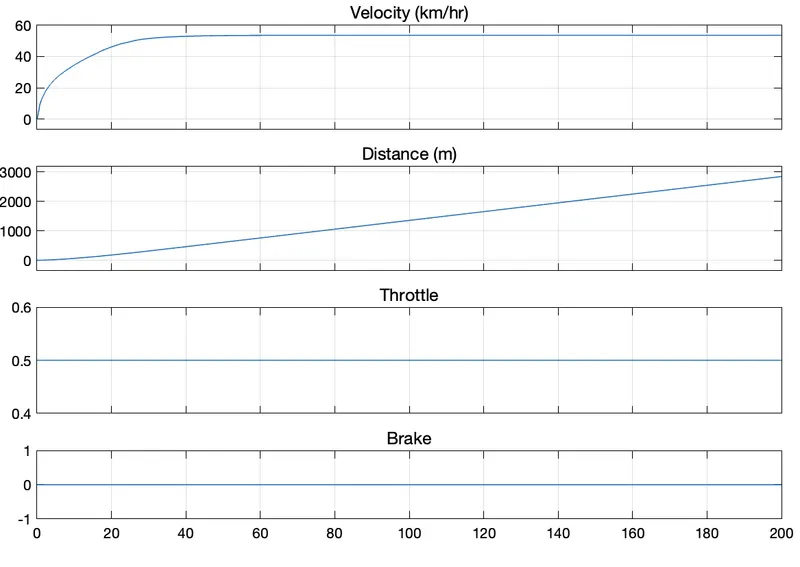
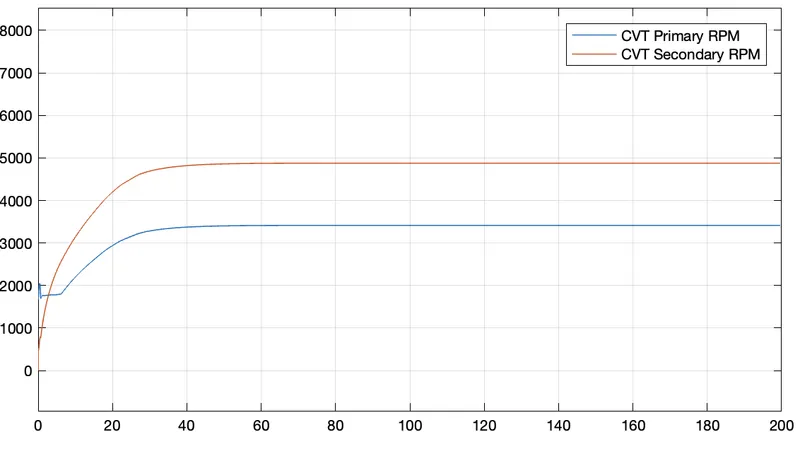
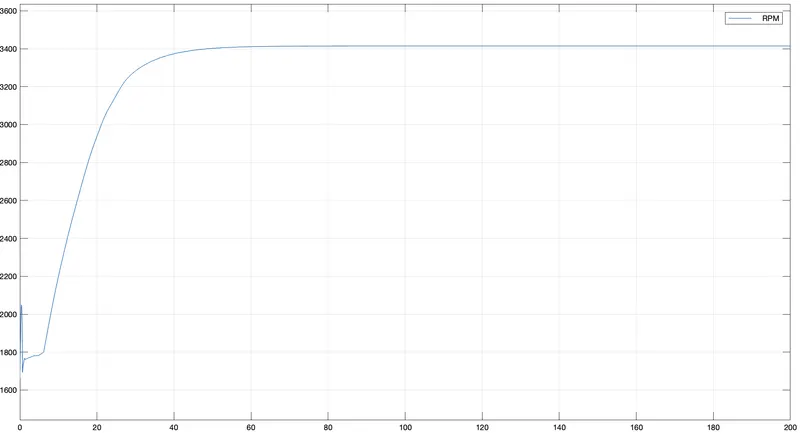
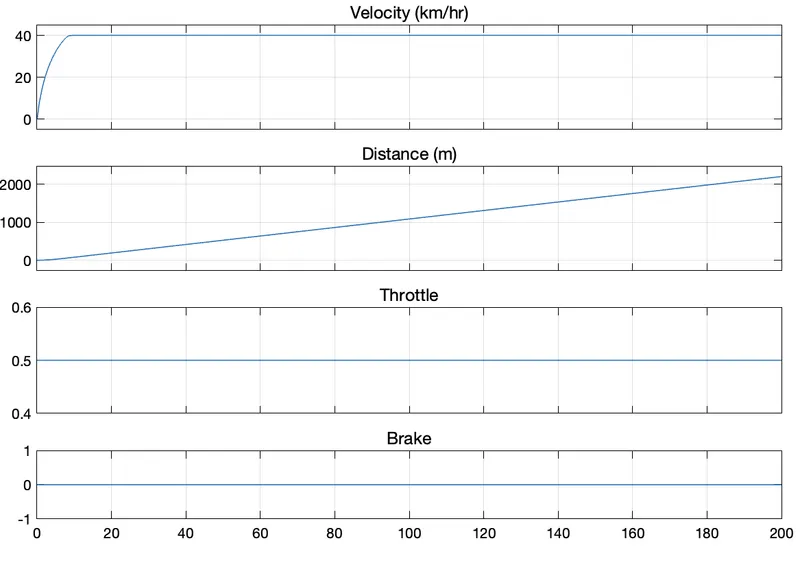
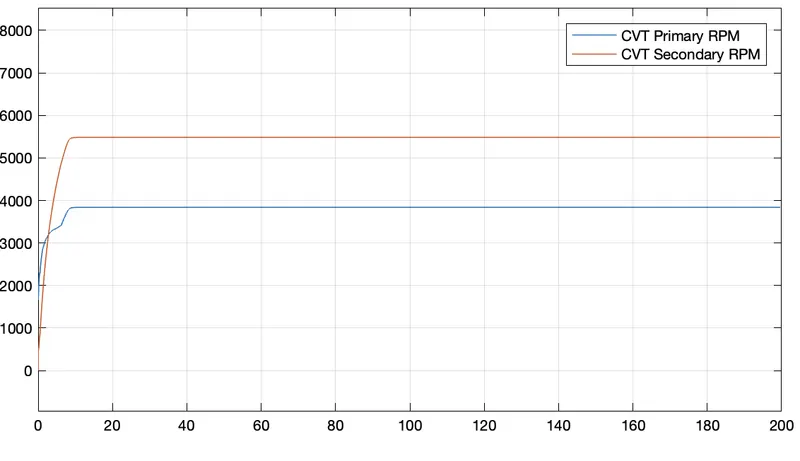
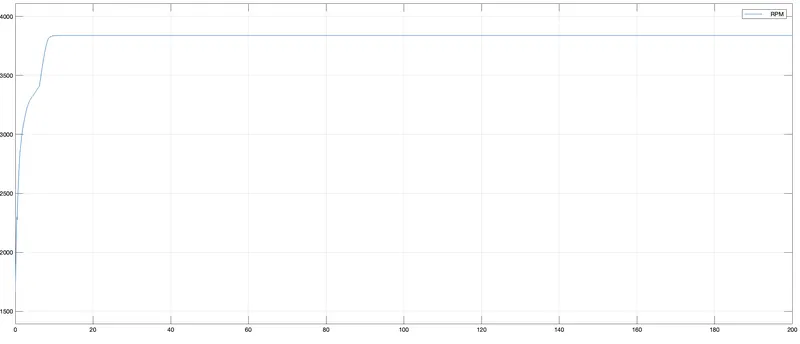
From the above results we can see that for final drive ratio 10, the vehicle speed and engine rpm are operating at the optimal level. For final drive ratio 5, the vehicle is behaving abnormal, reason can be mechanical failure. For final drive ratio of 15, we can observe that velocity of the vehicle is 40 km/hr which is less that that of final drive ratio 10, which is about 55 km/hr at 3400 rpm (Engine). Also the engine rpm for the third result is 3800 rpm which is about at the redline of the engine and running engine at that rpm may cause engine failure or damage in engine internals. We can further optimise and simulate the ATV model by changing various parameters and generating results to determine the best vehicle dynamics and extract best performance before actually manufacturing the vehicle.
Dashboard Model
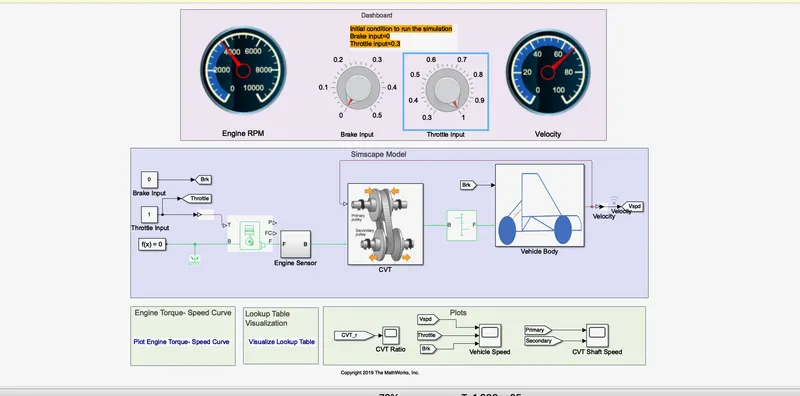
Further the model can be visualised using dashboard such as Engine RPM gauge, Vehicle Speed Gauge, Throttle Input control and brake input control to change the parameters in real time and visualise RPM and speed in realtime.
Part 2
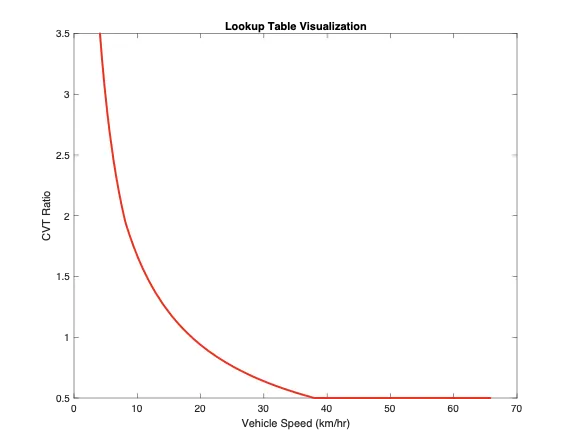
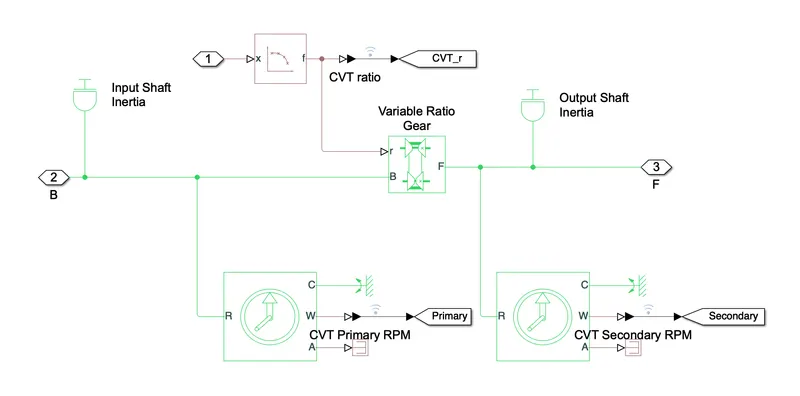
Since the CVT ratio is dependent on vehicle velocity. To simulate the model with realistic approach of the CVT model, we can use lookup table in our simulation model to simulate the variation of CVT ratio wrt vehicle speed generated from the previous open loop simulation as shown.
Simulink Model (Close Loop System)
Following changes were made to the CVT block to vary the ratio according to the speed of the vehicle. A look up table block is used to define the variation of the CVT ratio.
Following results were generated
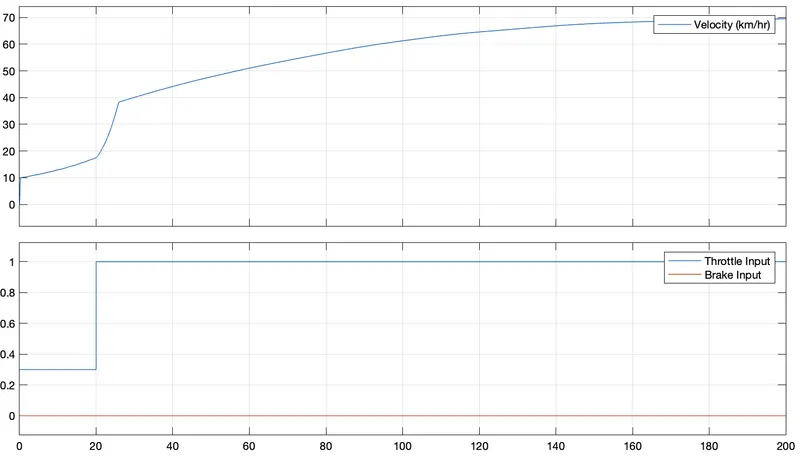
Form the above result we can see that for zero throttle, that is the engine is idling causing the vehicle to move with some speed. As soon as the throttle input is on or full throttle the speed of the vehicle climbs upto 70 kmph smoothly which signifies the continuous proper operation of the CVT as desired.
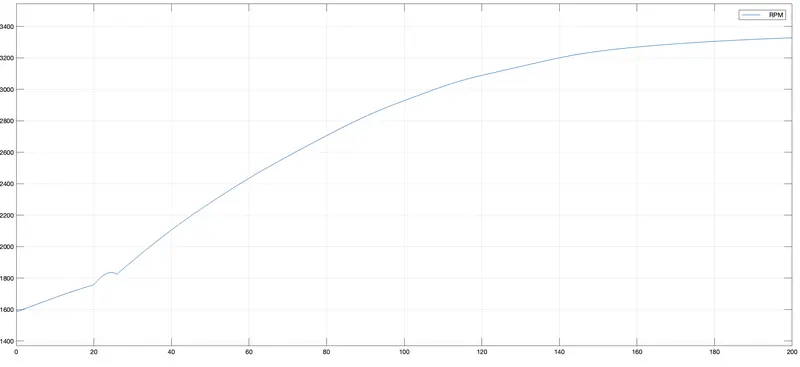
The Engine RPM plot shows the smooth increase of the engine RPM upto the redline of the engine at about 3300 RPM achieving a maximum speed of 70 kmph.
Dashboard Model