Project 1 - Parsing NASA thermodynamic data
Project 1 - Parsing NASA thermodynamic data
NASA came up with polynomials that can be used to evaluate thermodynamic properties such as Cp, H and S. They have also documented the co-efficients that are required to evaluate these polynomials for 1000+ species.
Aim
To write a function that extracts the 14 coefficients and calculates the enthalpy, entropy and specific heats for all the species in the data file.
Objective
- Calculate the molecular weight of each species and display it in the command window.
- Plot the Cp, Enthalpy and Entropy for the local temperature range (low temperature : high temperature) specific for each species.
- Save the plots as images with appropriate names and dump them in separate folders for each species with suitable name. All these should be generated automatically.
- The main program that you will submit will just take the "THERMO.dat" file as an input and generate Cp, H and S plots.
Solution
Theory
fileId=fopen(filename,permission')
opens the file with the type of access specified by 'permission'.
tline=fgetl(fileId)
reads the line from the file
fclose=(fileId)
closes the file
We will be using Nasa's Thermodynamic data for this project.
The NASA polynomials have the form:
`\frac{Cp}{R}=a_{1}+a_{2}\times T+a_{3}\times T^{2}+a_{4}\times T^{3}+a_{5}\times T^{4}`
`\frac{H}{RT}=a_{1}+a_{2}\times\frac{T}{2}+a_{3}\times \frac{T^{2}}{3}+a_{4}\times \frac{T^{3}}{4}+a_{5}\times \frac{T^{4}}{5}+\frac{a_{6}}{T}`
`\frac{S}{R}=a_{1}\times ln(T)+a_{2}\times T+a_{3}\times \frac{T^{2}}{2}+a_{4}\times \frac{T^{3}}{3}+a_{5}\times \frac{T^{4}}{4}+a_{7}`
Here R is the universal gas constant, T is the temperature
where a1, a2, a3, a4, a5, a6, and a7 are the numerical coefficients supplied in NASA thermodynamic files.
The first 7 numbers starting on the second line of each species entry (five of the second line and the first two of the third line) are the seven coefficients (a1 through a7, respectively) for the high-temperature range (above 1000 K, the upper boundary is specified on the first line of the species entry). and the following seven numbers are the coefficients (a8 through a14, respectively) for the low-temperature range (below 1000 K)
File : https://drive.google.com/file/d/1AikCHDlz9s_fu8whE81qee_GD4AyYpCP/view?usp=sharing
Writing a code in OCTAVE to import,read,and parse data and to generate plots
clear all
close all
clc

%Open a file with read permission
f1=fopen('THERMO.dat','r');

%Reading Line
Heading=fgetl(f1);

%Extracting Global Temperature
global_temp = fgetl(f1);
globaltemp=strsplit(global_temp,' ');

global_low_temp = str2num(globaltemp{2});
global_mid_temp = str2num(globaltemp{3});
global_high_temp = str2num(globaltemp{4});
global_temp_range=[global_low_temp global_mid_temp global_high_temp]

fgetl(f1);
fgetl(f1);
fgetl(f1);

%Universal gas constant
R=8.3145

%store current position/line
pos=ftell(f1);

%Calcuate no of species present in the file.
n=1;
l1= fgetl(f1);

while strcmp(l1,'END')==0
  l1=fgetl(f1);
  n=n+1;
end
 no_of_species=(n-1)/4

%Take back to saved position/line
fseek(f1,pos);
disp(' ')

%Loop to iterate over the number of speicies data

  for i=1:no_of_species
      l1 = fgetl(f1);
      l1_data=strsplit(l1,' ');
      species=l1_data{1};
      var=char(species);

      Species=l1_data{1};

      %Extracting local tempperature of species

      lowtemp=str2num(l1_data{end-3});
      midtemp=str2num(l1_data{end-1});
      hightemp=str2num(l1_data{end-2});

      localtemp=[lowtemp midtemp hightemp];

      l2 = fgetl(f1);
      l3 = fgetl(f1);
      l4 = fgetl(f1);

       %Extracting coefficients

       a=strfind(l2,'E');
       c1=str2num(l2(1:a(1)+3));
       c2=str2num(l2(a(1)+4:a(2)+3));
       c3=str2num(l2(a(2)+4:a(3)+3));
       c4=str2num(l2(a(3)+4:a(4)+3));
       c5=str2num(l2(a(4)+4:a(5)+3));

       b=strfind(l3,'E');
       c6=str2num(l3(1:a(1)+3));
       c7=str2num(l3(a(1)+4:a(2)+3));
       c8=str2num(l3(a(2)+4:a(3)+3));
       c9=str2num(l3(a(3)+4:a(4)+3));
       c10=str2num(l3(a(4)+4:a(5)+3));

       c=strfind(l4,'E');
       c11=str2num(l4(1:a(1)+3));
       c12=str2num(l4(a(1)+4:a(2)+3));
       c13=str2num(l4(a(2)+4:a(3)+3));
       c14=str2num(l4(a(3)+4:a(4)+3));


       temp=linspace(lowtemp,hightemp,500);

       %Calculating specific heat

        for z=1:length(temp)
                if temp(z)>midtemp
                  cp(z)=R*(c1 + c2*temp(z) + c3*temp(z)^2 + c4*temp(z)^3 + c5*temp(z)^4);
                  H(z)=R*temp(z)*(c1 + c2*temp(z) /2 + c3*temp(z)^2 /3 + c4*temp(z)^3 /4 + c5*temp(z)^4 /5 + c6/temp(z));
                  S(z)=R*(c1*log(temp(z)) + c2*temp(z) + c3*temp(z)^2 /2 + c4*temp(z)^3 /3 +c5*temp(z)^4 /4 +c7);
                else
                  cp(z)=R*(c8 + c9*temp(z) + c10*temp(z)^2 + c11*temp(z)^3 + c12*temp(z)^4);
                  H(z)=R*temp(z)*(c8 + c9*temp(z) /2 + c10*temp(z)^2 /3 + c11*temp(z)^3 /4 + c12*temp(z)^4 /5 + c13/temp(z));
                  S(z)=R*(c8*log(temp(z)) + c9*temp(z) + c10*temp(z)^2 /2 + c11*temp(z)^3 /3 +c12*temp(z)^4 /4 +c14);
                end
        endfor

        %Calculating Molecular Weight of the species

        mw=0;

        atoms=['H','C','N','O','A'];

        atomicweight=[1.0079,12.01,14.0067,16,39.95];

           for m=1:length(Species)
             for n=1:length(atoms)
               if strcmpi(Species(m),atoms(n))
                 mw=mw+atomicweight(n);
                 x=n;
               endif

             endfor
             num=str2double(Species(m));

             if num>1
               mw=mw+atomicweight(x)*(num-1);
             endif
           endfor

          %Printing Molecular weight on the screen

          fprintf('Molecular mass of %s = %f \n',Species,mw)

          %Save Current directory path in a variable for later use
          current_directory=pwd;

          %Creating new directory with species name
          mkdir(species)

          %Changing directory to the new directory created
          cd(species)

          %Plotting Specific heat plot
          figure(1)
          plot(temp,cp,"linewidth",2,"color",'b')
          xlabel("Temperature K")
          ylabel("Specific Heat KJ/Kg-K")
          title(sprintf('Temperature vs Specific Heat for %s',Species),"fontsize",10)
          grid on

          savename1=(sprintf('Temperature vs Specific Heat for [%s].png',species)  );
          saveas(figure(1),savename1)

          %Plotting enthalpy plot

          figure(2)
          plot(temp,H,"linewidth",2,"color",'r')
          xlabel("Temperature K")
          ylabel("Enthalpy KJ")
          title(sprintf('Temperature vs Enthalpy for %s',Species),"fontsize",10)
          grid on

          savename2=(sprintf('Temperature vs Enthalpy for [%s].png',species)  );
          saveas(figure(2),savename2)

          %Plotting entropy plot

          figure(3)
          plot(temp,S,"linewidth",2,"color",'g')
          xlabel("Temperature K")
          ylabel("Entropy J/k")
          title(sprintf('Temperature vs Entropy for %s',Species),"fontsize",10)
          grid on

          savename3=(sprintf('Temperature vs Entropy for [%s].png',species)  );
          saveas(figure(3),savename3)

          %Going back to root directory

          cd(current_directory)

   endfor

   fclose(f1);
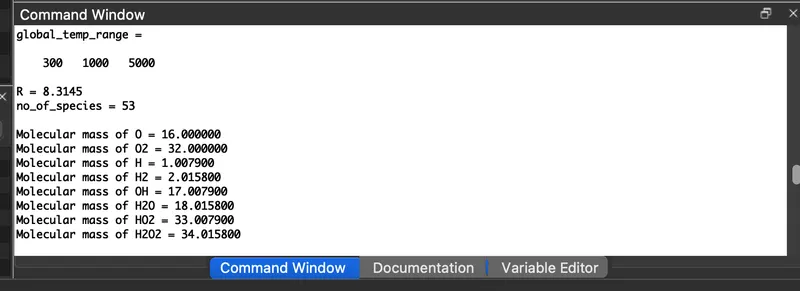
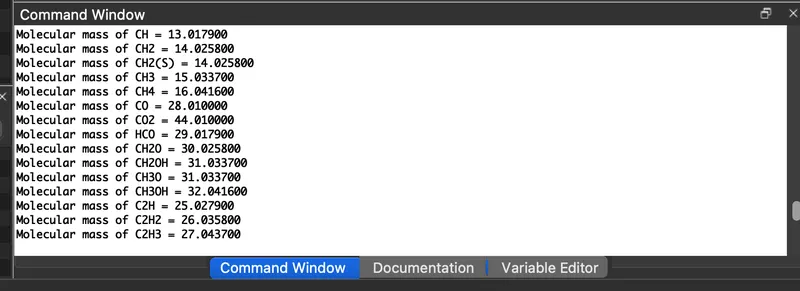
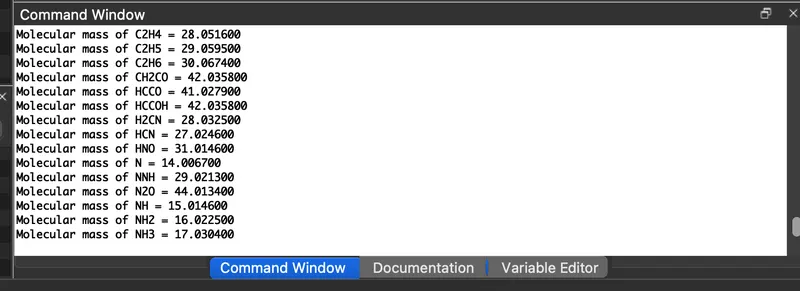
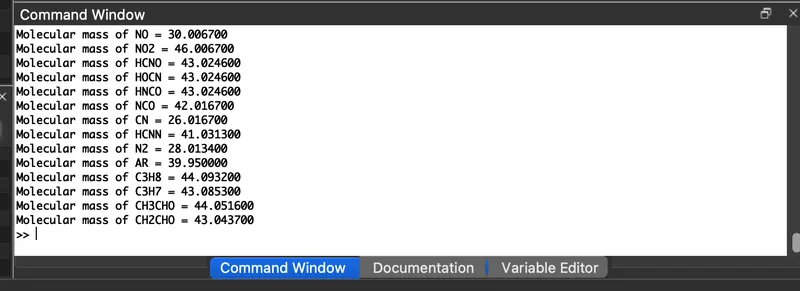
This program calculates the molecular weight of the species in the given file and generates plots for 'Specific Heat', 'Enthalpy' and 'Entropy' wrt Temperature for all the species.


Modifying our code to accept input from user and parse data to generate species specific plots
clear all
close all
clc

%Open a file with read permission
f1=fopen('THERMO.dat','r');

%Reading Line
Heading=fgetl(f1);

%Extracting Global Temperature

global_temp = fgetl(f1);
globaltemp=strsplit(global_temp,' ');

global_low_temp = str2num(globaltemp{2});
global_mid_temp = str2num(globaltemp{3});
global_high_temp = str2num(globaltemp{4});
global_temp_range=[global_low_temp global_mid_temp global_high_temp]

fgetl(f1);
fgetl(f1);
fgetl(f1);

%store current position/line
pos=ftell(f1);

%Universal gas constant
R=8.3145

%Calcuate no of species present in the file.
n=1;
l1= fgetl(f1);

while strcmp(l1,'END')==0
  l1=fgetl(f1);
  n=n+1;
end
 no_of_species=(n-1)/4

%Take back to saved position/line
fseek(f1,pos);
disp(' ')


%Display Species Available in the file

for i=1:no_of_species

    l1 = fgetl(f1);
    l1_datas=strsplit(l1,' ');
    species=l1_datas{1};
    disp(char(species))
    fgetl(f1);
    fgetl(f1);
    fgetl(f1);
end
disp(' ')

%Take back to saved position/line
fseek(f1,pos);


%Take Input from the user

a1 = input('Enter Species:','s');


%loop to iterate for all the species

  for j=1:no_of_species
      l1 = fgetl(f1);
      l1_data=strsplit(l1,' ');
      species=l1_data{1};
      var=char(species);

        %Comparing input value with the species available
        if strcmpi(a1,var)==1

            Species=l1_data{1}

            %Calling local temp function
            local_temp_range=calc_local_temp_range(l1_data);

            lowtemp=local_temp_range(1);
            midtemp=local_temp_range(2);
            hightemp=local_temp_range(3);


            l2 = fgetl(f1);
            l3 = fgetl(f1);
            l4 = fgetl(f1);

            %Calling coefficient function
            c=calc_coefficient(l2,l3,l4);
            temp=linspace(lowtemp,hightemp,500);

            %Calling specific heat calculation function
            specific_heat=calc_specific_heat(c,midtemp,temp,R);

            %Calling enthalpy calculationfunction
            enthalpy=calc_enthalpy(c,midtemp,temp,R);

            %Calling entropy calculation function
            entropy=calc_entropy(c,midtemp,temp,R);

            %Calling molecular weight calculation function
            molwt=calc_mol_weight(Species);
            fprintf('Molecular mass of %s = %f \n',Species,molwt)

            %Save Current directory path in a variable for later use
            current_directory=pwd;

            %Creating new directory with species name
            mkdir(species)

            %Changing directory to the new directory created
            cd(species)

            %Plotting Specific heat plot
            figure(1)
            plot(temp,specific_heat,"linewidth",2,"color",'b')
            xlabel("Temperature K")
            ylabel("Specific Heat KJ/Kg-K")
            title(sprintf('Temperature vs Specific Heat for %s',Species),"fontsize",10)
            grid on

            savename1=(sprintf('Temperature vs Specific Heat for [%s].png',species)  );
            saveas(figure(1),savename1)


            %Plotting enthalpy plot
            figure(2)
            plot(temp,enthalpy,"linewidth",2,"color",'r')
            xlabel("Temperature K")
            ylabel("Enthalpy KJ")
            title(sprintf('Temperature vs Enthalpy for %s',Species),"fontsize",10)
            grid on

            savename2=(sprintf('Temperature vs Enthalpy for [%s].png',species)  );
            saveas(figure(2),savename2)

            %Plotting entropy plot
            figure(3)
            plot(temp,entropy,"linewidth",2,"color",'g')
            xlabel("Temperature K")
            ylabel("Entropy J/k")
            title(sprintf('Temperature vs Entropy for %s',Species),"fontsize",10)
            grid on

            savename3=(sprintf('Temperature vs Entropy for [%s].png',species)  );
            saveas(figure(3),savename3)

            %Going back to root directory
            cd(current_directory)

            break;

      endif

      fgetl(f1);
      fgetl(f1);
      fgetl(f1);

   endfor

fclose(f1);
Function to read local temperature range
function [localtemp] = calc_local_temp_range(l1_data)

  lowtemp=str2num(l1_data{end-3});
  midtemp=str2num(l1_data{end-1});
  hightemp=str2num(l1_data{end-2});

  localtemp=[lowtemp midtemp hightemp];

end
Function to read all the coefficients
function [coeff]=calc_coefficient(l2,l3,l4)
            a=strfind(l2,'E');
            c1=str2num(l2(1:a(1)+3));
            c2=str2num(l2(a(1)+4:a(2)+3));
            c3=str2num(l2(a(2)+4:a(3)+3));
            c4=str2num(l2(a(3)+4:a(4)+3));
            c5=str2num(l2(a(4)+4:a(5)+3));

            b=strfind(l3,'E');
            c6=str2num(l3(1:a(1)+3));
            c7=str2num(l3(a(1)+4:a(2)+3));
            c8=str2num(l3(a(2)+4:a(3)+3));
            c9=str2num(l3(a(3)+4:a(4)+3));
            c10=str2num(l3(a(4)+4:a(5)+3));

            c=strfind(l4,'E');
            c11=str2num(l4(1:a(1)+3));
            c12=str2num(l4(a(1)+4:a(2)+3));
            c13=str2num(l4(a(2)+4:a(3)+3));
            c14=str2num(l4(a(3)+4:a(4)+3));

            coeff=[c1 c2 c3 c4 c5 c6 c7 c8 c9 c10 c11 c12 c13 c14];
end
Function to calculate Specific Heat
function Cp=calc_specific_heat(c,midtemp,temp,R)

  for z=1:length(temp)
                if temp(z)>midtemp
                  cp(z)=R*(c(1) + c(2)*temp(z) + c(3)*temp(z)^2 + c(4)*temp(z)^3 + c(5)*temp(z)^4);

                else
                  cp(z)=R*(c(8) + c(9)*temp(z) + c(10)*temp(z)^2 + c(11)*temp(z)^3 + c(12)*temp(z)^4);

                end
   endfor
  Cp=cp;
 end
Function to calculate Enthalpy
function H=calc_enthalpy(c,midtemp,temp,R)

  for z=1:length(temp)
                if temp(z)>midtemp

                  h(z)=R*temp(z)*(c(1) + c(2)*temp(z) /2 + c(3)*temp(z)^2 /3 + c(4)*temp(z)^3 /4 + c(5)*temp(z)^4 /5 + c(6)/temp(z));

                else

                  h(z)=R*temp(z)*(c(8) + c(9)*temp(z) /2 + c(10)*temp(z)^2 /3 + c(11)*temp(z)^3 /4 + c(12)*temp(z)^4 /5 + c(13)/temp(z));

                end
   endfor
  H=h;
 end
Function to calculate Entropy
function S=calc_entropy(c,midtemp,temp,R)

  for z=1:length(temp)
                if temp(z)>midtemp
                  s(z)=R*(c(1)*log(temp(z)) + c(2)*temp(z) + c(3)*temp(z)^2 /2 + c(4)*temp(z)^3 /3 +c(5)*temp(z)^4 /4 +c(7));
                else
                  s(z)=R*(c(8)*log(temp(z)) + c(9)*temp(z) + c(10)*temp(z)^2 /2 + c(11)*temp(z)^3 /3 +c(12)*temp(z)^4 /4 +c(14));
                end
   endfor
  S=s;
 end
Function to calculate Molecular Weight
function mw = calc_mol_weight(Species)

  mw=0;

atoms=['H','C','N','O','A'];

  atomicweight=[1.0079,12.01,14.0067,16,39.95];

 for i=1:length(Species)
   for j=1:length(atoms)
     if strcmpi(Species(i),atoms(j))
       mw=mw+atomicweight(j);
       x=j;
     endif

   endfor
   num=str2double(Species(i));

   if num>1
     mw=mw+atomicweight(x)*(num-1);
   endif


 endfor
end
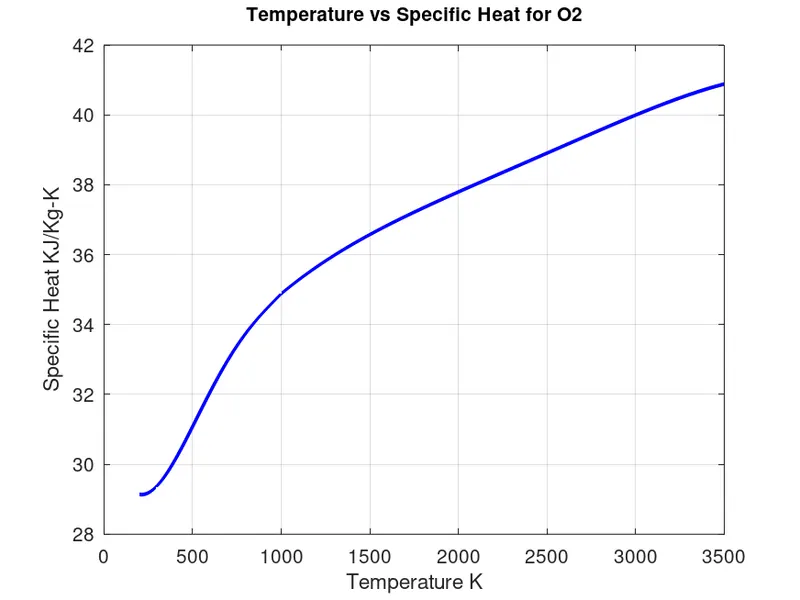
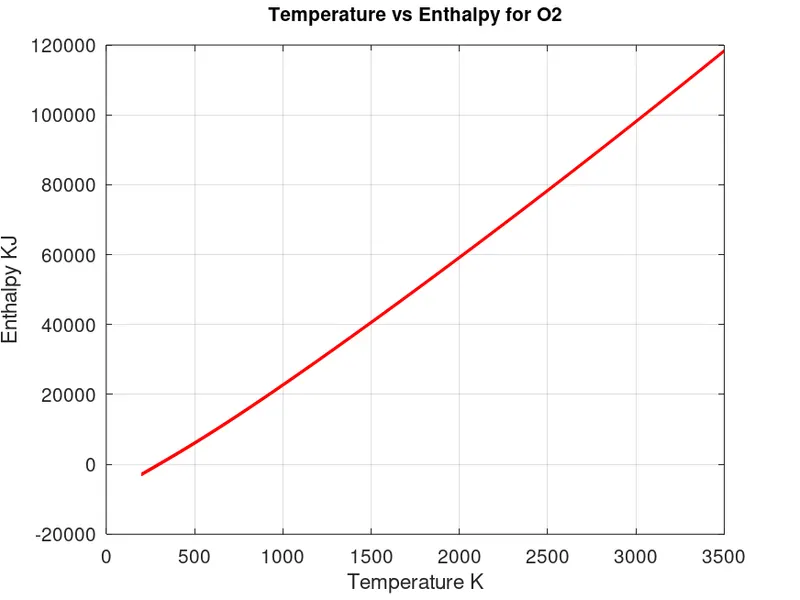
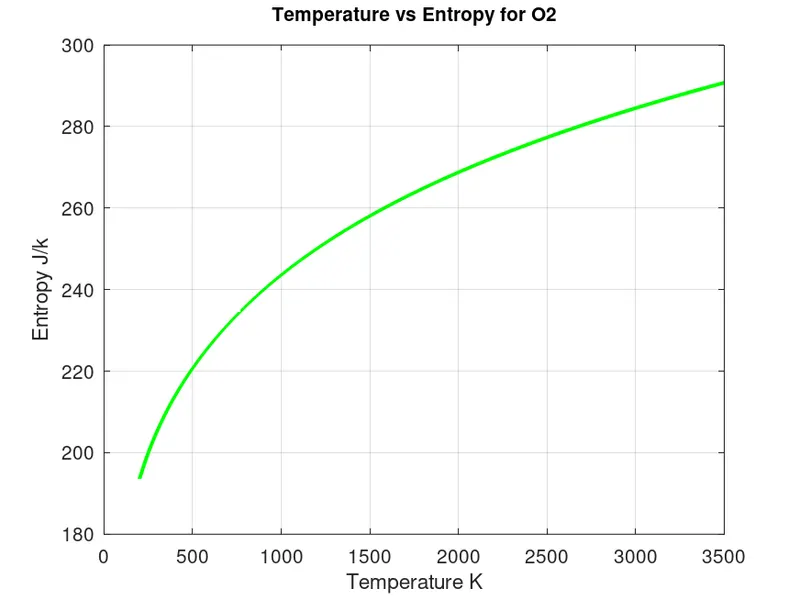
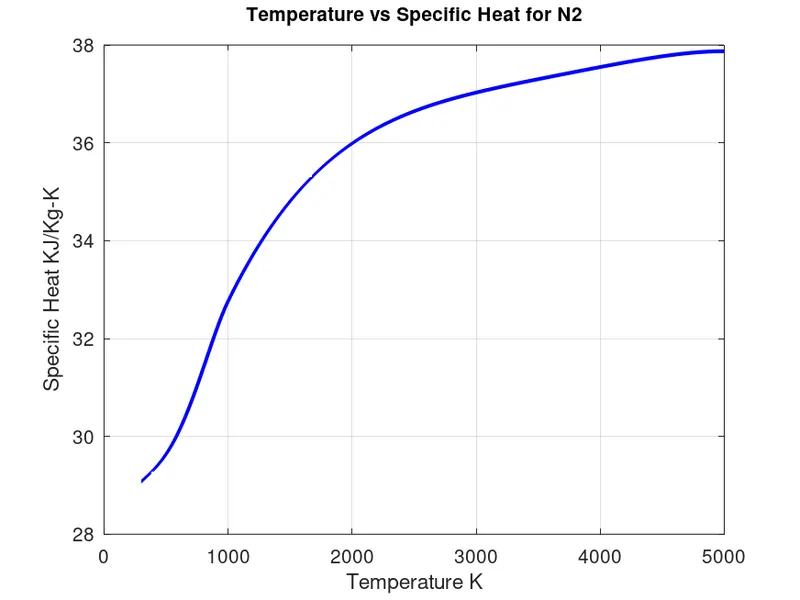
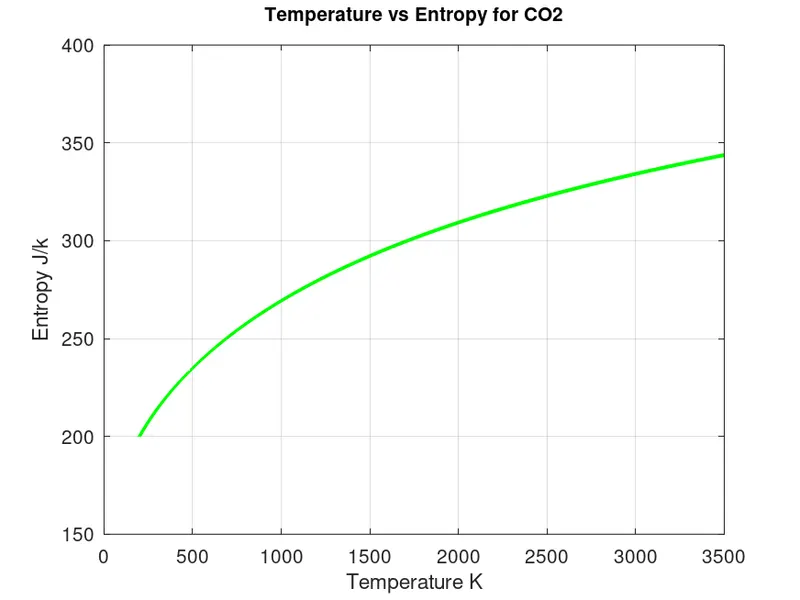
The above program takes input form the user such as o2, N2, and Co2, and generates plot and displays molecular weight for the respective species.
Plots for 'o2'
Plots for 'N2'
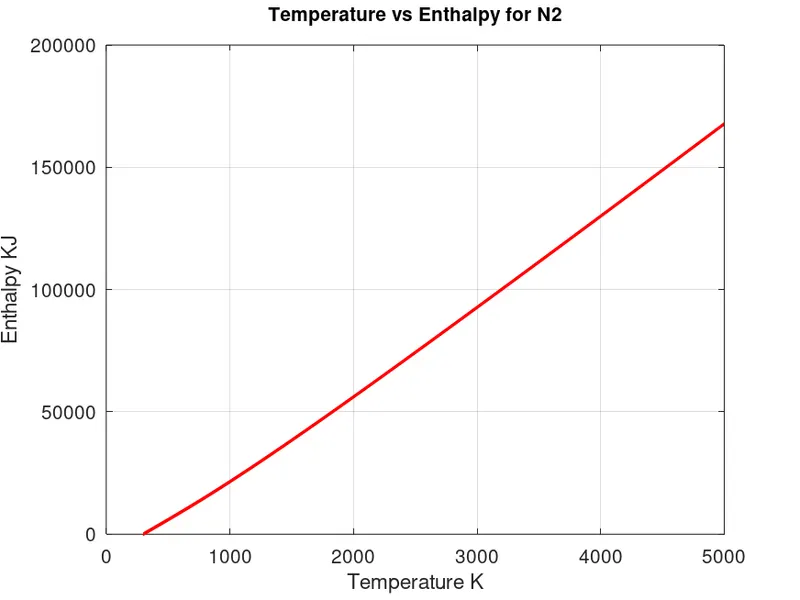
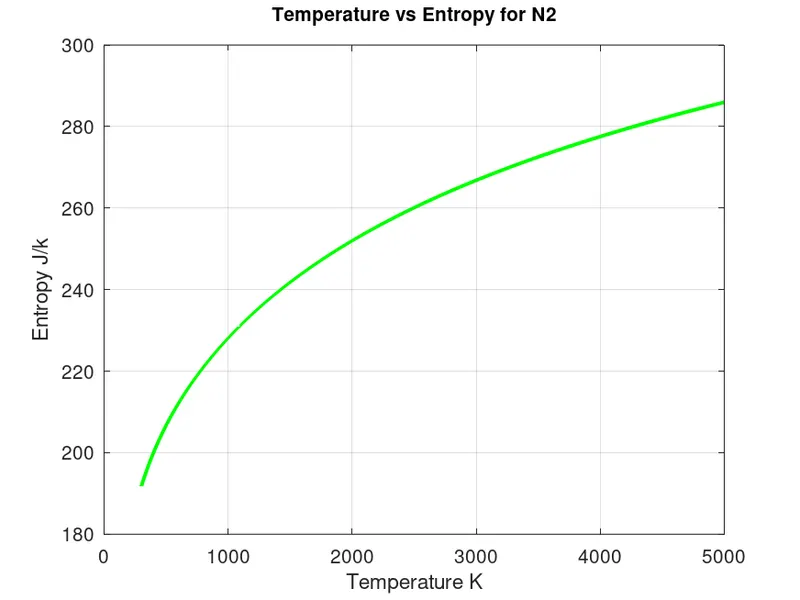
Plots for 'Co2'
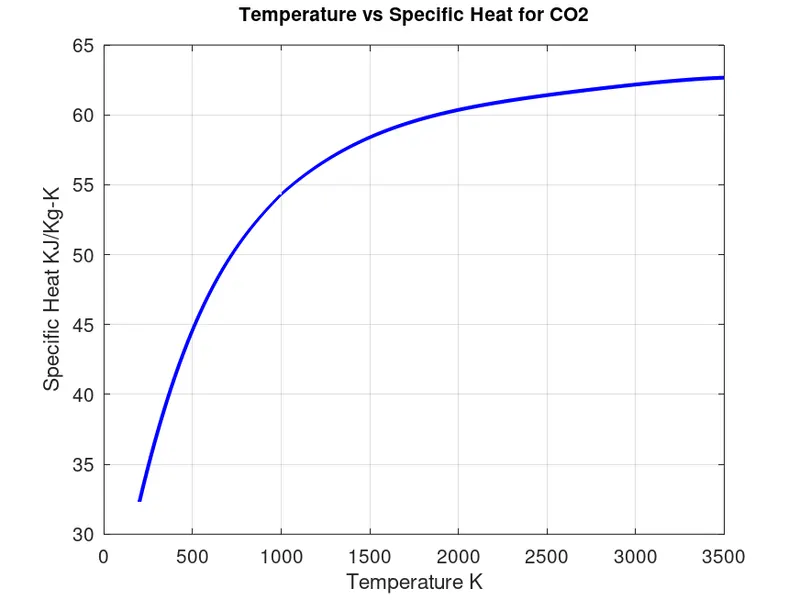
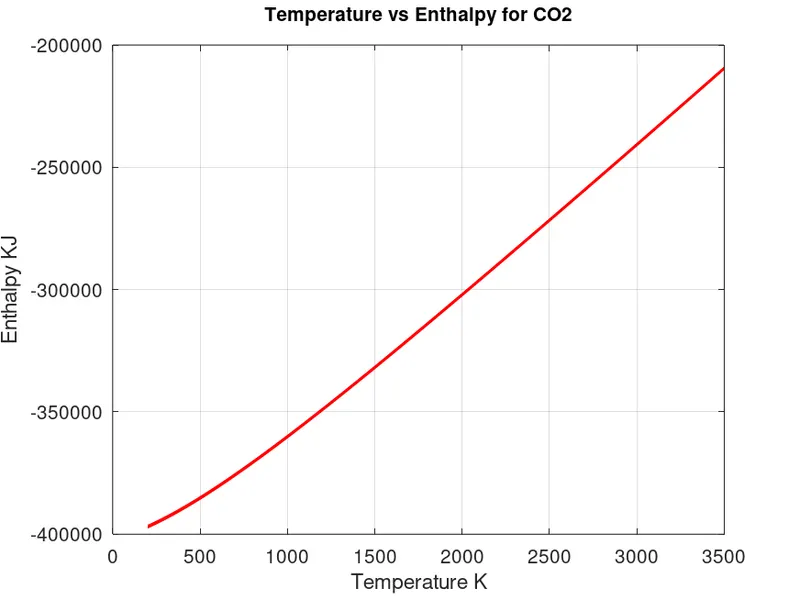
Step Wise Explanation of the code
Step 0
Initializing the octave:
These commands are used to clear the variables and plots stored in the memory from previous programs.
clear all
close all
clc
Step 1
Opening and reading file in octave:
%Open a file with read permission
f1=fopen('THERMO.dat','r');

%Reading Line
Heading=fgetl(f1);
Step 2
Extracting Global Data and defining constants:
%Extracting Global Temperature
global_temp = fgetl(f1);
globaltemp=strsplit(global_temp,' ');

global_low_temp = str2num(globaltemp{2});
global_mid_temp = str2num(globaltemp{3});
global_high_temp = str2num(globaltemp{4});
global_temp_range=[global_low_temp global_mid_temp global_high_temp]

fgetl(f1);
fgetl(f1);
fgetl(f1);

%Universal gas constant
R=8.3145

%store current position/line
pos=ftell(f1);
Step 3
%Calculate no of species present in the file.
n=1;
l1= fgetl(f1);

while strcmp(l1,'END')==0
  l1=fgetl(f1);
  n=n+1;
end
 no_of_species=(n-1)/4

%Take back to saved position/line
fseek(f1,pos);
disp(' ')
Step 4
Creating a loop:
%Loop to iterate over the number of speicies data

  for i=1:no_of_species
      l1 = fgetl(f1);
      l1_data=strsplit(l1,' ');
      species=l1_data{1};
      var=char(species);

      Species=l1_data{1};
Step 5
Extracting local temperature range
%Extracting local tempperature of species

      lowtemp=str2num(l1_data{end-3});
      midtemp=str2num(l1_data{end-1});
      hightemp=str2num(l1_data{end-2});

      localtemp=[lowtemp midtemp hightemp];

      l2 = fgetl(f1);
      l3 = fgetl(f1);
      l4 = fgetl(f1);
Step 6
Extracting coefficients:
 %Extracting coefficients

       a=strfind(l2,'E');
       c1=str2num(l2(1:a(1)+3));
       c2=str2num(l2(a(1)+4:a(2)+3));
       c3=str2num(l2(a(2)+4:a(3)+3));
       c4=str2num(l2(a(3)+4:a(4)+3));
       c5=str2num(l2(a(4)+4:a(5)+3));

       b=strfind(l3,'E');
       c6=str2num(l3(1:a(1)+3));
       c7=str2num(l3(a(1)+4:a(2)+3));
       c8=str2num(l3(a(2)+4:a(3)+3));
       c9=str2num(l3(a(3)+4:a(4)+3));
       c10=str2num(l3(a(4)+4:a(5)+3));

       c=strfind(l4,'E');
       c11=str2num(l4(1:a(1)+3));
       c12=str2num(l4(a(1)+4:a(2)+3));
       c13=str2num(l4(a(2)+4:a(3)+3));
       c14=str2num(l4(a(3)+4:a(4)+3));
Step 7
Performing Calculations:
temp=linspace(lowtemp,hightemp,500);

       %Calculating specific heat, enthalpy and entropy

        for z=1:length(temp)
                if temp(z)>midtemp
                  cp(z)=R*(c1 + c2*temp(z) + c3*temp(z)^2 + c4*temp(z)^3 + c5*temp(z)^4);
                  H(z)=R*temp(z)*(c1 + c2*temp(z) /2 + c3*temp(z)^2 /3 + c4*temp(z)^3 /4 + c5*temp(z)^4 /5 + c6/temp(z));
                  S(z)=R*(c1*log(temp(z)) + c2*temp(z) + c3*temp(z)^2 /2 + c4*temp(z)^3 /3 +c5*temp(z)^4 /4 +c7);
                else
                  cp(z)=R*(c8 + c9*temp(z) + c10*temp(z)^2 + c11*temp(z)^3 + c12*temp(z)^4);
                  H(z)=R*temp(z)*(c8 + c9*temp(z) /2 + c10*temp(z)^2 /3 + c11*temp(z)^3 /4 + c12*temp(z)^4 /5 + c13/temp(z));
                  S(z)=R*(c8*log(temp(z)) + c9*temp(z) + c10*temp(z)^2 /2 + c11*temp(z)^3 /3 +c12*temp(z)^4 /4 +c14);
                end
        endfor

        %Calculating Molecular Weight of the species

        mw=0;

        atoms=['H','C','N','O','A'];

        atomicweight=[1.0079,12.01,14.0067,16,39.95];

           for m=1:length(Species)
             for n=1:length(atoms)
               if strcmpi(Species(m),atoms(n))
                 mw=mw+atomicweight(n);
                 x=n;
               endif

             endfor
             num=str2double(Species(m));

             if num>1
               mw=mw+atomicweight(x)*(num-1);
             endif
           endfor

          %Printing Molecular weight on the screen

          fprintf('Molecular mass of %s = %f \n',Species,mw)
Step 8
Creating Directory, Plotting and saving Plots in their respective directory:
%Save Current directory path in a variable for later use
          current_directory=pwd;

          %Creating new directory with species name
          mkdir(species)

          %Changing directory to the new directory created
          cd(species)

          %Plotting Specific heat plot
          figure(1)
          plot(temp,cp,"linewidth",2,"color",'b')
          xlabel("Temperature K")
          ylabel("Specific Heat KJ/Kg-K")
          title(sprintf('Temperature vs Specific Heat for %s',Species),"fontsize",10)
          grid on

          savename1=(sprintf('Temperature vs Specific Heat for [%s].png',species)  );
          saveas(figure(1),savename1)

          %Plotting enthalpy plot

          figure(2)
          plot(temp,H,"linewidth",2,"color",'r')
          xlabel("Temperature K")
          ylabel("Enthalpy KJ")
          title(sprintf('Temperature vs Enthalpy for %s',Species),"fontsize",10)
          grid on

          savename2=(sprintf('Temperature vs Enthalpy for [%s].png',species)  );
          saveas(figure(2),savename2)

          %Plotting entropy plot

          figure(3)
          plot(temp,S,"linewidth",2,"color",'g')
          xlabel("Temperature K")
          ylabel("Entropy J/k")
          title(sprintf('Temperature vs Entropy for %s',Species),"fontsize",10)
          grid on

          savename3=(sprintf('Temperature vs Entropy for [%s].png',species)  );
          saveas(figure(3),savename3)

          %Going back to root directory

          cd(current_directory)

   endfor

   fclose(f1);
Errors
1. error: sq_string cannot be indexed with { error: called from calc_local_temp_range at line 2 column 10 /Users/rahulgupta/Desktop/Challenges/Project 1/project_1 copy.m at line 71 column 29
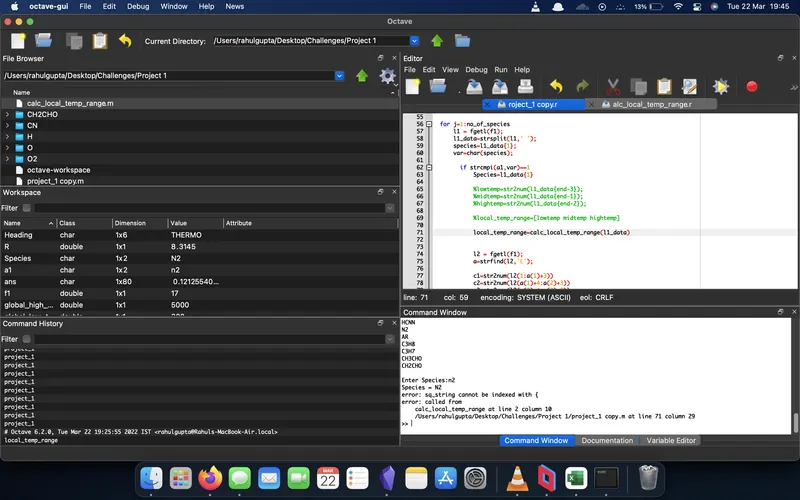
solved by passing correct variable in function
2. current_directory = /Users/rahulgupta/Desktop/Challenges/Project 1 error: 'cp' undefined near line 104, column 104 error: called from project_1_copy at line 104 column 15
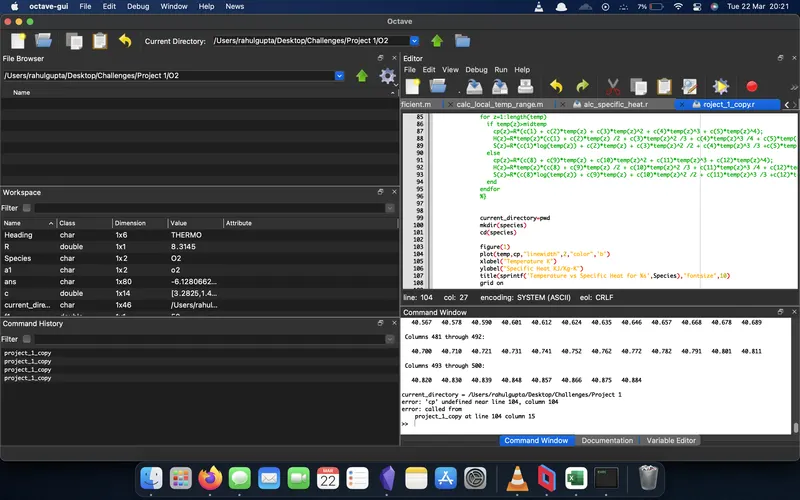
solved by storing function variable into relevant variable
3. error: parse error near line 35 of file /Users/rahulgupta/Desktop/Challenges/Project 1/calc_mol_weight.m
syntax error num=str2double(species(i);
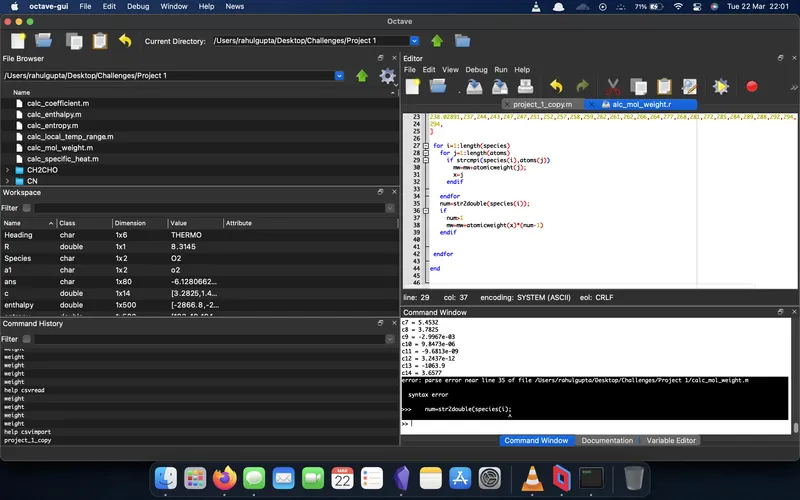
solved by adding a ')'