System Level Simulation of All-Terrain Vehicle
Aim :- 1. To carry out a system-level simulation of an all-terrain vehicle and prepare a technical report of it.
2. To vary the input parameters and study the response of the system.
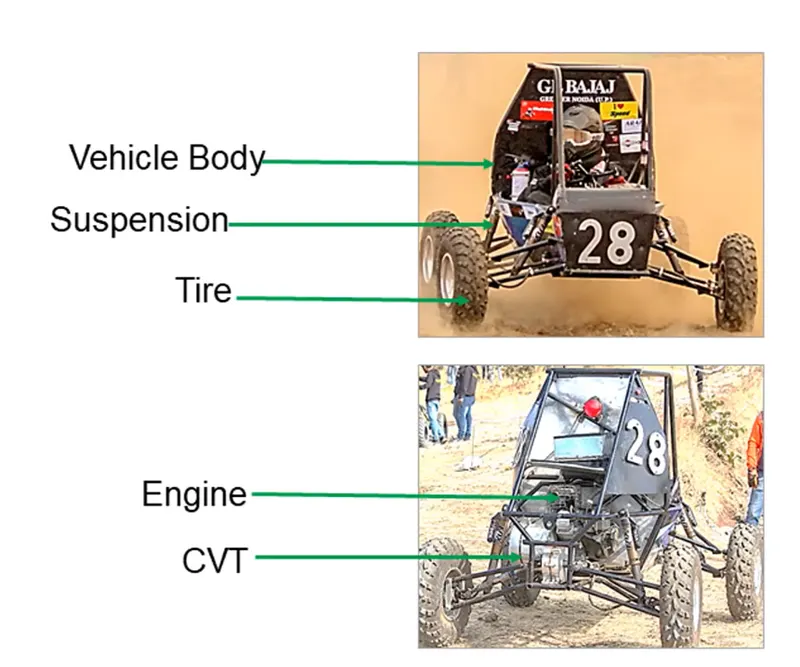
Engineering Background :- An all terrain vehicle is designed to travel on all types of ground, including rough ground. The ATV for given model is shown below.
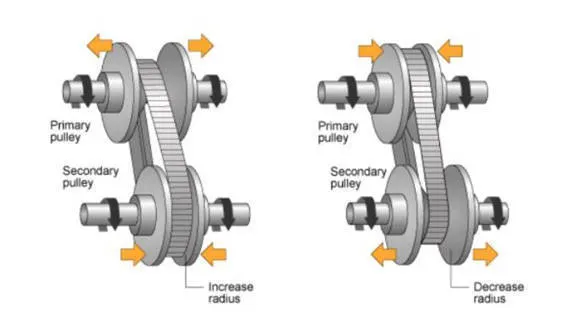
A continuously variable transmission is an automatic transmission that can change seamlessly through a continuous range of gear ratios. This contrasts with other transmissions that provide a limited number of gear ratios in fixed steps. When Primary/driver pulley moves away, the radius decreases and secondary/driven pulley moves inwards, its radius decreases such that speed reduction happens and vice versa.
Model :-
Explanation :-
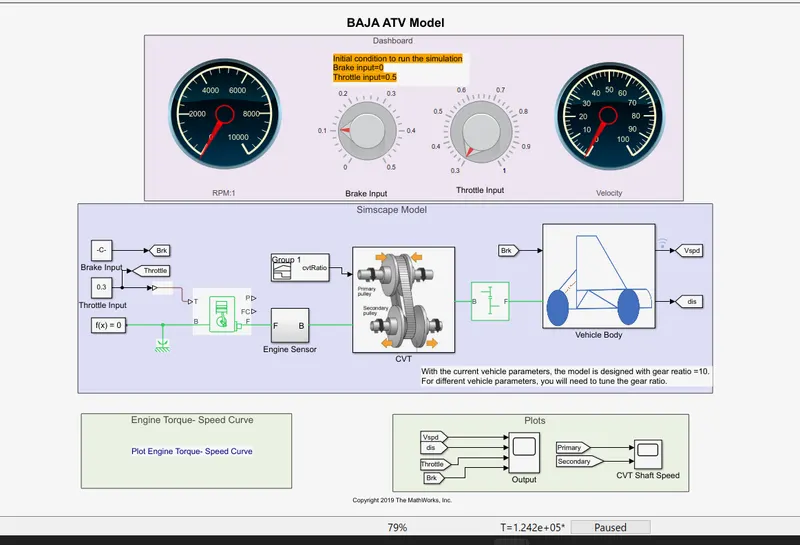
The model is a simscape model with simulink input parameters. These parameters are converted into physical parameters using simulink-ps convertor. Also solver configuration is attatched to model. The different subsystems of vehicle are modelled as below.
1. Engine :-
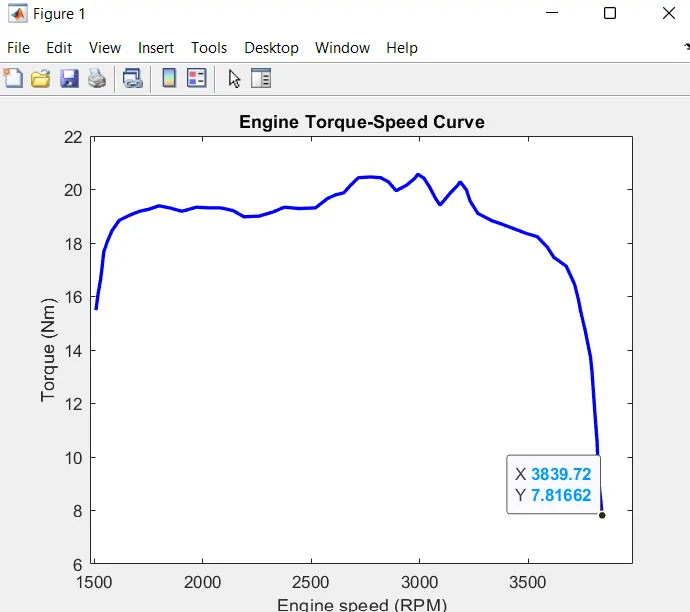
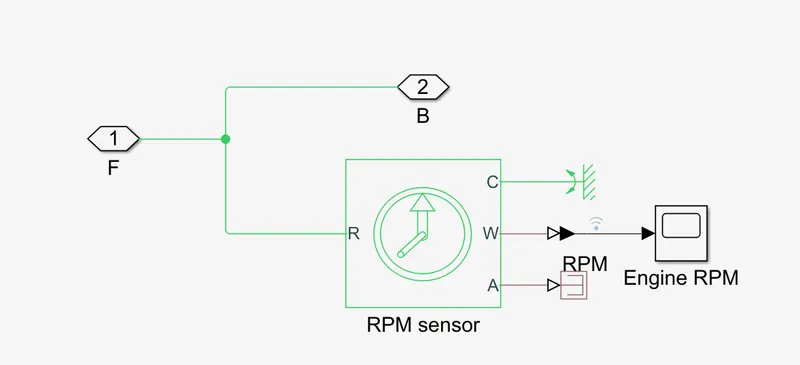
The engine input data is from the Engine-Torque speed curve. The curve data is feeded into the engine as shown. The GRABIT converts the figure into cetainm data points and feed it into engine. The maximum rpm for this engine is around 3840 RPM. The other parameters of the engine are default by the model. After the engine , an RPM sensor is used to measure the RPM output of the engine.
2. Continuously Variable Transmission (CVT) :-
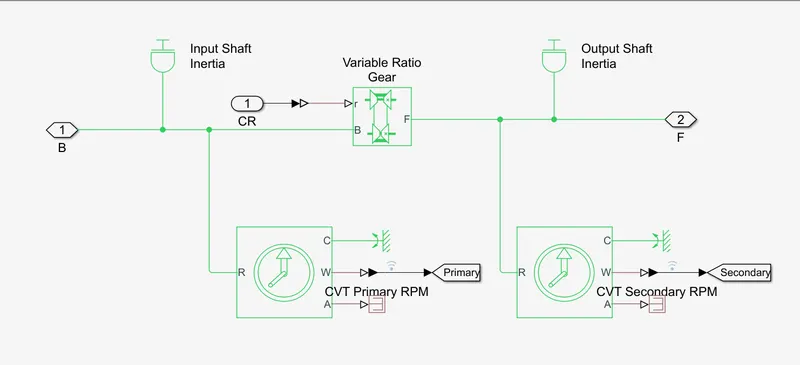
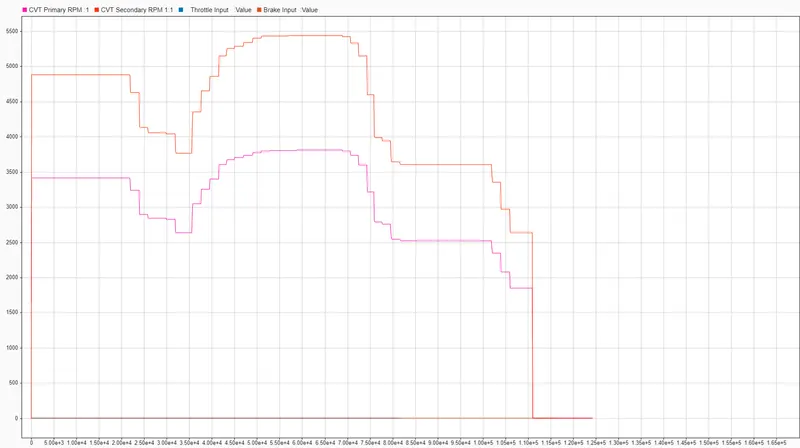
The CVT is modelled as shown below. The model contains variable gear ratio block. The input and output shaft inertias represent the input and output pulleys. The model two sensors which senses the rpm before CVT and another senses rpm after cvt. The outputs are assigned to Goto and from blocks to represent variation in scope.
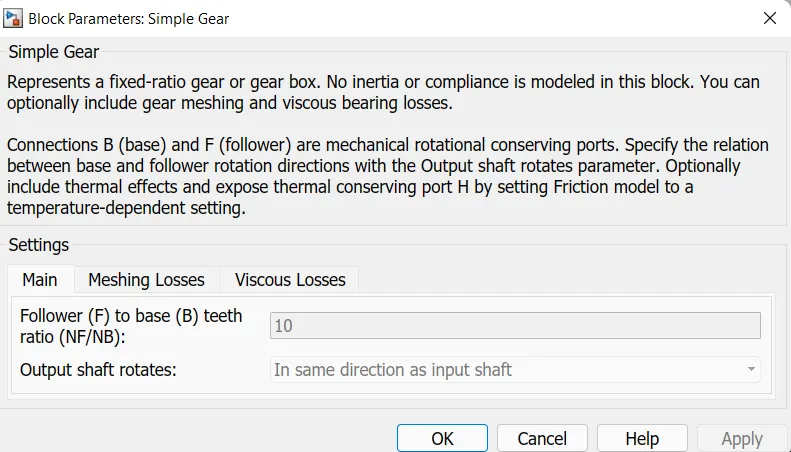
3. Gear :- After CVT, a simple gear is used with gear ratio 10.
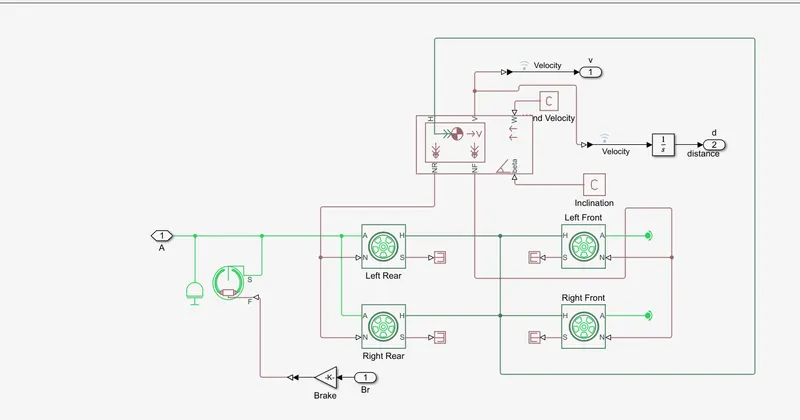
4. Vehicle Body :- The vehicle Body system is modelled as shown. All the values of the systems are by default.
5. Vechicle Dash Board:-
It consists of RPM meter and speedometer. It is also provided with throttle and brake input.
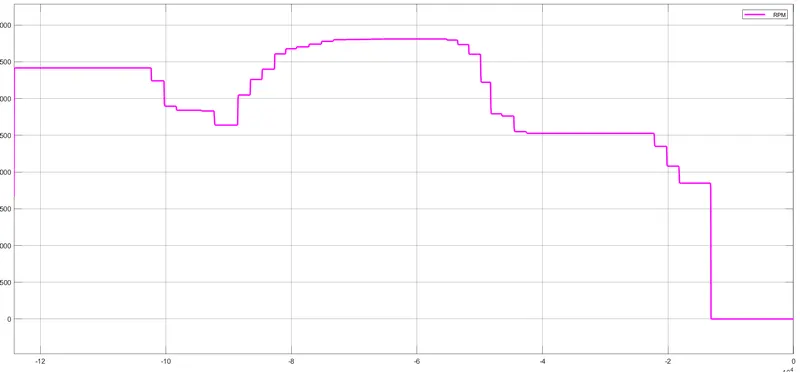
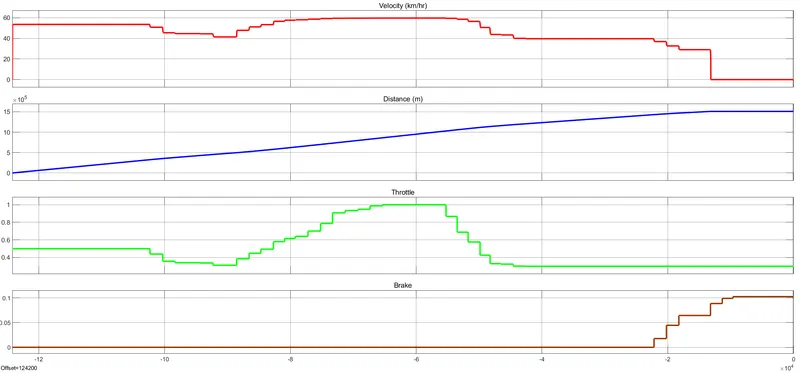
Results and Observations :- By varying the input throttle and applying brakes, the graph is generated as shown. By observing the graph, the variation in throttle directly impacts the vehicle speed. By applying brakes, the vehicle speed becomes zero. In the engine RPM graph, we can observe that the RPM is not increasing above the engine rated RPM limit whoch is nearly 3840 RPM.
CVT RPM :-
Engine RPM :-