Parsing NASA thermodynamic data using MATLAB
Aim :- Parsing of the NASA's thermodynamic data and achieve the following
1. Write a function that extracts the 14 co-efficients and calculates the enthalpy, entropy and specific heats for all the species in the data file. You will be reading this file NASA thermodynamic data
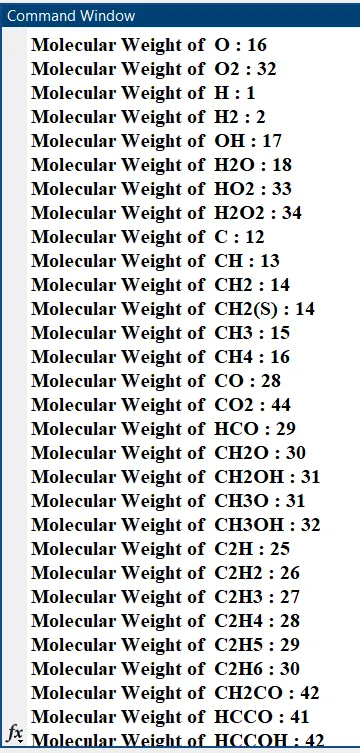
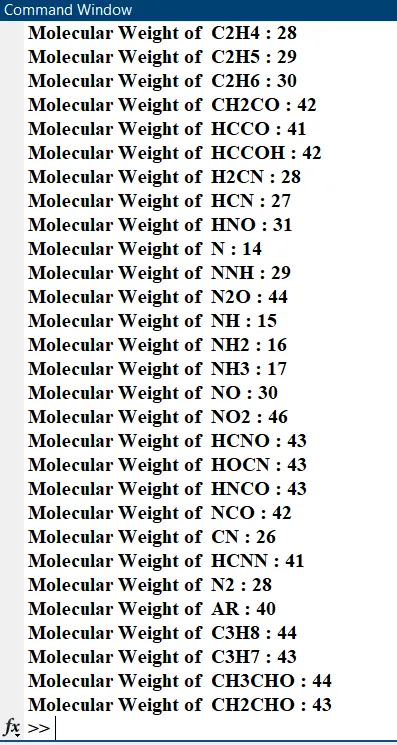
2. Calculate the molecular weight of each species and display it in the command window.
3. Plot the Cp, Enthalpy and Entropy for the local temperature range (low temperature : high temperature) specific for each species.
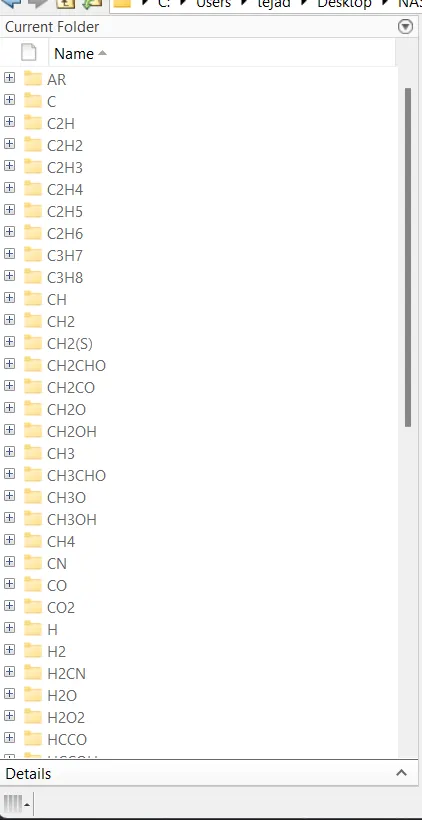
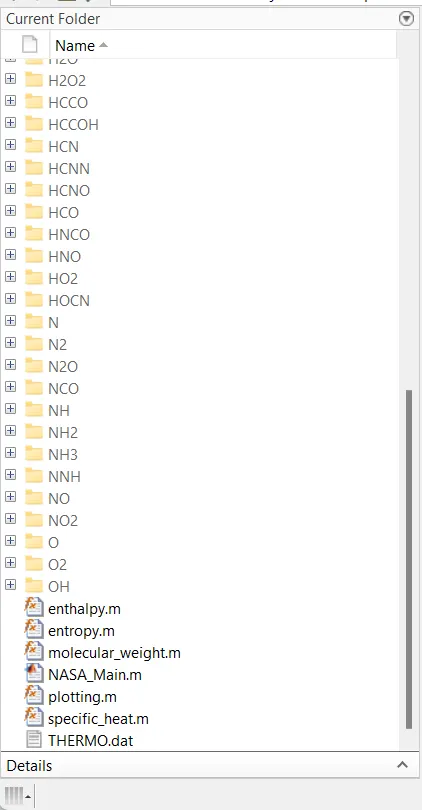
4. Save the plots as images with appropriate names and dump them in separate folders for each species with suitable name. All these should be generated automatically.
Engineering Background :-
Parsing: Parsing a file means reading in a data stream and building a memory model of the content of that data. This aims at facilitating perfoming some kind of transformation on the data. Parsing splits a file or other input into pieces of data that can be easily stored or manipulated.
Formulae used for calculations :-

Main Code :-
clear all
close all
clc
%To open the given file for Parsing
file = fopen('THERMO.dat','r');
%For the header information which is basically useless for code
Header = fgetl(file);
%Parsing the temperature values
global_temp = fgetl(file);
temp_range = strsplit(global_temp, ' ');
%Array store only one kind of data, so we have to use curly braces for extracting different type of data
%Here we used to curly braces to get integers from strings in an array
global_min_temp = str2num(temp_range{2})
global_med_temp = str2num(temp_range{3})
global_max_temp = str2num(temp_range{4})

T = linspace(global_min_temp, global_max_temp, 350);
R = 8.314;
%As per logic in the given file, the next 3 lines are 3 lines, we have no
%use in code
for i = 3:5
    Information = fgetl(file);
end
% Method to Extract the coefficients
for i = 1:53
    %Extracting values line wise
    line1= fgetl(file);
    name = strtok(line1);

    line2 = fgetl(file);
    line3 = fgetl(file);
    line4 = fgetl(file);

   %Extracting coefficients with reference to exponential term
    A = strfind(line2, 'E');
    B = strfind(line3, 'E');
    C= strfind(line3, 'E');
    %Extracting the coefficients, the code below will extract the
    %coefficients, coefficients are stored in a similar pattren throught
    %the given file, so using for loop will simplify the process
    %First 7 coefficients are for higher temperature range
    a1 = str2num(line2(1:A(1)+3));
    a2 = str2num(line2(A(1)+4:A(2)+3));
    a3 = str2num(line2(A(2)+4:A(3)+3));
    a4 = str2num(line2(A(3)+4:A(4)+3));
    a5 = str2num(line2(A(4)+4:A(5)+3));
    a6 = str2num(line3(1:B(1)+3));
    a7 = str2num(line3(B(1)+4:B(2)+3));

    %Second 7 coefficients are for lower temperature range
    b1 = str2num(line3(B(2)+4:B(3)+3));
    b2 = str2num(line3(B(3)+4:B(4)+3));
    b3 = str2num(line3(B(4)+4:B(5)+3));
    b4 = str2num(line4(1:C(1)+3));
    b5 = str2num(line4(C(1)+4:C(2)+3));
    b6 = str2num(line4(C(2)+4:C(3)+3));
    b7 = str2num(line4(C(3)+4:C(4)+3));

    %Creating functions for calculation of required parameters

    cp = specific_heat(a1,a2,a3,a4,a5,b1,b2,b3,b4,b5,T,R,global_med_temp);
    h = enthalpy(a1,a2,a3,a4,a5,b1,b2,b3,b4,b5,T,R,global_med_temp,a6,b6);
    s = entropy(a1,a2,a3,a4,a5,b1,b2,b3,b4,b5,T,R,global_med_temp,a7,b7);

    %For calculattion of molecular weight and displying it in the command
    %window

    molecular_wt(i) = molecular_weight(name);
    plotting(cp,h,s,T,name)
end
Code for calculating Specific Heat, Enthalpy, Entropy and Molecular Weight :-
%Function for calculating Specific Weight

function  cp = specific_heat(a1,a2,a3,a4,a5,b1,b2,b3,b4,b5,T,R,global_med_temp)

%As per given first 7 coefficents are for higher temp limit and second 7
%coefficients are for lower temp limit

if T>global_med_temp
    cp = R.*(a1+a2.*T+a3.*t.^2+a4.*T.^3+a5.*T.^4);
else
     cp = R.*(b1+b2.*T+b3.*T.^2+b4.*T.^3+b5.*T.^4);
end


%Function for calculating enthalpy

function  h = enthalpy(a1,a2,a3,a4,a5,b1,b2,b3,b4,b5,T,R,global_med_temp,a6,b6)

%As per given first 7 coefficents are for higher temp limit and second 7
%coefficients are for lower temp limit

if T> global_med_temp
    h = R.* (a1.*T+(a2.*T.^2)./2+(a3.*T.^3)./3+(a4.*T.^4)./4+(a5.*T.^5)./5+a6);
else
     h = R.* (b1.*T+(b2.*T.^2)./2+(b3.*T.^3)./3+(b4.*T.^4)./4+(b5.*T.^5)./5+b6);
end


%Function for calculating entropy

function s = entropy(a1,a2,a3,a4,a5,b1,b2,b3,b4,b5,T,R,global_med_temp,a7,b7)


%As per given first 7 coefficents are for higher temp limit and second 7
%coefficients are for lower temp limit

if T >  global_med_temp
    s = R*(a1.*log(T)+a2.*T + a3.*(T.^2)./2+a4.*(T.^3)./3 + a5.*(T.^4)./4+a7);
else
      s = R*(b1.*log(T)+b2.*T + b3.*(T.^2)./2+b4.*(T.^3)./3 + b5.*(T.^4)./4+b7);
end


%Function to calculate Molecular Weight

function mw = molecular_weight(name)
%Input the species
species = ['H', 'C', 'O', 'N', 'R'];
%Printing Molecular weights in command window
fprintf('Molecular Weight of  ');
fprintf(name);
fprintf(' : ');
atomic_weight = [1 12 16 14 40];
mw=0;
%Assigning values to the Species Alphabetical symbols
for i = 1: length(name)
    for j = 1: length(species)
        if strcmp(name(i),species(j))
            mw= mw+ atomic_weight(j);
            place = j;
        end
    end
    n = str2num(name(i));
    if n>1
        mw = mw +atomic_weight(place)*(n-1);
    end
end
fprintf('%d', mw);
disp(' ')
end
Code for automatic plotting with subfolders naming species name :-
%   Easy way for plotting to create a plot for every step using function
%   command

function plotting(cp, h, s,T, name)
%Assigning folder for saving subfolders for each species plots
cd('C:UserstejadDesktopNASA File Parsing')
directory = name;
%mkdir(___) creates the specified folder and returns a status of 1 if the
%operation is successful or folder exists

mkdir(directory);

%Creating 3 different figures for 3 different parametrs vs temperature
figure(1)
plot(T, cp, 'color', 'g')
title(sprintf('Specific Heat vs Temperature of %s', name))
xlabel('Temperature in K')
ylabel('Specific Heat in KJ/kg-K')

figure(2)
plot(T, h, 'color', 'b')
title(sprintf('Enthalpy vs Temperature of %s', name))
xlabel('Temperature in K')
ylabel('Enthalpy in KJ/kg')

figure(3)
plot(T, s, 'color', 'r')
title(sprintf('Entropy vs Temperature of %s', name))
xlabel('Temperature in K')
ylabel('Entropy in KJ/K')

cd(directory)
saveas(1, 'Secific_heat_vs_temp.png')
saveas(2, 'Enthalpy_vs_temp.png')
saveas(3, 'Entropy_vs_temp.png')
%After saving the plots in sub folder directory with species name, retun to
%main folder where the main code is.
cd('C:UserstejadDesktopNASA File Parsing')

end
Steps involved in Coding :-
1. Creating a main code for extraction of coefficients and creating functions for calculation of required parameters like specific heat, enthalpy, entropy and molecular weight
2. Creating the another function scripts which are having formulae for calculating the required parameters.
3. Creating of another script for plotting the graphs and saving them in subfolders which are names by the species name itself. They are done by cd and mkdir command. It creates the specified folder and returns a status of 1 if the
operation is successful or folder exists.
4. Compiling the code and manually verifying whether the plots are generated as per requirements or not.
Results :-
By executing the above code the folders are generated and molecular weights of different species are found and displyed in command window. The Google drive link is shared down for verification of folders.
https://drive.google.com/drive/folders/1ZpbfX3ol1Kgh5AjRY5SHZi_96_QPuUGa?usp=sharing
Erros Faced while creating subfolders :-
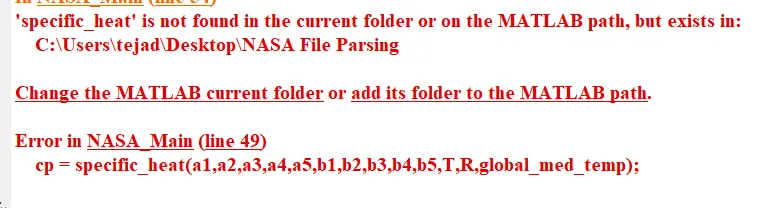

Here subfolders are looped and created subfolders one inside another. Adding directory manuaaly rectified the problem.