Project
PROJECT
System Level Simualtion of A BAJA All Terrain Vehicle Model
The objective of the simulation is to find out the different conditions of BAJA All Terrain Vehicle (ATV) and to prepare a report on the same.
There are 4 cases to be studied.
Case 1: Study on BAJA ATV model without dashboard
Case 2: Study on BAJA ATV model with dashboard
Case 3: Study on BAJA ATV using lookup table without dashboard
Case 4: Study on BAJA ATV using lookup table with dashboard
While driving, a CVT gearbox smoothly changes between an endless range of effective gear ratios, whereas other types of mechanical transmissions offer a set number of gear ratios and need hard shifts between each. Single-speed, shiftless, and stepless transmissions are all terms used to describe CVT transmission systems.
A CVT's shiftless feature gives it unrivalled versatility, allowing it to maintain constant angular velocity regardless of output speed. Furthermore, a continuously variable gearbox smooths down acceleration and improves fuel consumption.
Case 1: Study on BAJA ATV model without dashboard
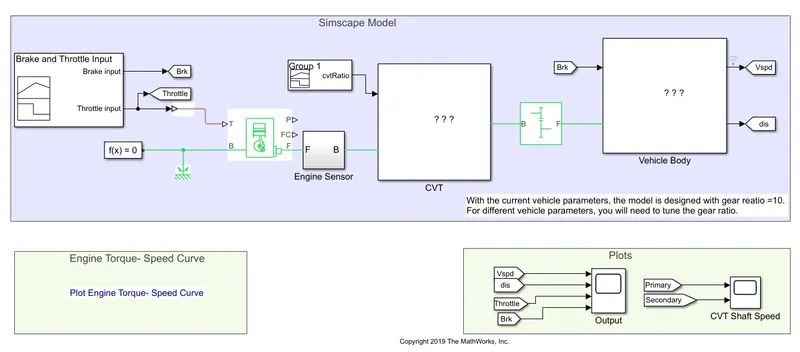
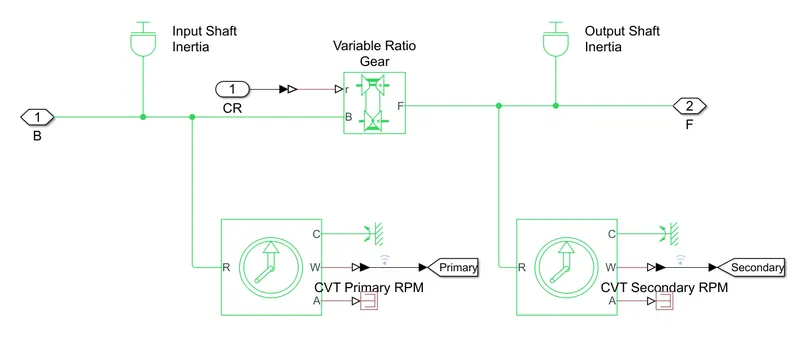
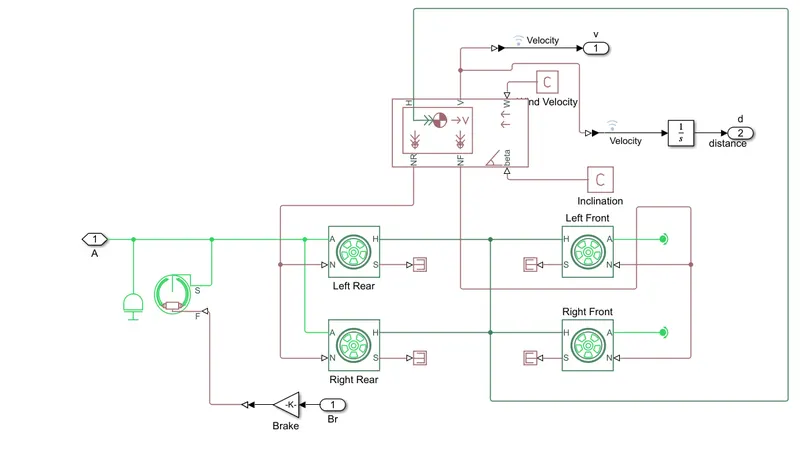
The signal builder, generic engine, motion sensors, vehicle transmission, vehicle body, tyres, and solver configuration blocks of the cvt model created with Simulink are depicted in the model. Transmission block, input and output shaft inertia, and motion sensors are all part of the CVT subsystem. As depicted in the model, the vehicle body subsystem includes the vehicle body block, double drum brake, and tyres. The initial engine speed is 2100rpm, with mechanical rotations of 0.8 and 0.7 for the driven pulley and driven pulley, respectively. The vehicle has a mass of 250kg and two axles that link the four wheels in the proper manner.
BAJA All Terrain Vehicle Model
CVT Model
Vehicle Body
Brake and Throttle Input Curve CVT Gear ratio
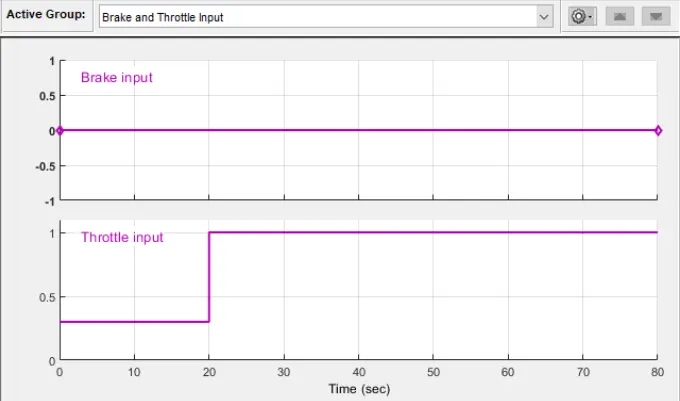
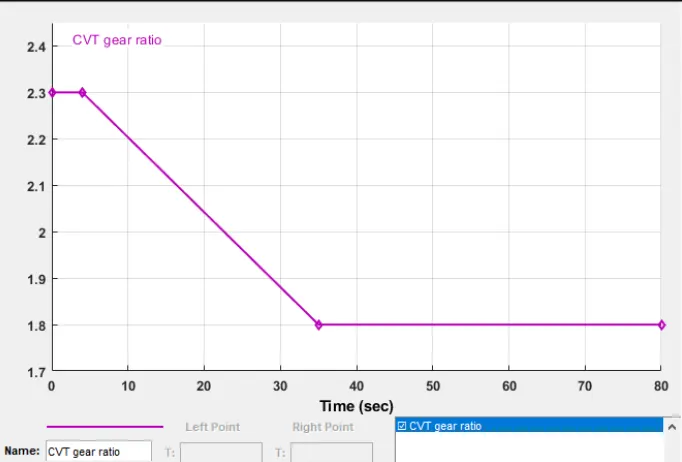
For brake, throttle, and gear ratio, the signal builder is used as an input. For the sake of simulation, the brake input is set to zero. The throttle value is primarily used to manage the flow or amount of gasoline entering the engine; as the throttle value increases, the flow of fuel to the IC engine increases, resulting in increased engine power. The gear ratio is kept at 2.3 for 5 seconds before decreasing linearly to 1.8 and remaining constant throughout the simulation.
Output :
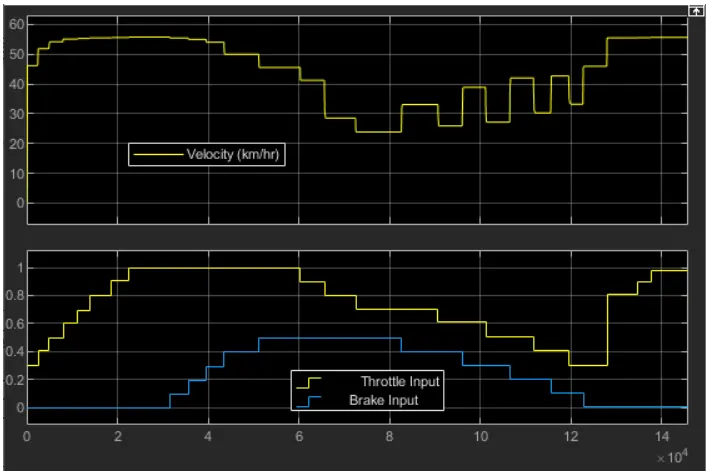
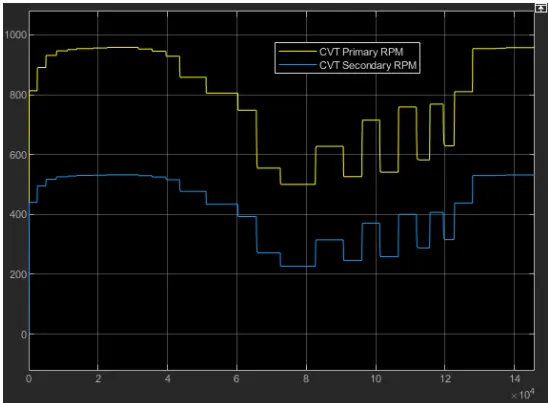
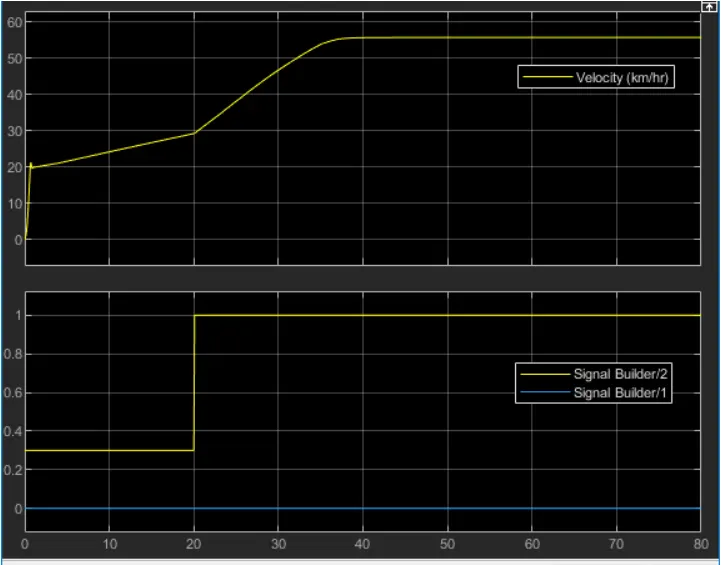
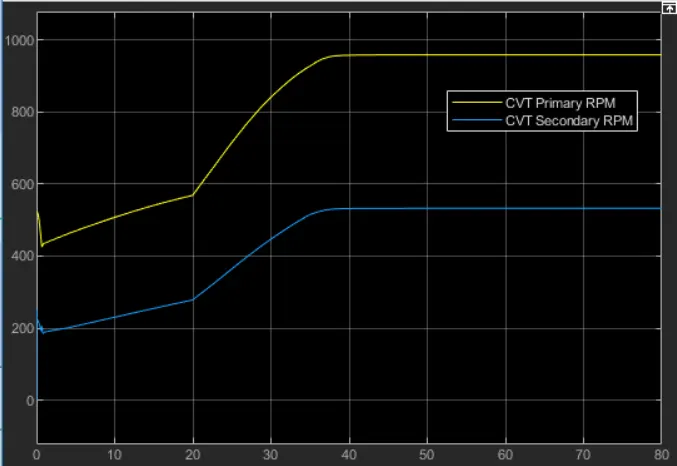
The brake is kept constant in the figure, while the throttle is increased, indicating an increase in velocity. When the throttle is increased from 0.3 to 1, the flow of fuel rises, and the engine's power increases. At a gear ratio of 0.8, the torque reaches around 7Nm, indicating that the gear ratio is directly proportional to the torque. The highest speed and velocity can be achieved with this gear ratio. Because the radius of the primary shaft is greater than the radius of the secondary shaft, the primary shaft achieves a high rotating speed while the secondary shaft maintains a low rotational speed. The speed of the shaft increases as the radius increases.
Velocity and Shaft Speed Output Curve
Case 2: Study on BAJA ATV model with dashboard
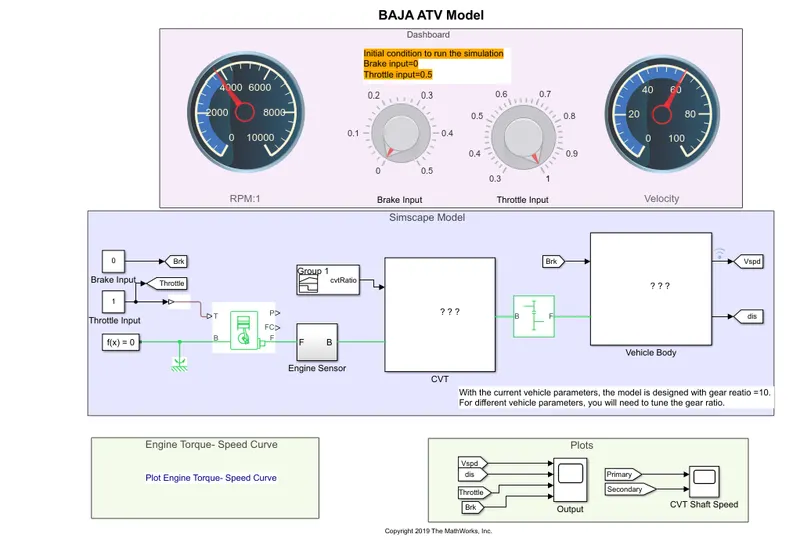
The figure depicts a BAJA ATV with a dashboard model that includes a throttle metre and brake input in addition to signal builder input. The rest of the blocks and subsystems are typical in the BAJA ATV model without a dashboard, and the outcome is studied by altering the brake and throttle inputs, which shows the engine's velocity and speed. As seen in the figure, the gear ratio is maintained at 2.3 for 5 seconds before decreasing linearly to 1.8 and remaining constant throughout the simulation. The velocity and speed drop in proportion to the brake input, which ranges from 0-0.5. The velocity and speed of the engine and shaft increase as the throttle is increased.
BAJA ATV Model With Dashboard
Output:
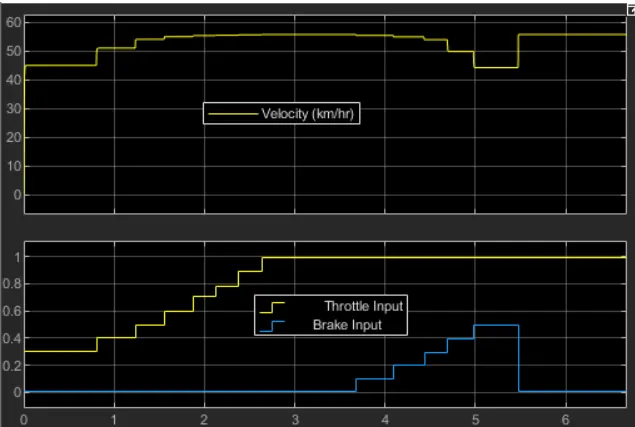
The vehicle's velocity is kept constant in the figure at a constant throttle value of 0.3 and varies by increasing the throttle value, which increases the vehicle's velocity. The velocity of the vehicle decreases as the brake input is increased.
Variation in Velocity and Shaft Speed Output
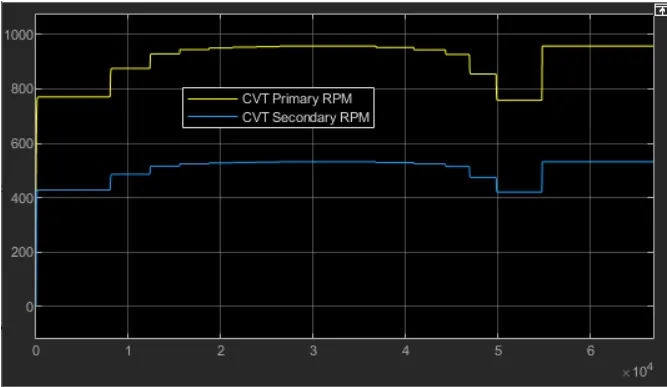
In the diagram, the primary shaft speed increases as the throttle is increased and decreases as the brake input value is increased, indicating that the throttle may flow more fuel, increasing the engine's power, and is identical to the secondary shaft. The speed is exactly proportional to the radius of the primary shaft, which is greater than the radius of the secondary shaft. The speed of the shaft increases as the radius increases.
Case 3: Study on BAJA ATV using lookup table without dashboard
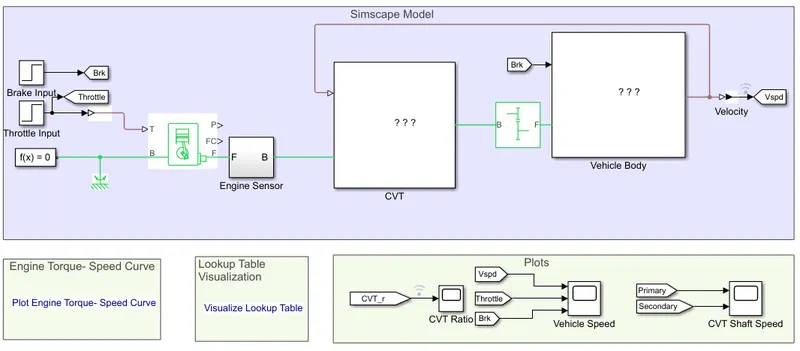
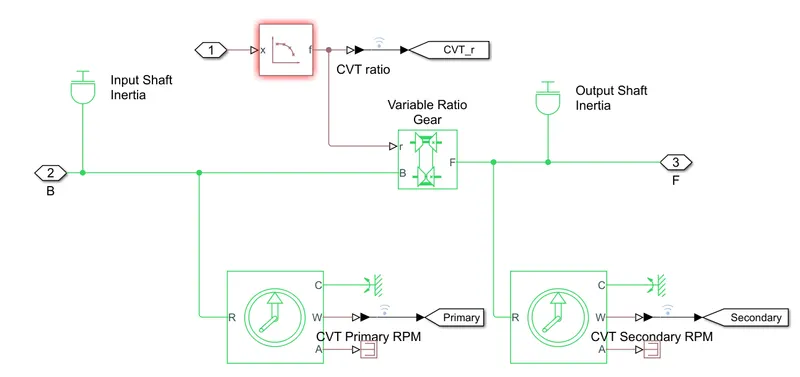
The CVT model created with Simulink includes step time, generic engine, motion sensors, vehicle transmission, vehicle body, tyres, and solver configuration blocks, among other things. As illustrated in the diagram, the CVT subsystem consists of a look-up table, transmission block, input and output shaft inertia, and motion sensors. As illustrated in the diagram, the vehicle body subsystem consists of the vehicle body block, double drum brake, and tyres. The initial engine speed is 2100 rpm, with mechanical rotations of 0.8 and 0.7 for the driven driven pulley and driver pulley, respectively. The vehicle has a mass of 250 kg and two axles that link the four wheels.
BAJA ATV Model with Lookup Table
CVT with Lookup Table
Vehicle Body
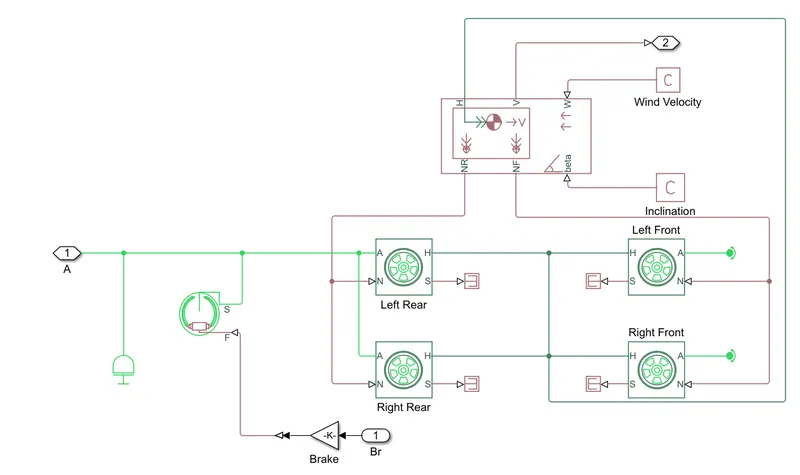
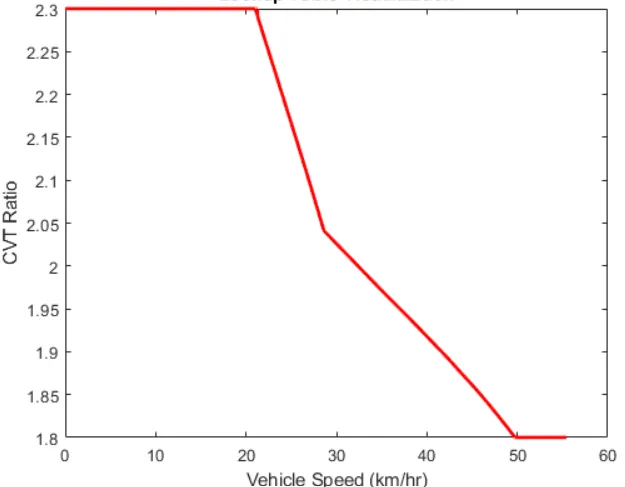
A lookup table is an array of data that approximates a mathematical function by mapping input values to output values. Simulink can estimate an output value via interpolation, extrapolation, and other methods given a set of input values that are not explicitly defined by a lookup table. The brake and throttle inputs are determined by step time, which varies depending on the run time. Using a gear ratio lookup table as an input to the CVT, which works according to the input gear ratio to produce the output. This strategy is particularly effective in avoiding anomalous torque at a specific speed while also making it very simple to reach higher velocity and engine speed. When the input is provided through a lookup table, it operates as a closed loop. The simulink gets the input value from a lookup table and calculates the outcome based on the gear ratio input values.
Lookup Table
Output:
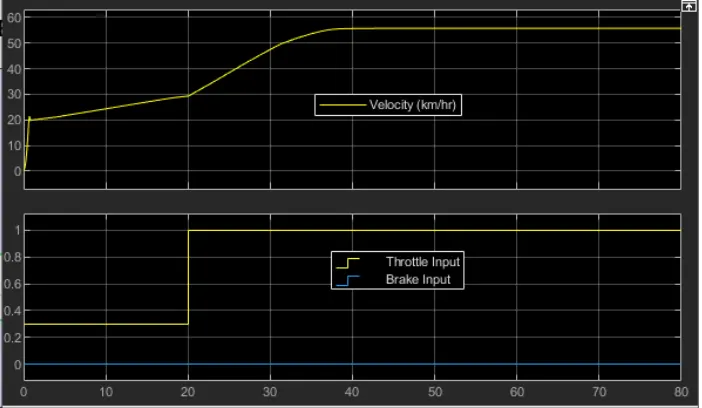
The output reveals that the brake is kept constant while the throttle is increased, indicating an increase in velocity. When the throttle is increased, the fuel flow increases. As a result, the engine's power increases. At 1.8 gear ratio, the torque reaches around 7Nm, indicating that the gear ratio is directly proportional to the torque. The highest speed and velocity can be achieved with this gear ratio. The gear ratio is entered into the lookup table and given as an input to the simulink, which reads all of the input values and calculates the outcome based on the input.
Velocity and Shaft Speed Curve when Lookup Table is added
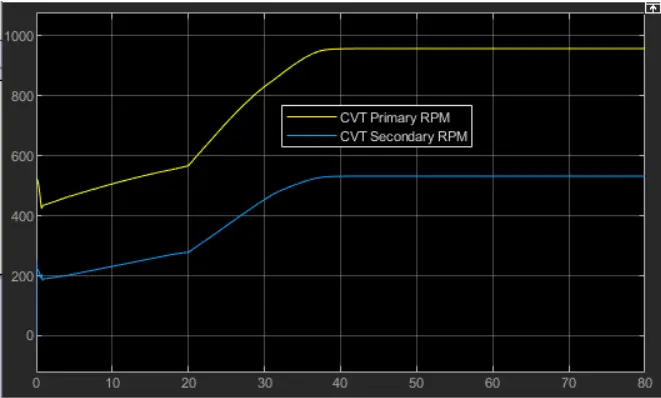
In the diagram, the primary shaft speed increases as the throttle is increased and decreases as the brake input value is increased, indicating that the throttle may flow more fuel, increasing the engine's power, and is identical to the secondary shaft. The speed is exactly proportional to the radius of the primary shaft, which is greater than the radius of the secondary shaft. The speed of the shaft increases as the radius increases.
Case 4: Study on BAJA ATV using lookup table with dashboard
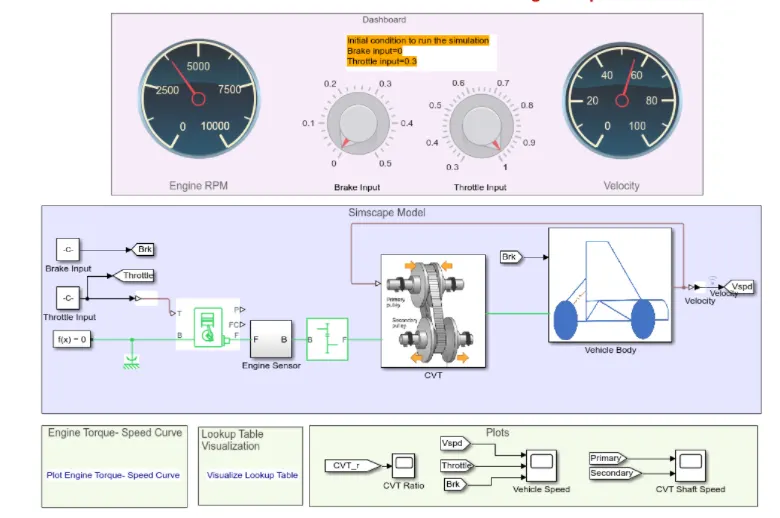
The BAJA AT with dashboard model employs a lookup table that includes a throttle metre and brake input in the dashboard, as well as a constant block indicator. The fundamental idea behind employing a dashboard is to examine the results by adjusting the engine speed. Simulink uses a lookup table to retrieve the input value for the gear ratio and then uses the lookup table to get the outcome. As the brake input changes from 0-0.5, the velocity and speed decrease, and the gear ratio falls as well. The velocity and speed of the engine and shaft increase as the throttle is increased. the transmission as a primary and secondary pulley, with the primary pulley's radius increasing as it compacts and the secondary pulley's radius decreasing.
BAJA ATV with Lookup Table and Dashboard
Output :
In the diagram, the primary shaft speed increases as the throttle is increased and decreases as the brake input value is increased, indicating that the throttle may flow more fuel, increasing the engine's power, and is identical to the secondary shaft. The speed is exactly proportional to the radius of the primary shaft, which is greater than the radius of the secondary shaft. The speed of the shaft increases as the radius increases. In the dashboard, the throttle and brake input values can be changed.
Variation in Velocity and Shaft Speed Curve when Lookup table and Dasboard is added