Project 2 Thermal modeling of battery pack
PROJECT 2(THERMAL MODELLING OF BATTERY PACK)
Objective:
A)To create a battery model consist of 10 series cells and to explain its thermal effects.
B)And to explain the changes in battery life cycle performance according to its temperature changes.
C)To Simulate with different charge/discharge rate to see its battery life performance.
A) Creating model:
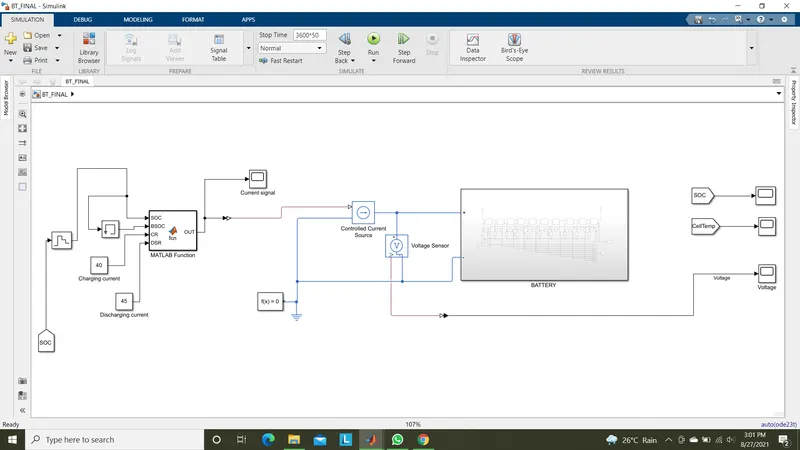
Overall model-
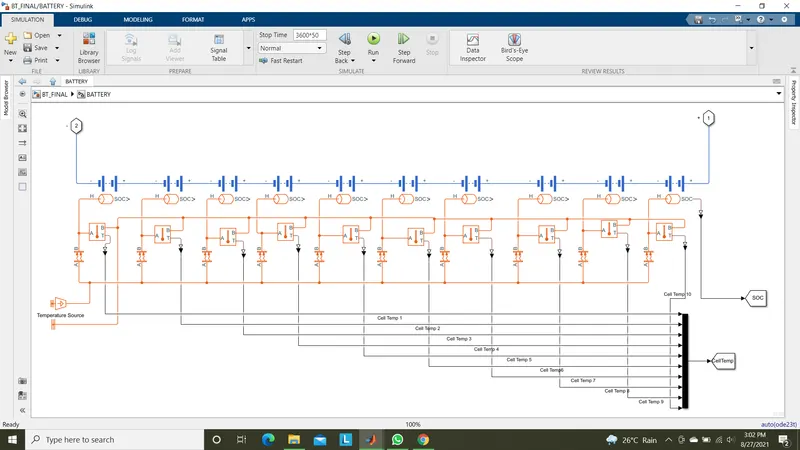
Battery subsystem-
Configuring:
Battery-
Here we are connected 10 'Table based' battery in series, the maximum positive terminal(1) and maximum negative terminal(2) are given as output terminals from
battery subsystem.
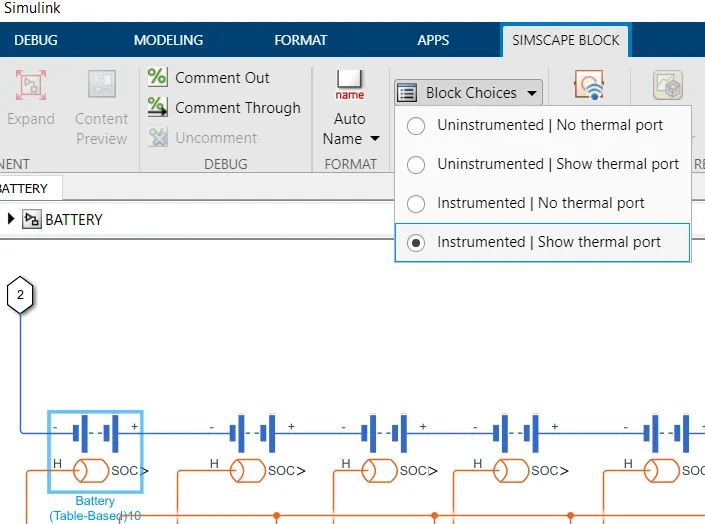
The thermal port and SOC are enabled for each cells as selecting 'Instrumented,Shown thermal port' from Simscape block as shown below.
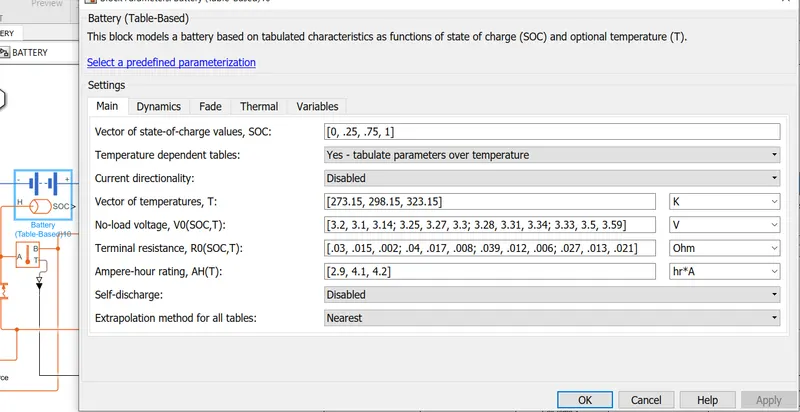
The battery configurations are set in default conditions in main function.
The vector of SOC are given as 0,0.25,0.75,1.They are representing the percentage of cell.
Temperature parameters are enabled as tabulated parameters over temperature.
Vector of temperatures are given as 273.15,298.15,323.15 in Kelvin.
No-load voltages for 4 stages of SOC conditions corresponding to their 3 temperature values are mentioned as 12 no-load voltage values.
Terminal resistances at their corresponding array no-load voltages are given by 12 resistance values.
Battery capacity defined by three values 2.9Ah,4.1Ah,4.2Ah corresponding to its 3 temperature conditions.
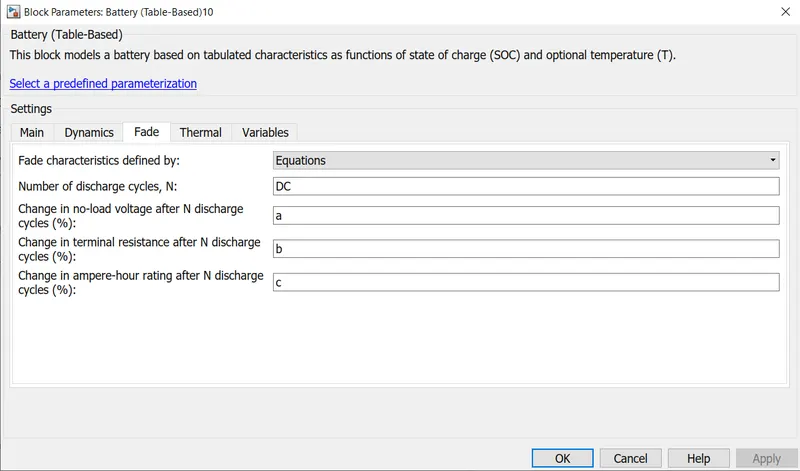
To see the battery life variations we have to configure the fade parameters as shown below,
Here number of N discharge cycles value is given DC variable base workspace.
Percentage change in no-load voltage after N discharge cycles is given as a.
Percentage change in terminal resistance after N discharge sycles given as b.
Percentage change in capacity of cell after N discharge cycle is given as c.
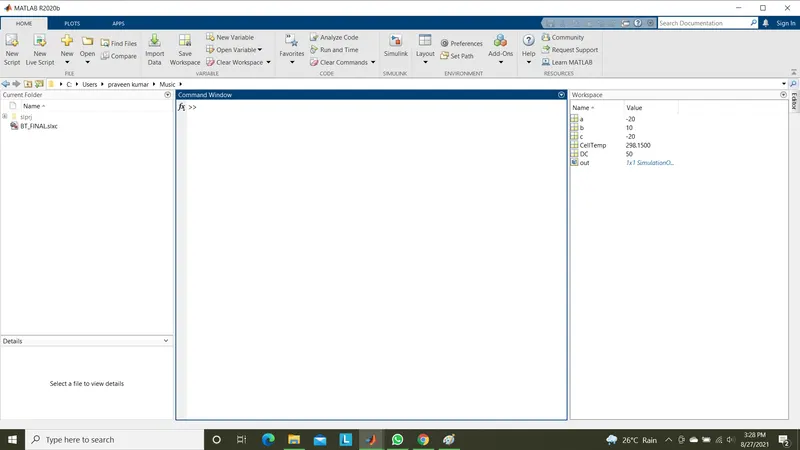
Their values are given as shown below,
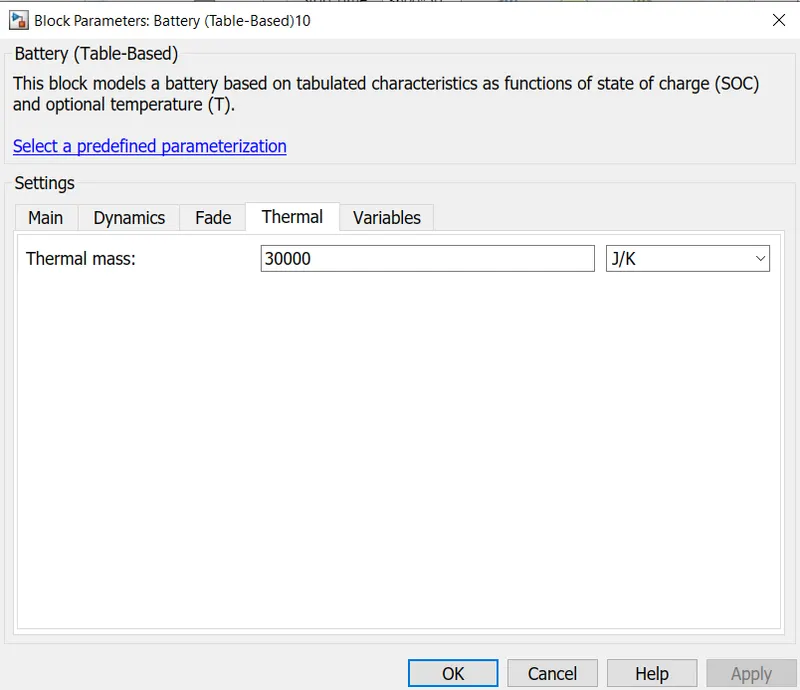
Thermal mass of cell is given as 30000J/K.
The variables are given as below,
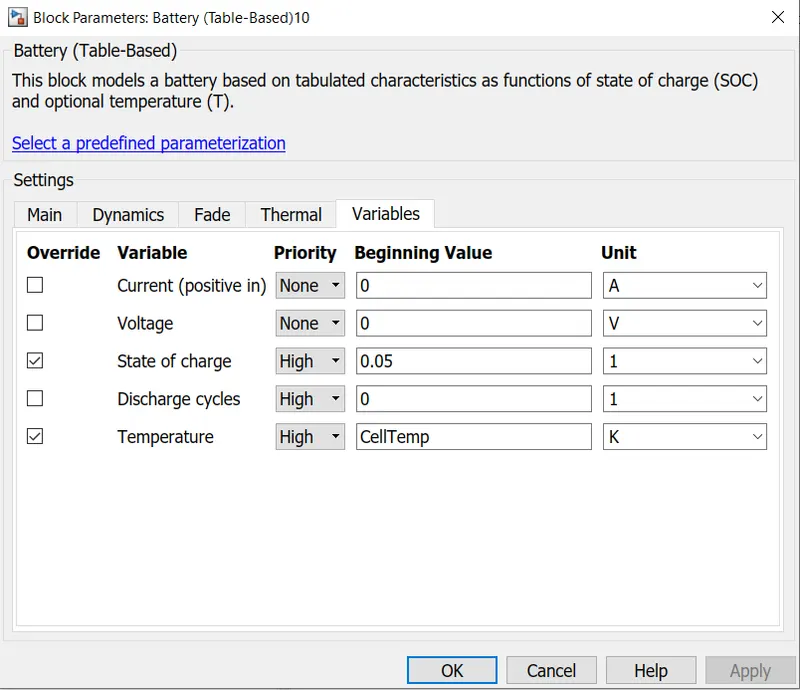
Initial SOC as 0.05 as 5%.Cell temperature value is given in baseworkspace area.
These cell configurations are same for all all series connect cells.
Matlab function-
This block is used to communicate the logics between matlab script and the model using a function command.
Here matlab function block is used to generated controlled charging/discharging current pulses to give as input to controlled current source as shown below,
Inputs are taken as SOC(from feedback),BSOC(previous SOC value),CR(charging current),DSR(Discharging current).
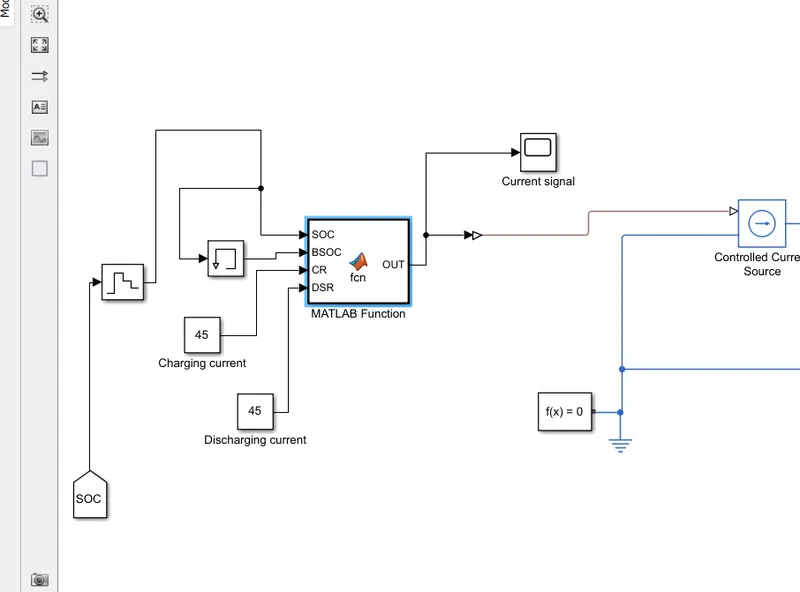
The matlab code is written as,
function OUT = fcn(SOC,BSOC,CR,DSR)
CHECK=SOC-BSOC;
if CHECK<0
    y=-DSR;
else
    y=CR;
end
if SOC>0.95
    y=-DSR;
elseif SOC<0.05
    y=+CR;
end
OUT=y;
Here initially we are checking the condition of battery performance as whether charging or discharging.
If current SOC is less than BSOC the condition is discharging (negative CHECK value) gives -DSR value as pulse.
If current SOC is greater than BSOC the condition is charging(positive CHECK value) gives +CR value as pulse.
If SOC reached 95% then it starts dischargeing and if SOC reached 5% again charging operation will occurs.
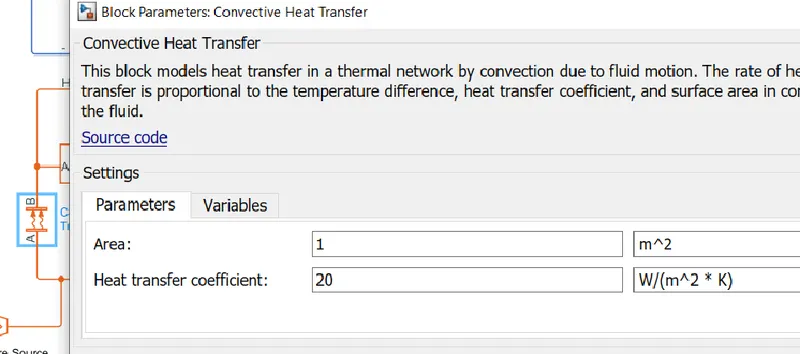
Convective heat transfer-
This block is used to transfer the thermal heat from source to battery to control the battery temperature.
Area of contact is given as 1m2.Heat transfer coefficient as 20W/(m2*K).
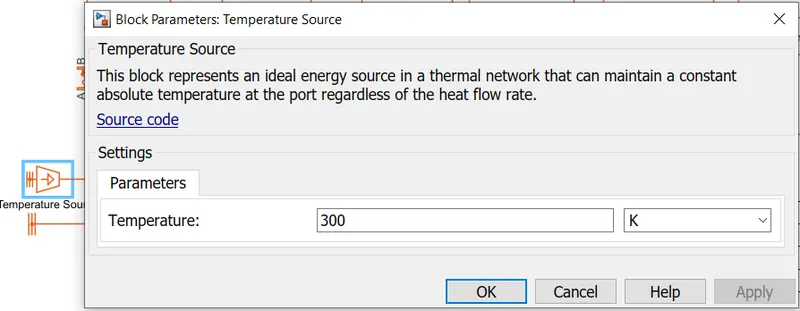
Temperature source-
Temperature to maintain the battery is given by this block and connected to A port of convective heat transfer.
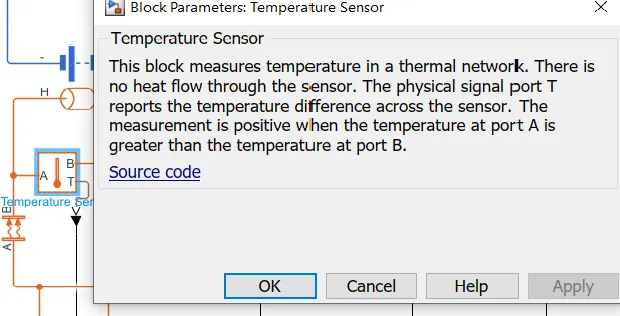
Temperature sensor:
This block is used to find the temperature change in cells with respect to corresponding heat source.The output can be seen through T port of block.
The A port is cinnected between H-B ports to sence the temperature changes and see in scope.
WORKING:
Initially current pulses are given to controlled current source.It produces the current according to the signal and gives to battery treminals,
The battery gets charge and discharge accordingly to the current.
we are producing the current singals as shown below,
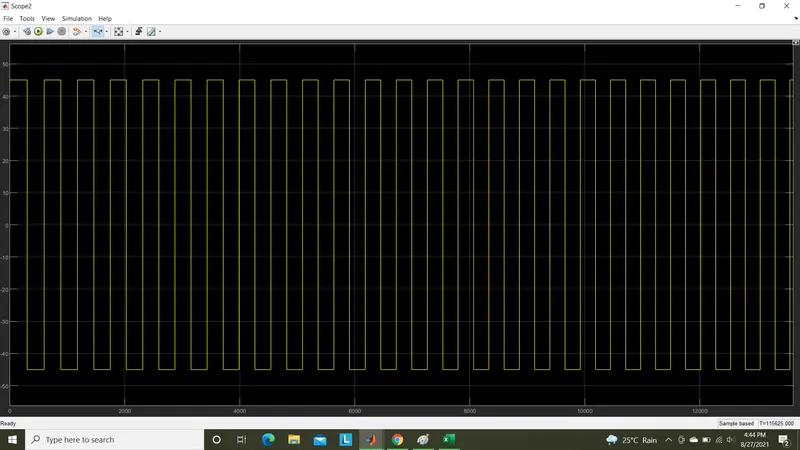
Here 45A as charging rate and 45A as discharging rate is given to controlled current source.
The output SOC of battery we get as,
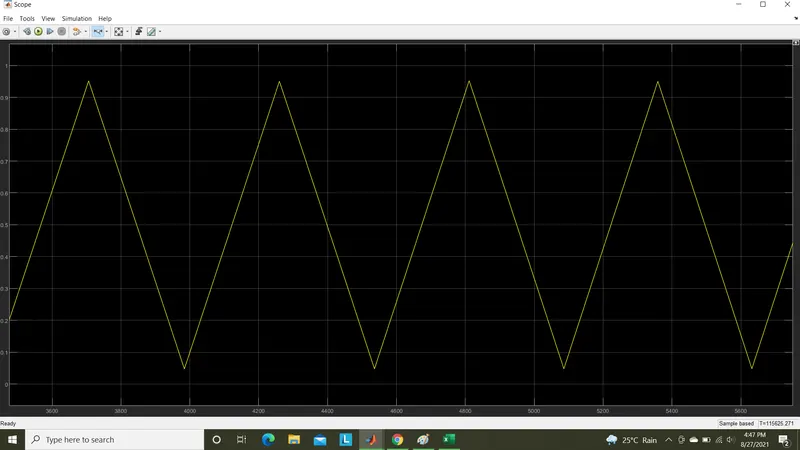
As we have given the controlled current signal as it charge the battery upto 95% from 5% initial charge.
Then while reaching 95% it starts discharging and reaches again 5% and start charging from 5% as shown above.
The charging and discharging of current gets stopped when its operating voltage gets below cutoff voltage.
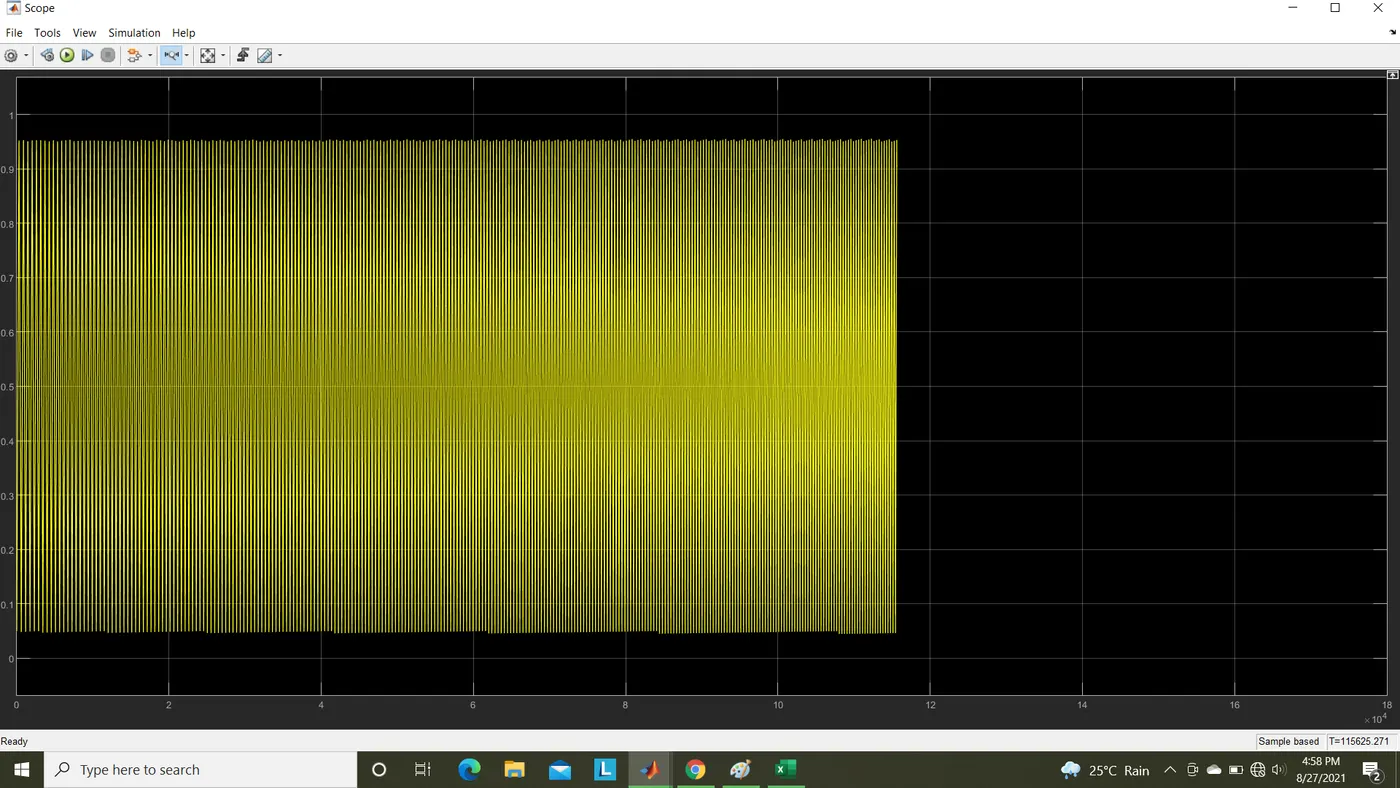
It stopes nearly at 115625 secs as operating voltage reached the cutoff voltage.
At initial one charge and discharge cycle time duration gets as 580 secs as shown below,
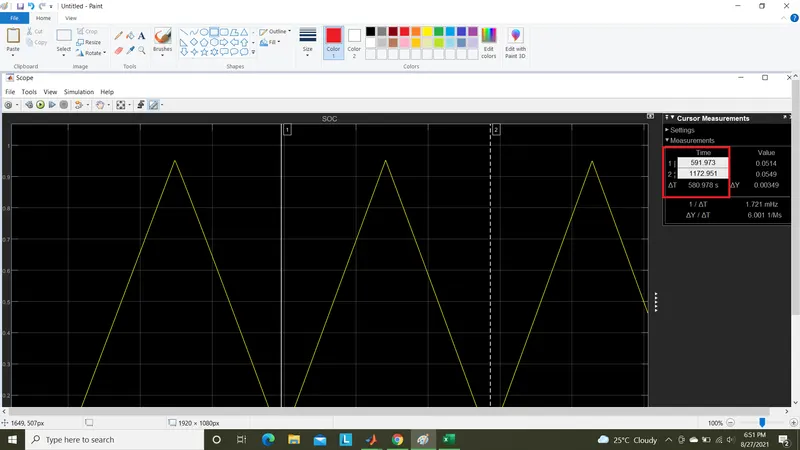
At the end of battery capacity the charge and discharge time is 326 secs as shown below,
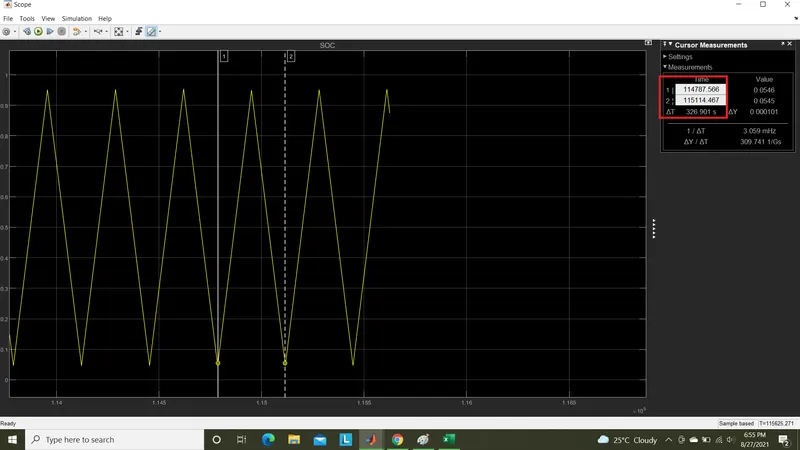
This variation in its charge discharge cycle time shows that its capacity is got depleted.
The voltage plot is shown as below,
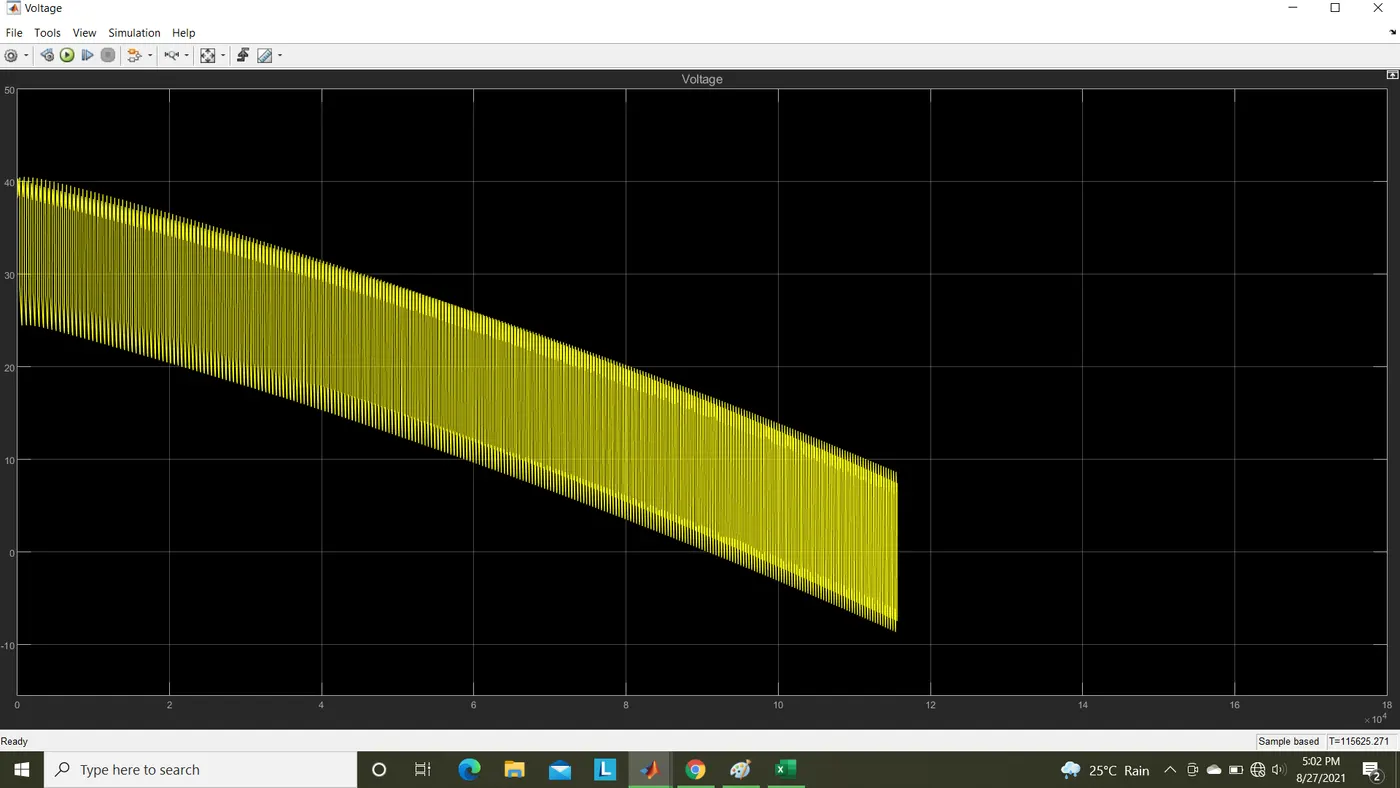
The above image shows that as the life cycles increases the operating voltages decreases and reaching to its cutoff voltage.
This shows after this number of life cycles the capacity of batteruy gets totally reduced and not used for further charging.
The battery initial temperature is given as 298.15K and the source temperature given as 300K.
Thus the Temperature reaches from 298.15K to 301K as shown below,
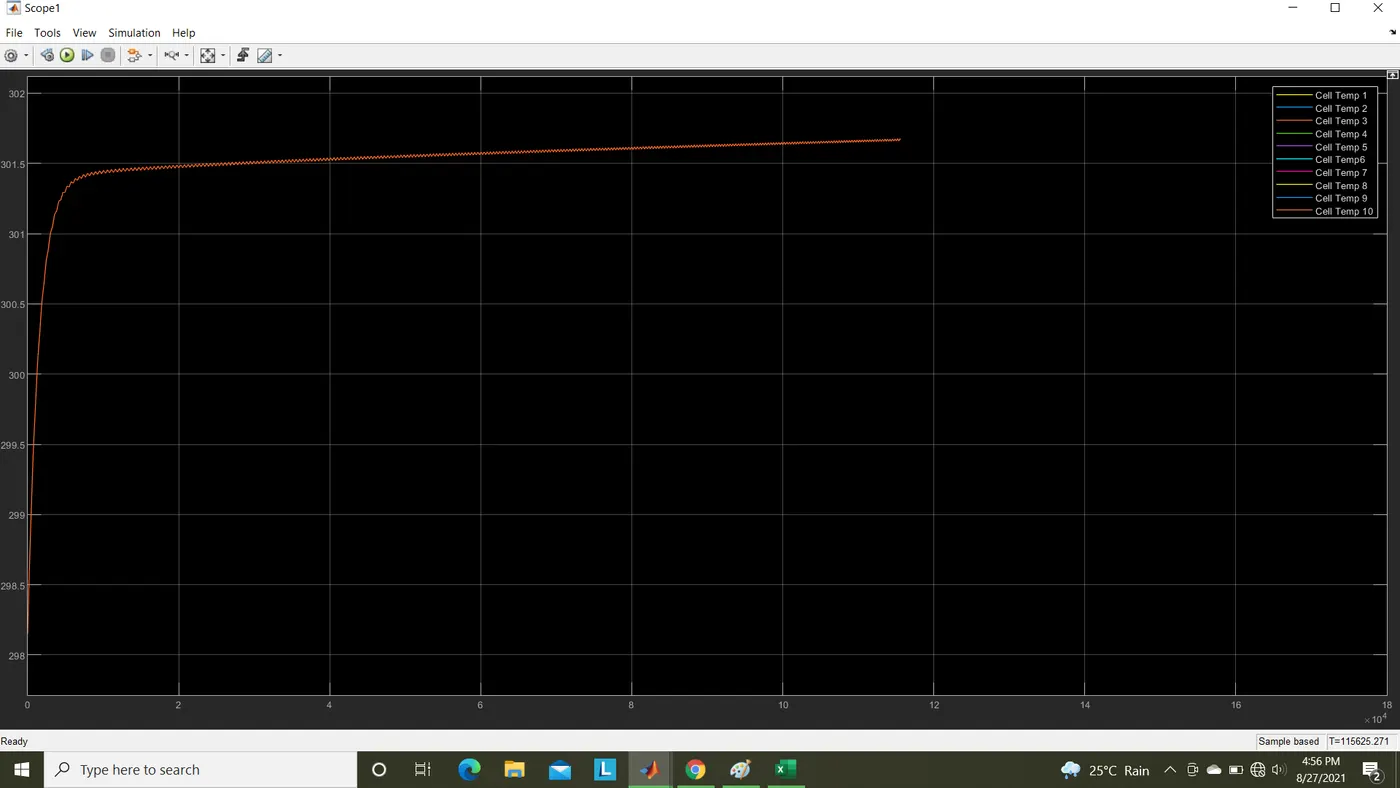
From above image we can say that increase in temperature of battery varies its life cycle performance as we seen above.
At the reach of operating battery voltage to cutoff voltage the simulation gets end as shown above.
B)Changes in life cycle performance with respet to its source temperature:
Lets take two cases as initial temperature of battery remains constant and the source temperature gets varies as shown below,
| Initial Cell Temp(K) | Source Temp(K) | Time taken to reach cutoff voltage |
| 298.15 | 300 | 115625 |
| 305 | 116162 | |
| 310 | 116701 | |
| 295 | 113453 | |
| 290 | 107286 | |
| 280 | 95283 |
Now we can discuss the above table conditions as fallows,
Case 1:
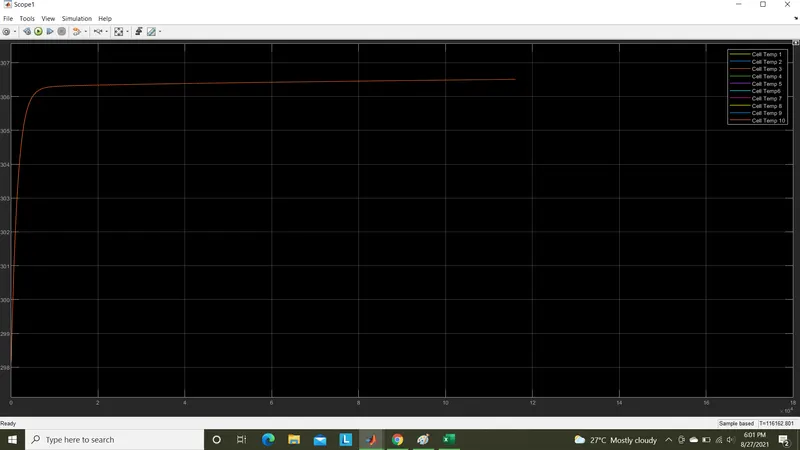
If we change source temperature to 305K and cell initial temperature as 298.15, the time taken to get reach its below charging/discharging capacity level as shown below,
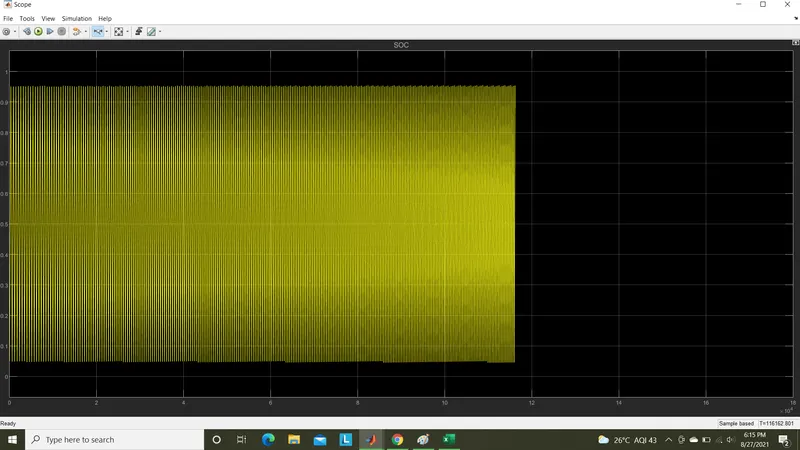
It took 116162 secs to reach its operating voltage to attain cutoff voltage.
Its cell temperature plots as,
Now if we take source temperature as 310 K and the time taken to reach its dead capacity level as,
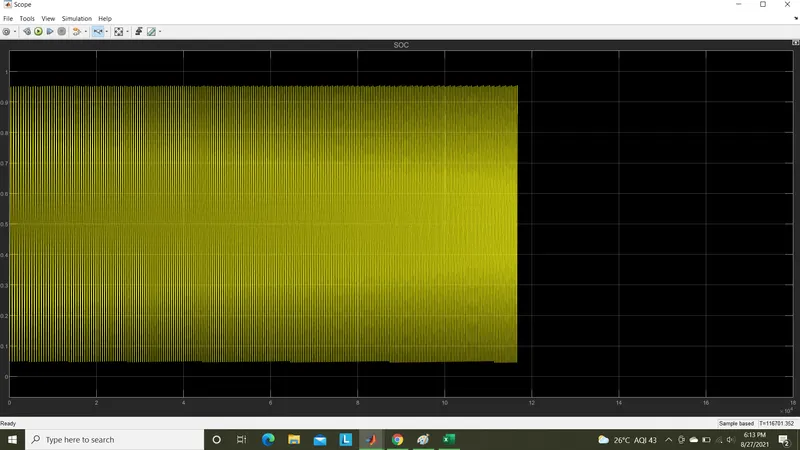
It takes 116701 secs to get its operating voltage to cutoff voltage.
From above casses we can say the life cycle of battery varies according to the change in source temperature.
case 2:
If source temperature is reduced less than the battery temperature as 295K,the time taken to reach its cutoff voltage as shown below,
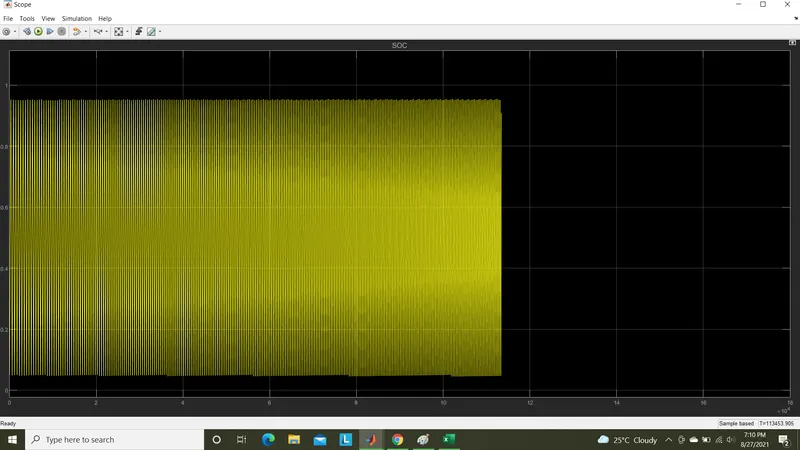
It reaches its cutoff at 113453 secs lesser than above cases.
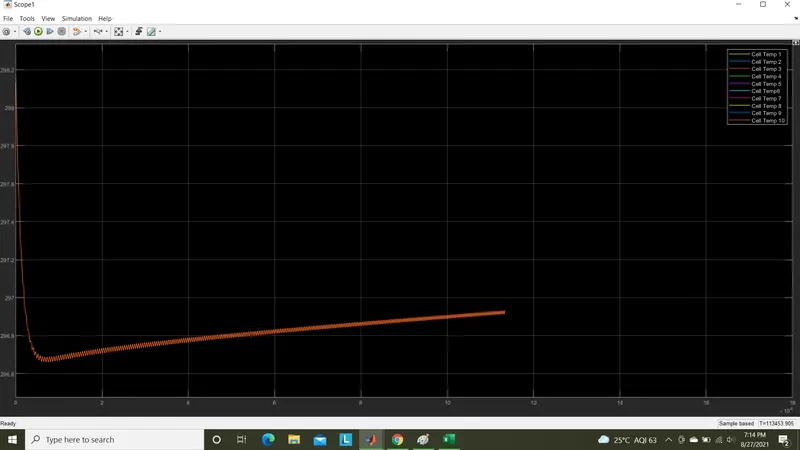
This happens due to as the temperature of cell reduces from its initial temperature.This can be seen as,
C)Change in life cycle in different charge and discharge rate:
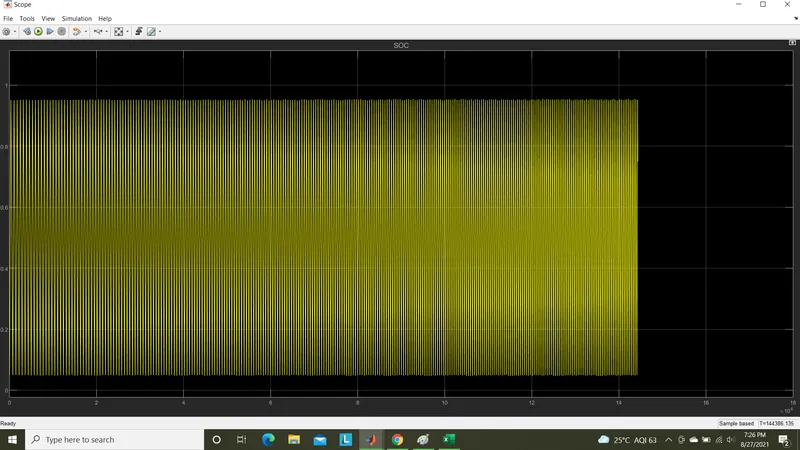
case 1: Charging with 45A and discharging with 30A-
It gets is capacity to nousable capacity in 114386 secs.
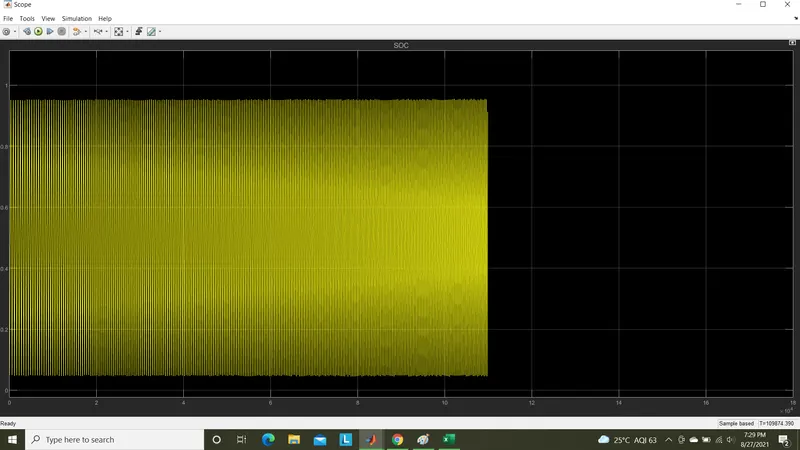
Case 2: Charging with 45 A and discharging with 50A-
We get the cutoff time as 109874 secs.Its lesser than above case as we discharge with higher amps.
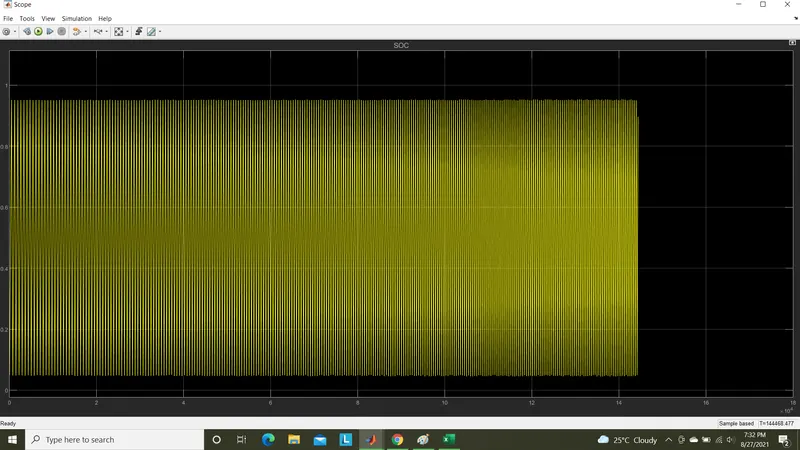
Case 3: Charging with 30A and discharging in 45A.
Here in this case we get the result as 144468 secs.
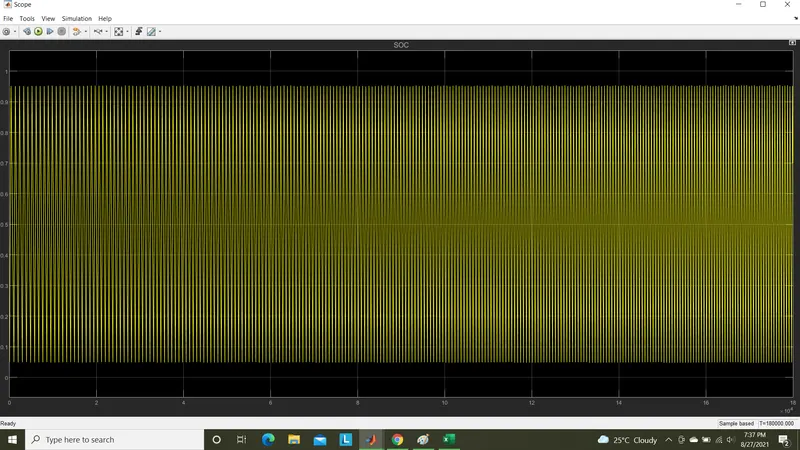
Case 4:Charging with 40A discharging with 20A.
In this case we will get the breakpoint time as greater than simulation time as discharging current as quite lesser.
From the above charge and discharge rates in different cases give as variations in its overall life cycle performance.
Note: Model file with its Variable files are attached with this submission.
Thank you
Submitted by,
Praveen Kumar L V,
Date:27/8/2021.