Week-4 Challenge WOT Condition Part-2(Difference between mapped and dynamic motor,generator engine, Calculation of miles per gallon,HEV ReferenceApplication with WOT drive cycle,Comparing the above model result with pure electric vehicle by having all parameters same),
CHALLENGE 4 (WOT CONDITION PART 2)
1)Difference between mapped and dynamic motor,generator,engine.
Objective:
Here we are discussing about the features of powertrain blockset.In that we are going to face the blocks of motors,generators,engines.
There are the parts of powertrain blocksets.Using these we can make the models of pure EV,hybrid,conventional vehicles and can see the real time changes of its parameters and analyse its
performance related aspects.
Types of blocksets:
Motors: Mapped and dynamic motor blocks.
Generator: Mapped and dynamic generator blocks.
Engine :Mapped and dynamic engine blocks.
Parameters of motor:
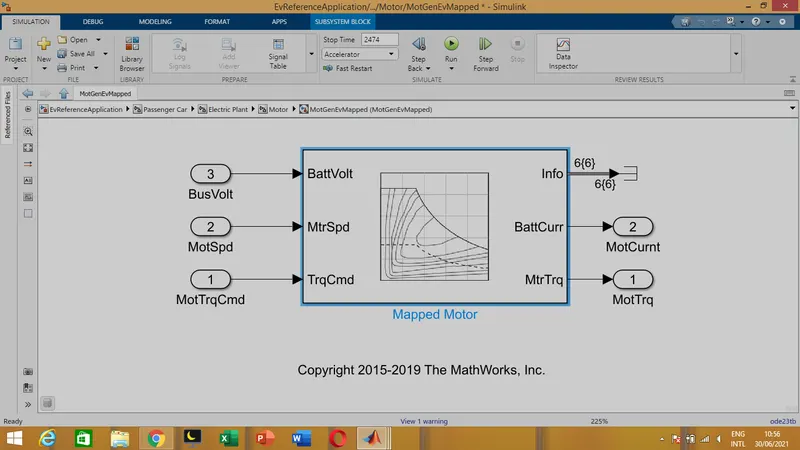
Mapped motor:-
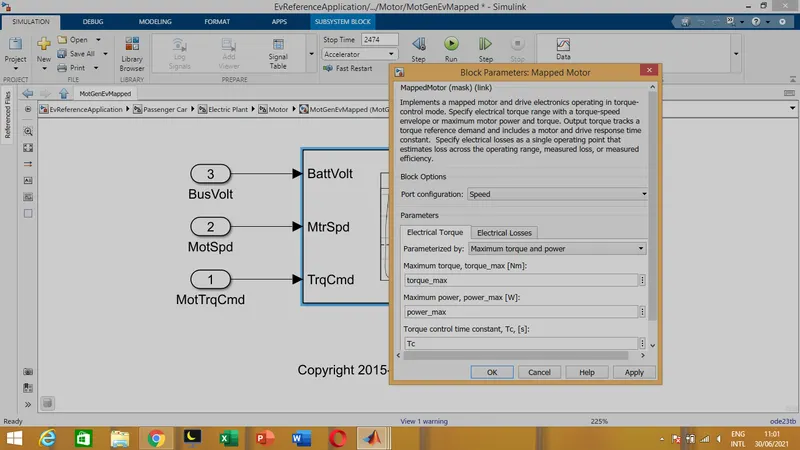
In this mode the motor get controlled by just the tabulated values of readly available torque and speed of the motor through the table data.
The motor control is done by its input torque control with respect to motor its power values. Motor can be parameterised by maximum torque and power or tabulated torque speed envelop.
Electrical losses parameters are also given through the linked tabulated datas.The input for this blocks are motor speed and motor torque command
The outputs we get as motor current, motor torque,motor speed and informations about power losses,power details(Mechanical and Electrical).
The output torque compares its values to the referance values for motor actions.
Dynamic motor:-
Heree we are discussing about the Interior PMSM motor.
Dynamic motors are used when we are having the specifications of motor as additional information.
Here the simulation starting time will tke long period than the mapped model.Here seperate controller set can also be used to control the motor actions.
We can give values for D axis and Q axis inductance values on controller block. This controller controls the speed of the motor based on its field oriented controls.
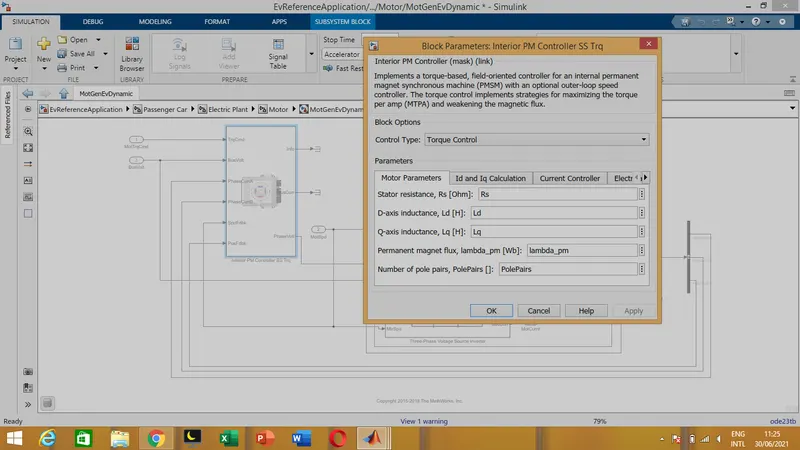
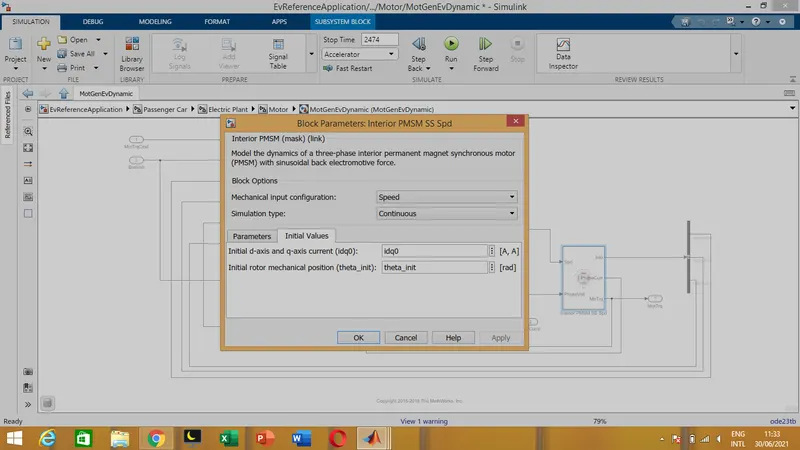
Now here comes the dynamic Interior PMSM motor,
We can give the motor parameters with their internal parts specification values but not as in mapped motor .
Here we are giving no.of poles ,stator resistance,stator d axis q axis inductance values and also initial current values, initial rotor mechanical positions.
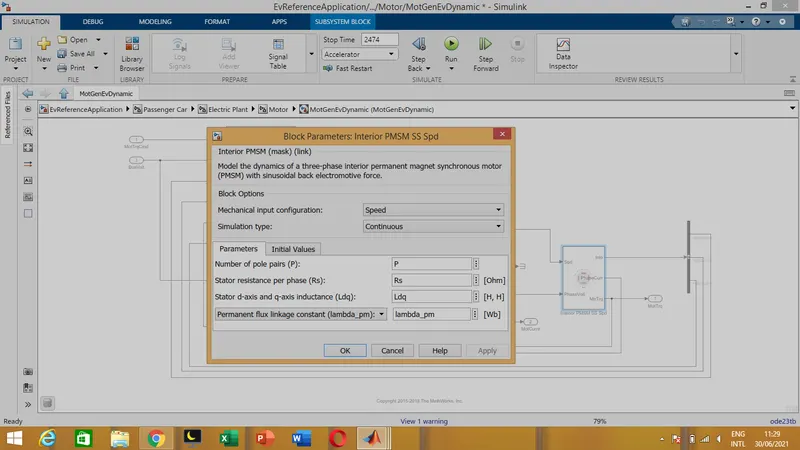
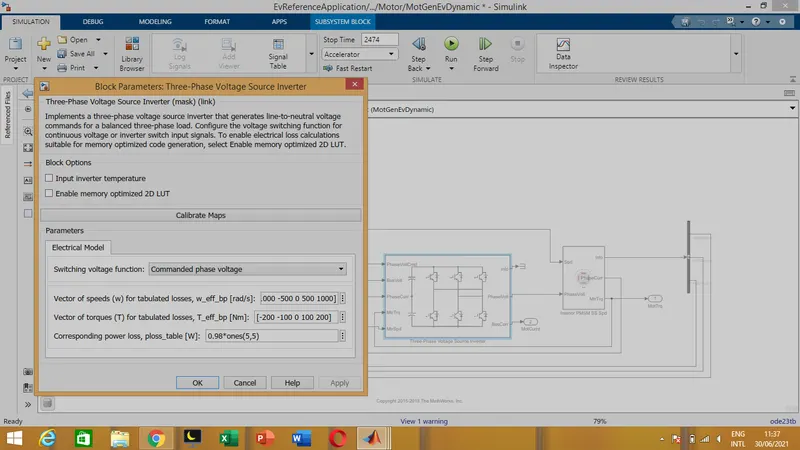
We can connect the controller with the motor using 3 phase inverter model.In mapped model the inverter is inbuilted with standard specification.
But here we can also customize the inverter model.
Like the parameter changes we can classify mapped and dynamic conditions of motor,generator and engine.
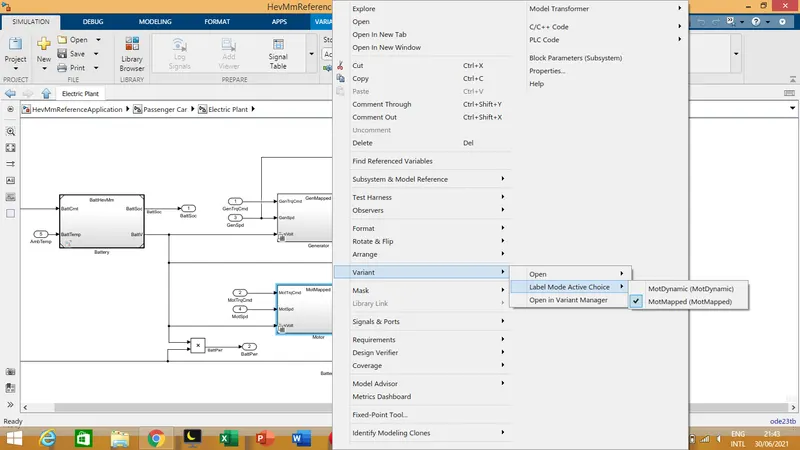
Changing model type:
We can change the type of the model by right click the block we have to change.
Goto varient-->Label model active choice-->Then select our choice as (Dynamic or Mapped type).
2)Calculation of miles per gallon:
Objective:
We have to study the flow of fuel for calculating the miles per gallon value from the model.
Model type:
Here we taking the model "Hybrid Electric Vehicle Multimode Reference Application" powertrain for our study.
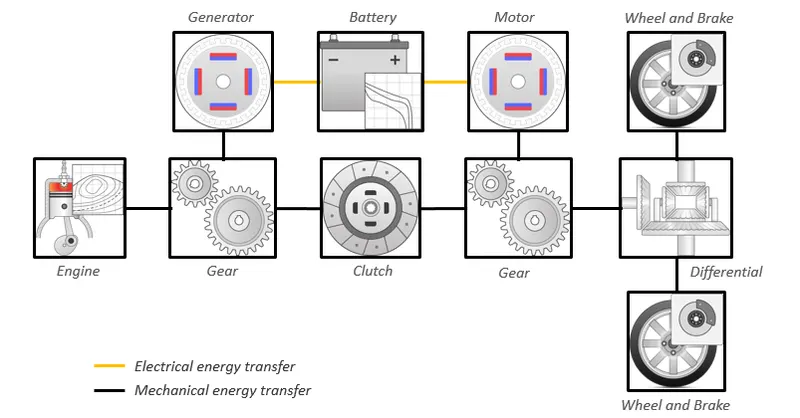
By default the engine,motor,generator are in mapped type configurations.
Calculations:
- From the input value of total miles covered , Fuel flow and the converted value of battery power to US equivalent gallon,we can find out the miles per gallon value.
- The below figure the flow for the calculations.
- We can study by step by steps.
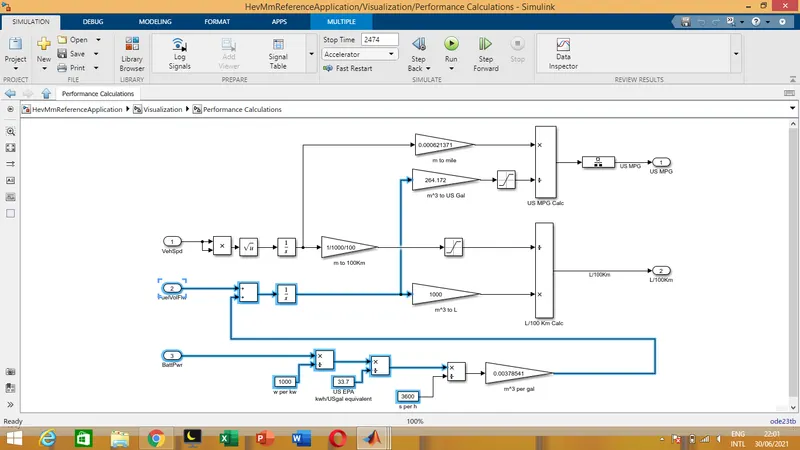
- The battery power ouyput in watts converted to Kw.Then convert them to (US EPA Km/US gallon equivalent) value by divideing with 33.7 .
- Again divide by 3600 for converting to hr value. We get m3/gal value by multiply with gain of 0.00378541.
- Now add this value with direct fuel use of engine and integrate the sum to volume in m3.
- Convert m3 value to US Gal value by multiply gain of 264.172.
- Finally converted vehicle speed value to miles value divided by US Gal value gives us miles/gal value.
3)HEV ReferenceApplication with WOT drive cycle.
Objective:
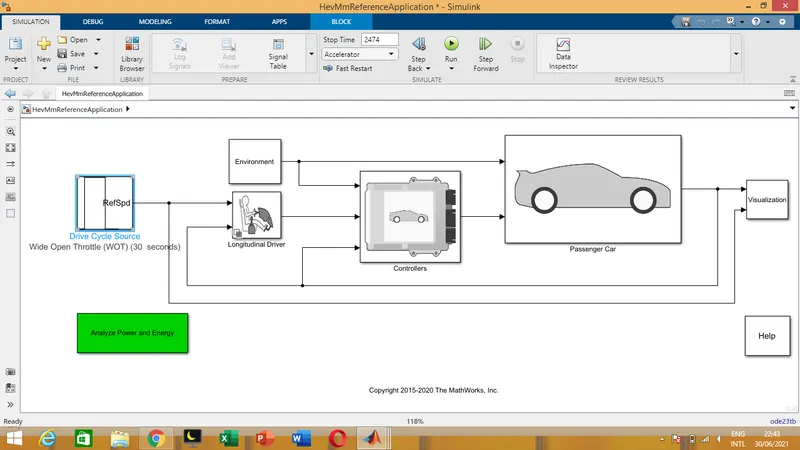
Here takes the model type"Hybrid Electric Vehicle Multimode Reference Application".To study the result when drive cycle changed to WOT drive cycle from default FTP75
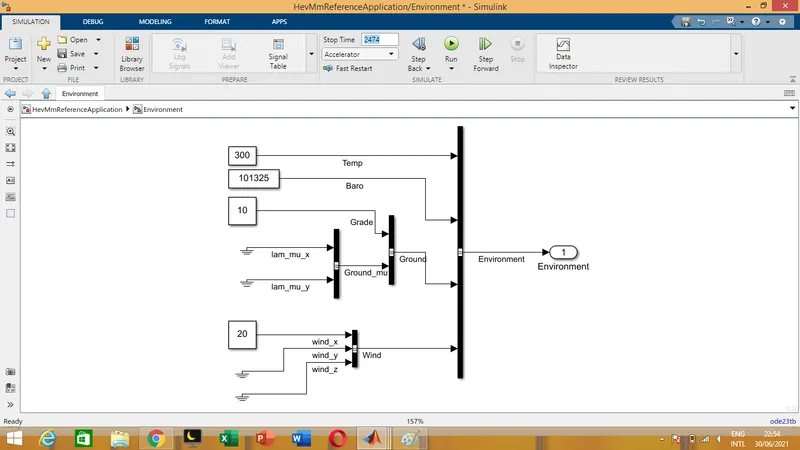
drive cycle.Also we have to change the grade and wind velocity in the environment block.
Model:
FTP75 Drive cycle changed to WOT Drive cycle.
Working:
Change the stop time as per drive cycle.
Here we changed 2474 secs to 60 secs as uploaded drive cycle test is for just 30 secs.
If we are increase the no of testing cycle we have to increase the stop time corresponding to its time.
Change the wind velocity and grade in Environment block.
Here we changed the wind velocity and grade as 20 and 10 respectively.
Now run the model and study the results.
Result:
We are getting the results of velocity,engine, motor, generator rpm's ,their torques, battery current,battery SOC,US fuel economy MPG equivalent.
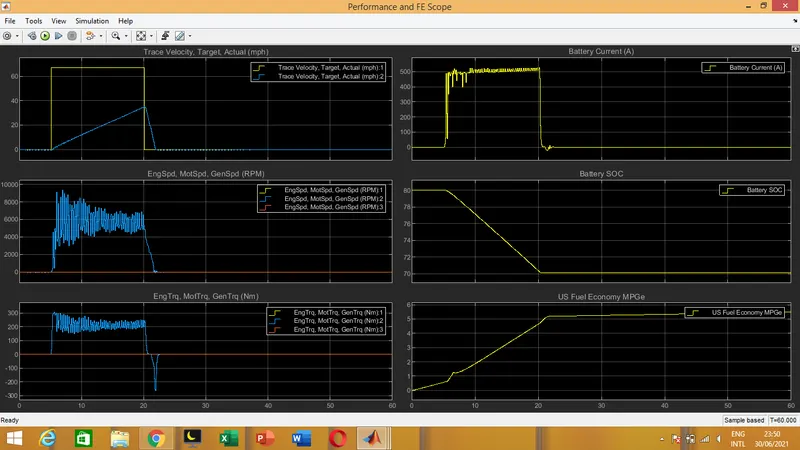
- Here the drive cycle velocity shown as yellow line in left 1st plot.It shows after starting the vehicle the speed is 0 mph,after 5 secs it reaches aound 70 mph in 15 secs by gradual increase of speed.
- In left 2nd plot it show rpm's of engine(yellow),motor(blue),generator(red).Here no engine action is given as for the time interval of 60 secs drive cycle the motor rpm from battery energy alone is taken,that showh in the plot.As engine engine action action is not used here generator action is also in 0 line.
- In left 3rd plot torque related aspects of corresponding engine,motor,generator.Here the motor torque get reversed as speed get reduced suddenly,that makes negligible chargeing of battery shown in battery current plot.
- In right 1st plot shows the battery current usange in Amps.
- In right 2nd plot shows ths state of charge(SOC) in battery. Here it show initially it is 80% and reduced to 70% during the interval of 15 secs.
- In right 3rd plot shows the fuel economy of vehicle. Here it shows after 20 secs at the vehicle in rest its fuel economy is nearly 5.2 MPG.
4) Comparing the above model result with pure electric vehicle by having all parameters same.
Objective:
We have to compare the model results with pure electric vehicle by having all other parameters as above case.
Model:
Here shows changes in pure electric vehicle model having same parameters as above case.
Grade and wind velocity changed as same 20 and 10 as same as before case.
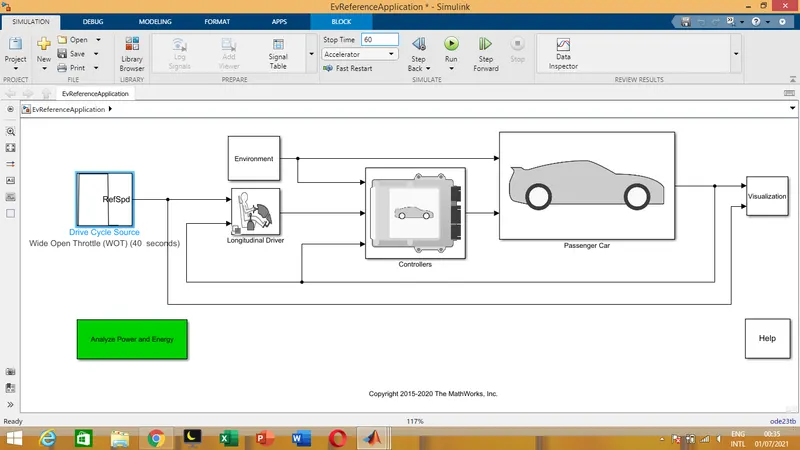
Here only motor is present in this model and acts as generator too while breaking.
No engine and generator are present here.
Now run the model and study the results.
Result:
Here for same WOT drive cycle with same wind velocity and grade,results are
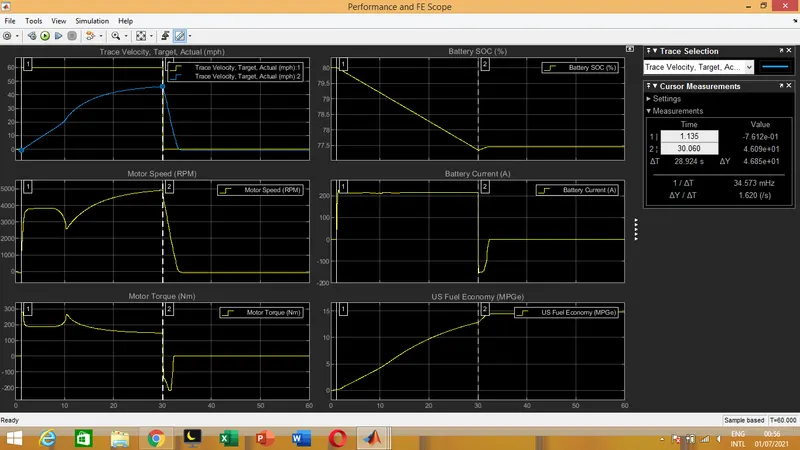
- In left 1st plot,the speed from 0mph to 46mph can be reached in 29 secs.
- In left 2nd plot, the motor speed increases suddenly nearly 3900 rpm and reduced some what to 2500 rpm.Again increase to nearly 5000rpm and starts reducing speed by breaking.
- In left 3rd plot, the motor torque while breaking requces to -240 Nm and get increases to 0 Nm.
- In right 1st plot shows battery SOC reducing from 80% to 77.35% and again get charged to 77.46% in the mean time of (30.06-32.21)secs.Shown in below figure
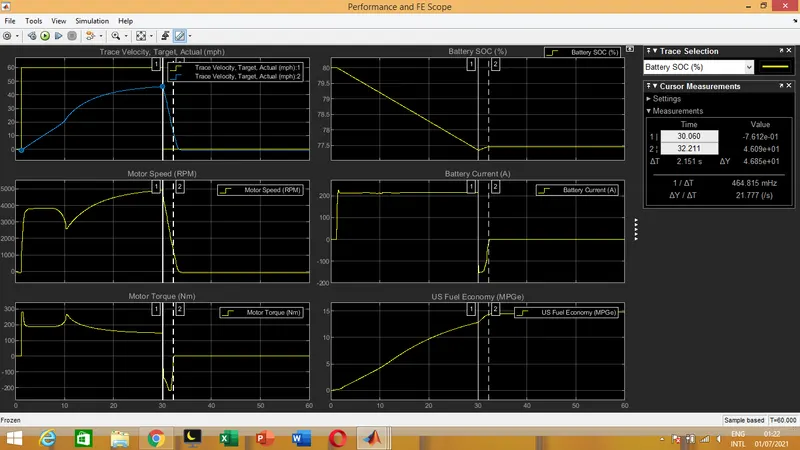
- Also right 2nd plot shows the battery current usange change during the brakeing period.That shows battery get charged minutely in that breaking period.
- In right 3rs plot shows fuel economy at that instantanious positions of the vehicle.
Note: The output result images are attached outside.
Thank you
Submitted by,
Praveen Kumar LV
Date:30.06.2021