Project 2 Thermal modeling of battery pack
For a 10 cell series lithium ion battery model, simulate the thermal effects and compare life cycle performance at various temperatures, charge & discharge rates using MATLAB.
The Lithium-ion batteries are widely used as energy sources in different hybrid and electric vehicle. However, the operation characteristics of the battery in such vehicle are strongly dependent on the operational temperature and therefore with purpose to improve these characteristics a good thermal control system should be utilized.
To analyze temperature and life cycle parameters of the 10 cell series battery pack.
- Connect 10 cells in series analyze the response to a cyclic charge and discharge source.
- Change the ambient temperatures of the battery pack and compare the performances.
- Add the fading parameters of the battery and analyse the performance after each charge/discharge cycles.
The standard example model in simulink is selected which has 20 cells in which one is fault. This example shows how to simulate a battery pack consisting of multiple series-connected cells in an efficient manner. It also shows how a fault can be introduced into one of the cells to see the impact on battery performance and cell temperatures. For efficiency, identical series-connected cells are not just simply modeled by connecting cell models in series. Instead a single cell is used, and the terminal voltage scaled up by the number of cells. The fault is represented by changing the parameters for the Cell 10 Fault subsystem, reducing both capacity and open-circuit voltage, and increasing the resistance values.
The simulink model is as follows. The model is modified to measure and plot the SOC and capacity additional to temperature.
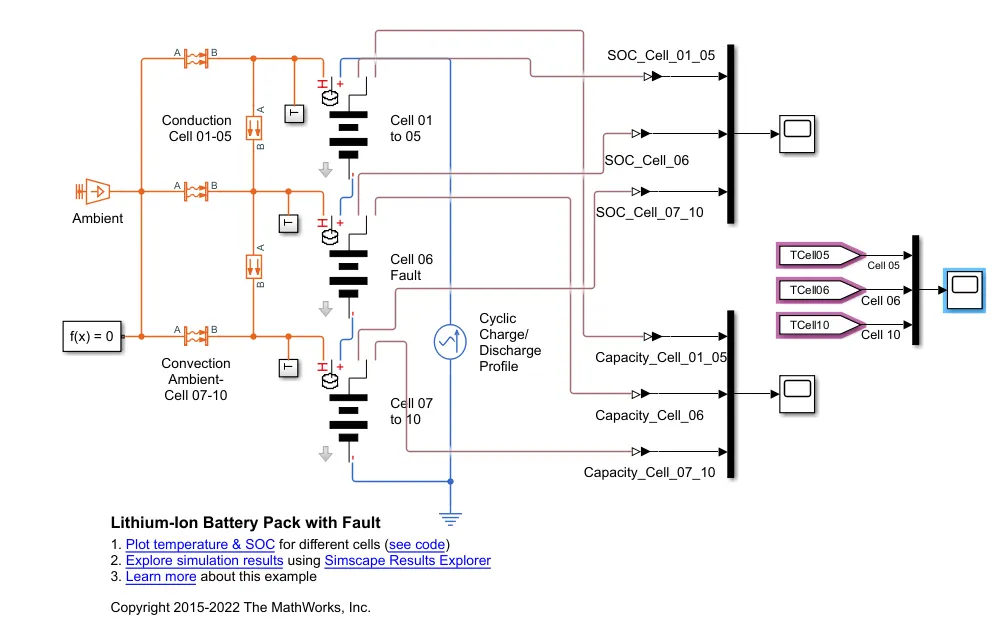
The different blocks used are explained.
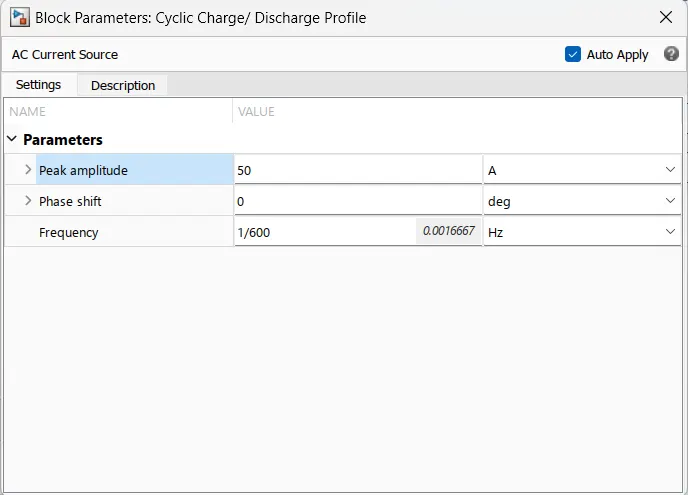
- Cyclic charge/Discharge profile
This block is used to load/charge the batteries as per a particular cyclic way. The ideal AC current source maintains the sinusoidal current through it, independent of the voltage across its terminals. The output current is defined by I = I0 * sin(2*pi*f*t + PHI), where I0 is the peak amplitude, f is the frequency in Hz, and PHI is the phase shift in radians.

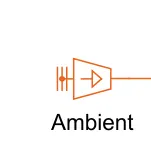
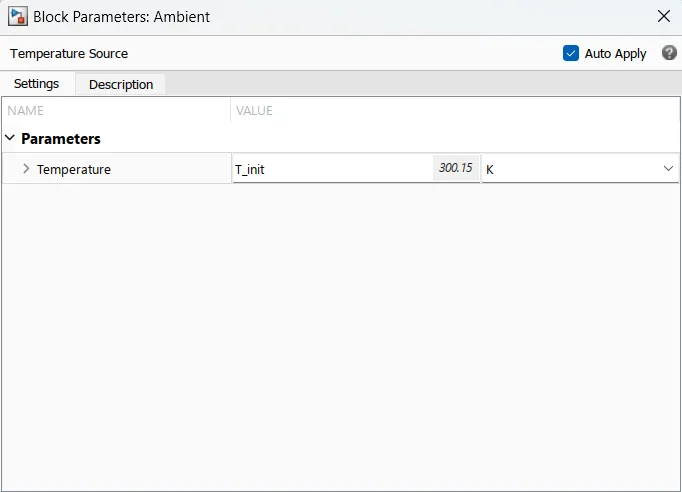
- Temperature Source
This block represents an ideal energy source in a thermal network that can maintain a constant absolute temperature at the port regardless of the heat flow rate.
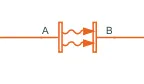
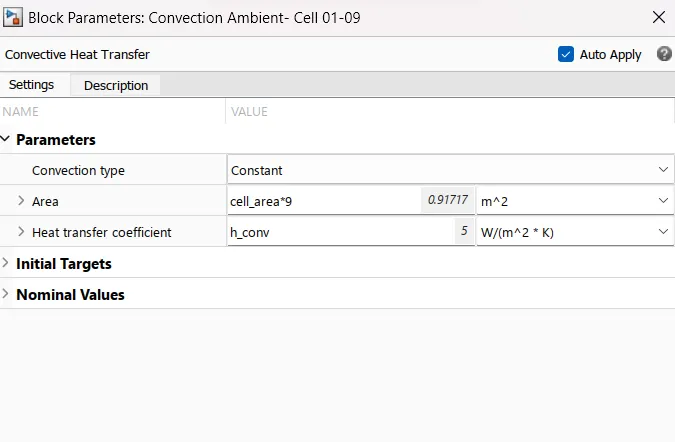
- Convective heat Transfer
This block models heat transfer in a thermal network by convection due to fluid motion. The rate of heat transfer is proportional to the temperature difference, heat transfer coefficient, and surface area in contact with the fluid. The heat transfer coefficient can be either constant or variable. When the heat transfer coefficient is variable, specify it using the physical input signal at port K. If the heat transfer coefficient is variable, it remains at the Minimum heat transfer coefficient if the physical signal falls below this value.
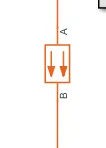
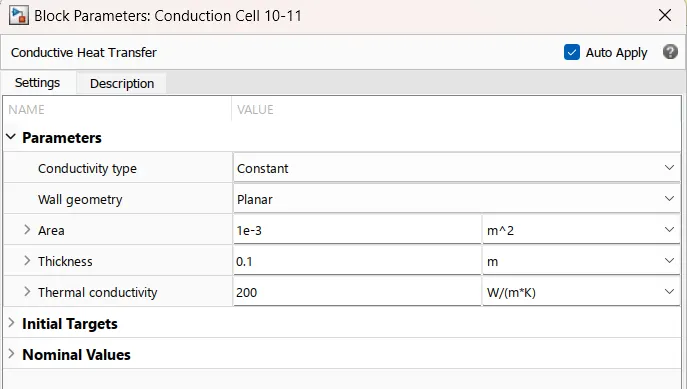
- Conductive heat transfer
This block models heat transfer in a thermal network by conduction through a layer of material. The rate of heat transfer is governed by Fourier's law and is proportional to the temperature difference, material thermal conductivity, area normal to the heat flow direction, and inversely proportional to the layer thickness. The thermal conductivity can be either variable or constant. If the thermal conductivity is variable, you can specify it either as a physical input signal at port K or as tabulated data versus temperature. If the thermal conductivity is specified using the physical signal, it remains at the Minimum thermal conductivity if the physical signal falls below this value.
- Temperature measurement subsystem
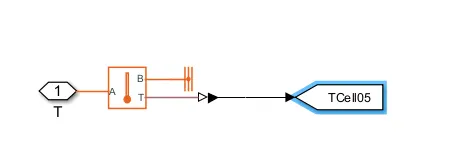
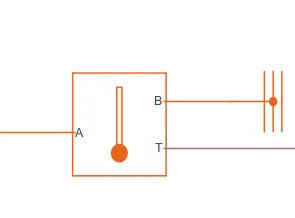
Subsystem created to measure the temperature of cell. Temperature sensor block is used to measure the temperature difference between A & B and give the output at T.
- Lithium cell Subsystem
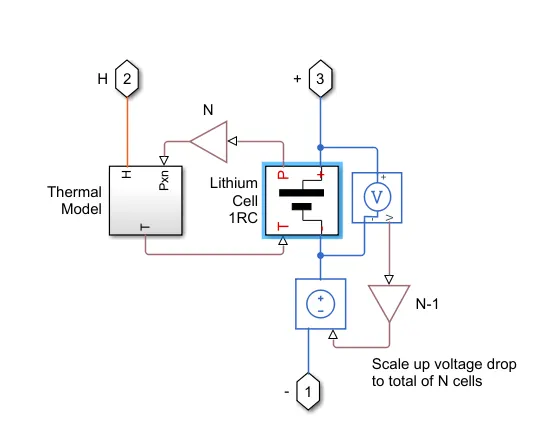
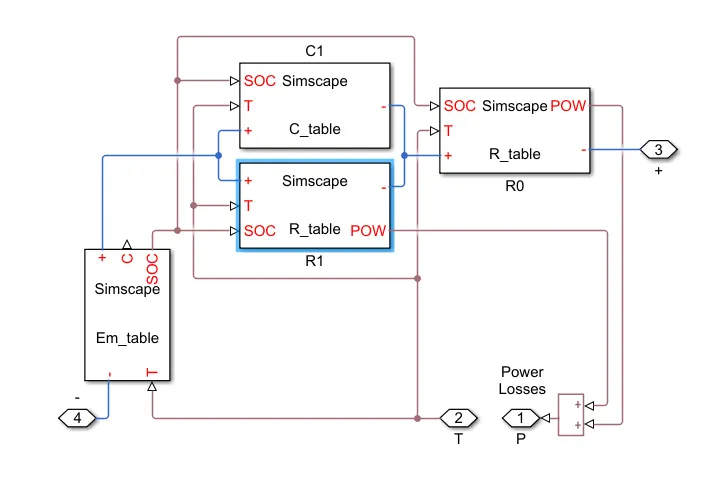
First the voltage is modeled based on table values. This block implements the cell's main branch voltage source, and determines values for capacity (C) and state of charge (SOC). The defining equations depend on cell temperature, T.
The output of this block, SOC and temperature values are given as inputs to 2 resistor blocks and one capacitor block and power is given as output.
This block basically consists of capacitance value table which depends on an external physical signal inputs SOC and T. It is assumed that the capacitance value is slowly varying with time, and hence the equation i = C*dv/dt holds.
Resistance value (R) table which depends on an external physical signal inputs SOC and T.
Voltage value (EM) which implements the cell's main branch voltage source, and determines values for capacity (C) and state of charge (SOC). The
defining equations depend on cell temperature, T.
The cell with fault is designed by reducing the capacity of the battery and OCV and also increasing the resistance. The electrical parameters of the faulty cell is as shown below.
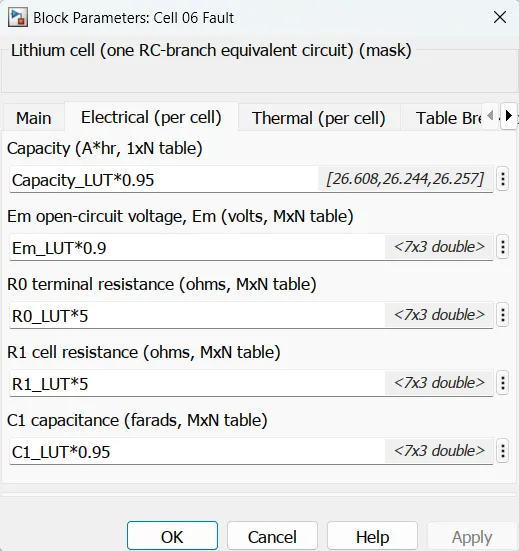
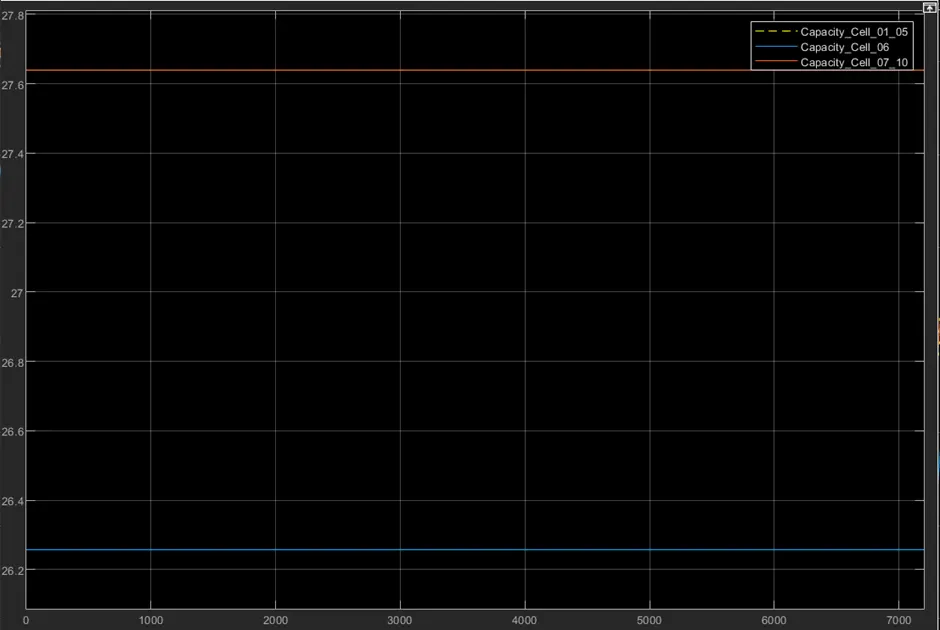
The capacity, OCV and capacitance of the cell is reduced by 5-10% and the cell and terminal resistance are increased by 5 times.
Results
Here, we can simulate the effects of both temperature and charge/discharge rates on the SOC, temperature and capacity.
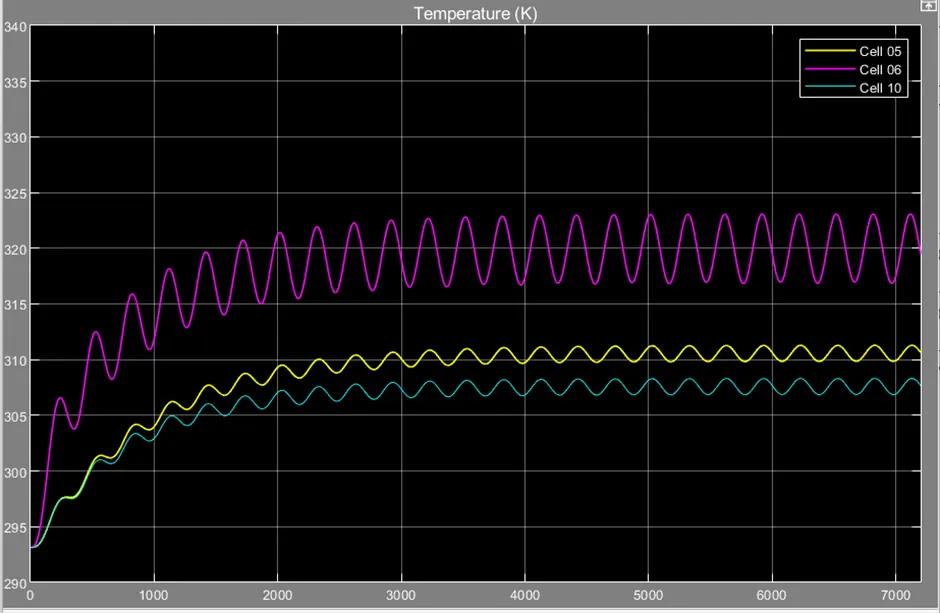
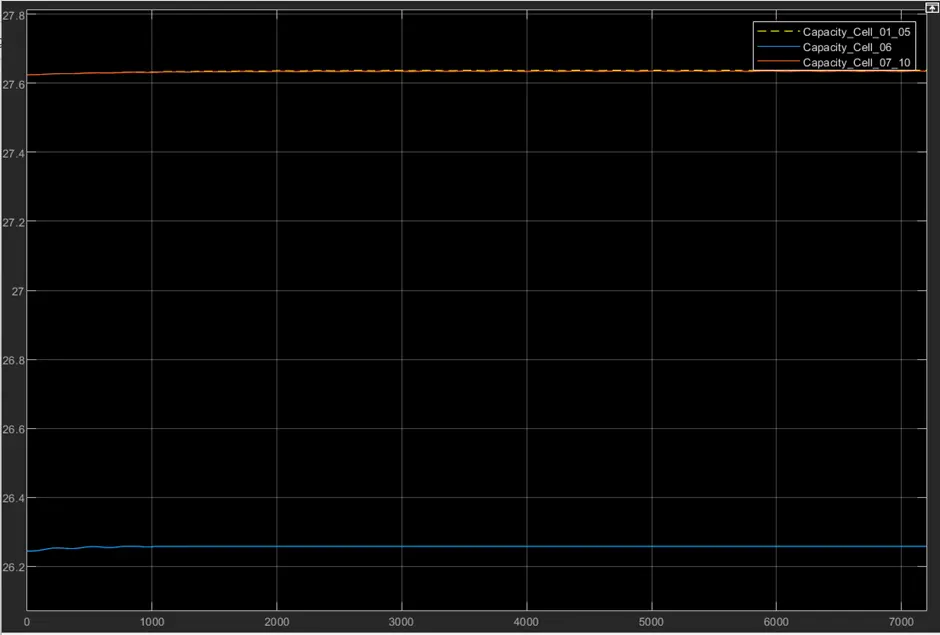
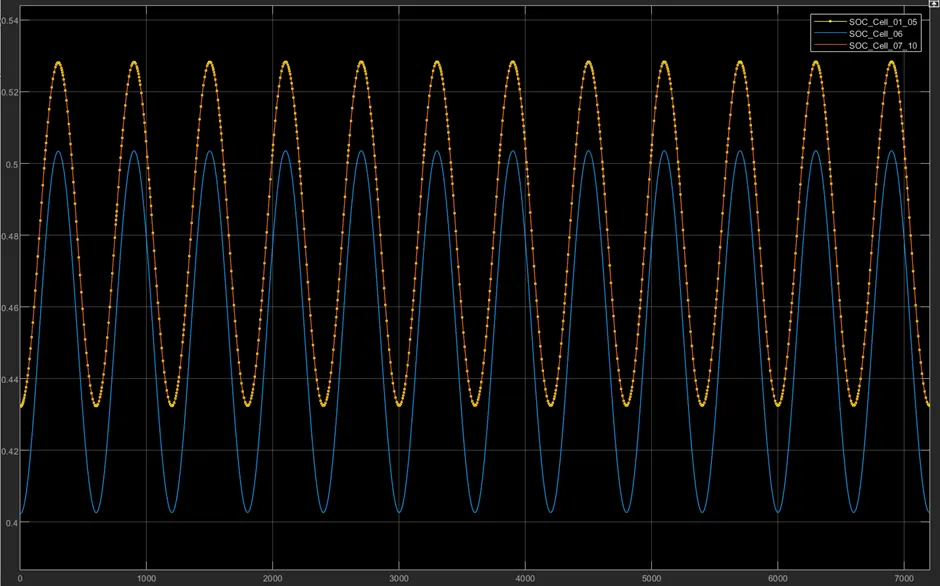
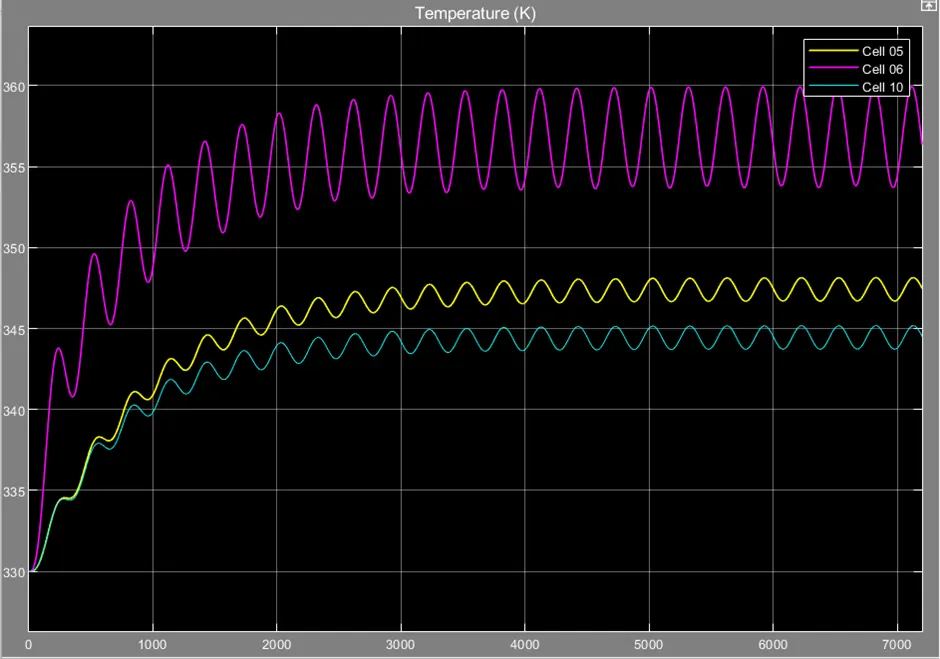
1. Simulation with Ambient temperature at 293K and 50A c rate vs 330k and 50A c rate
At 293K
At 330K
Observations
- At 293K, all cells in good condition are increasing from 293K to 310K over the period due to the charge and discharge cycles. In the second simulation when the ambient temperature is at 330K, we can see that the cell temperature is increasing from 330K to 345K.
- But for the cell with fault, the temperature rise starts from the same point as 293K and 330K. But over the period, the temperature rise in the faulty cell is higher than the cells in the good condition. At 293k initial temperature, the cell temperature increases upto 320K. Also at 330K initial temperature, the cell temp increases upto 355k.
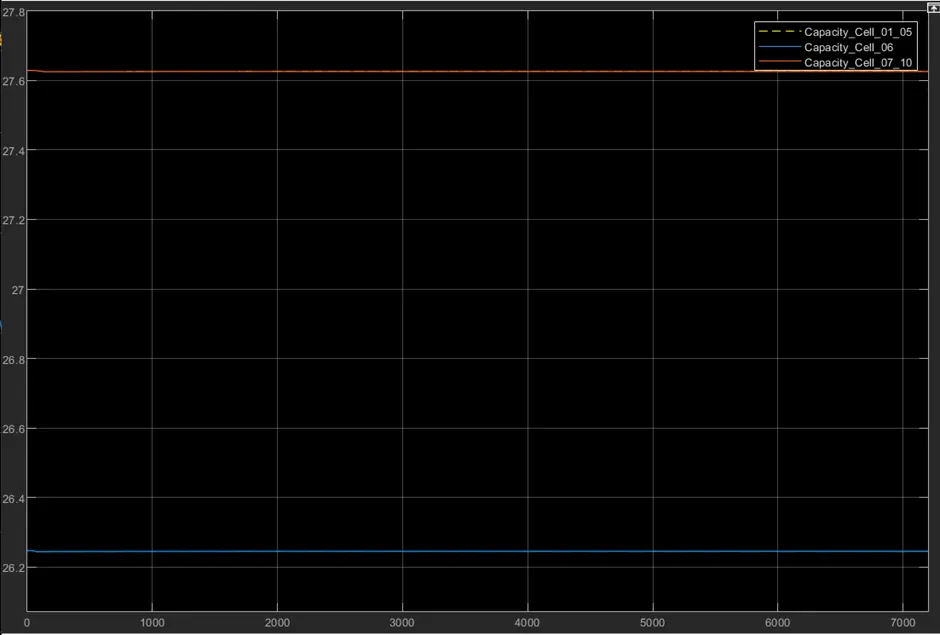
- The capacity remains the same in both simulations
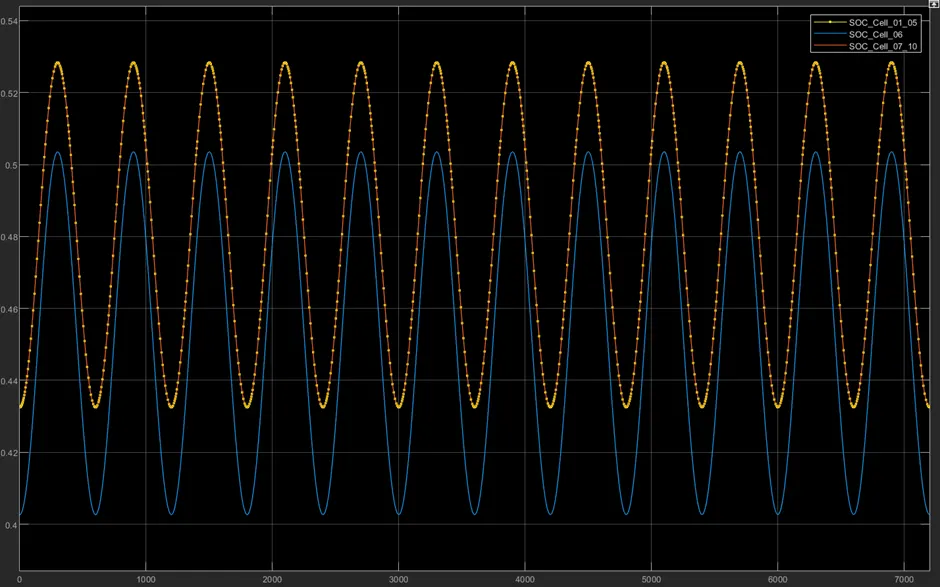
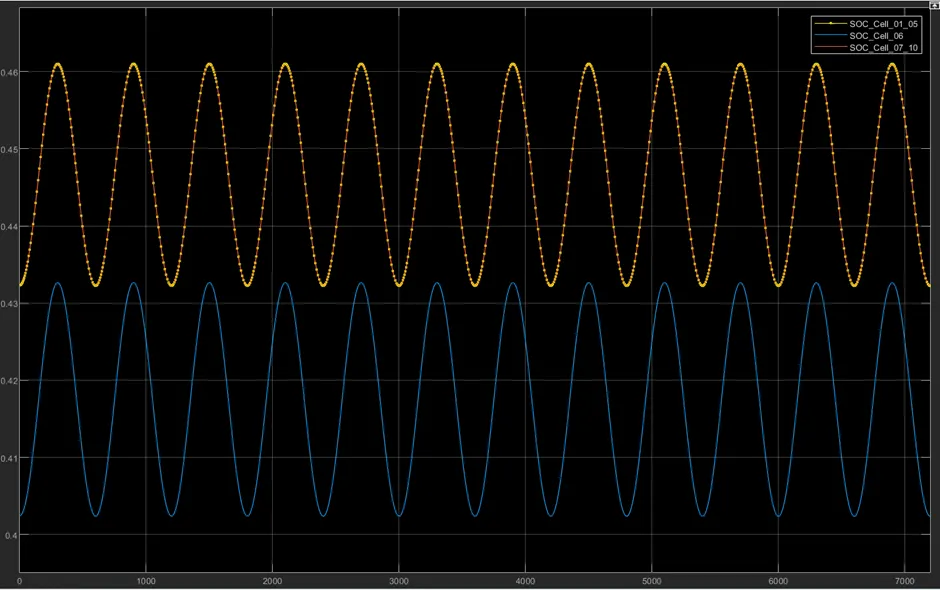
- The SOC also remains same since the charge/discharge rates are same in both condition.
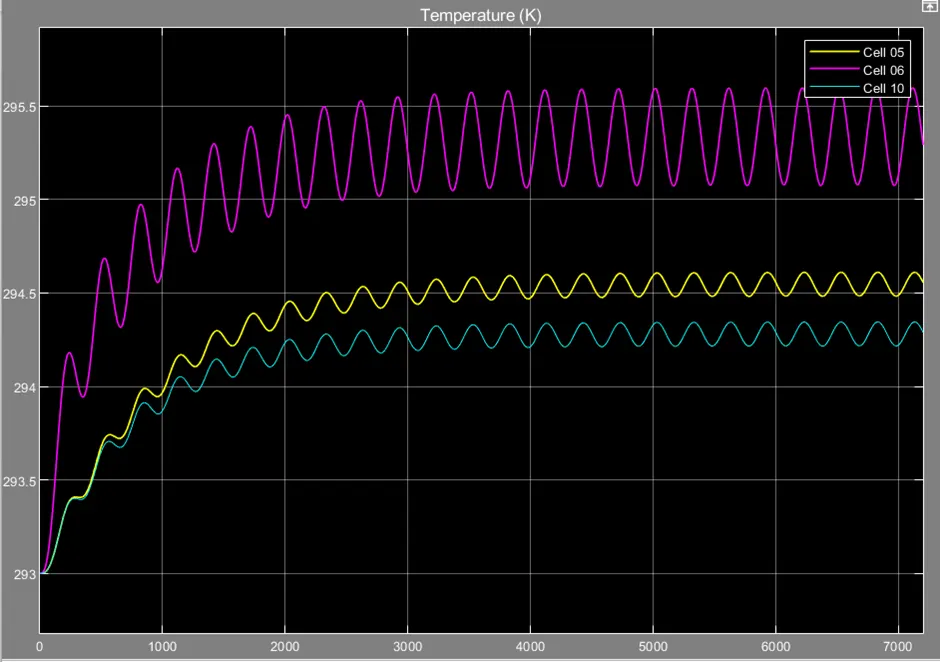
2. Simulation with Ambient temperature at 293K and 50A c rate vs 15A c rate
At 50A C rate
At 15A C rate
Observations
- At 50A C rate, the temperature increases from 293K to 310K for good condition cells and 320K for the faulty cell and at 15A C rate, the temperature increases from 293 to 294.5K for good cells and 295.5K for the faulty cells. its clearly seen that when the C rate is reduced the temperature rise is reduced.
- Capacity remains the same in both conditions.
- SOC for 50A c rate is higher than that of 15A since when C rate is increased, the rate of charging and discharging increases.
Conclusion
Thus for the battery model with 10 cells in series and 6th cell faulty, the variation in ambient temperature and Charge/discharge rates are studied and the effect in cell temperature, SOC and capacity is plotted.