Thermal modeling of battery pack
Aim: To simulate the thermal effects and performance of the Simulink model having 10 cells series Li-ion battery.
Objectives:
- To model a Simulink model having 10 cells connected in series.
- To run the model for different temperatures and contact areas.
- Discuss the plots obtained for different simulations conditions.
Battery pack, A battery pack consists of various electro chemical cells of same chemistry put together. They may be configured in a series, parallel or a mixture of both to deliver the desired voltage, capacity, or power density. The term battery pack is often used in reference to cordless tools, radio-controlled hobby toys, and battery electric vehicles. A battery cell consists of five major components: electrodes – anode and cathode, separators, terminals, electrolytes, and a case or enclosure. For automotive applications, there are different types of cells used Individual battery cells are grouped into a single mechanical and electrical unit called a battery module. The modules are electrically connected to form a battery pack.
Series and parallel connections, in series connection the positive terminal of one cell is connected to negative of the other cell because of which the current passing through the circuit will be constant and the voltage gets added up. Whereas, in parallel connection the positive terminals of all cells connected in parallel are connected together and the negative terminals are connected together. In the parallel connection, the voltage remains unchanged and the current gets added up.
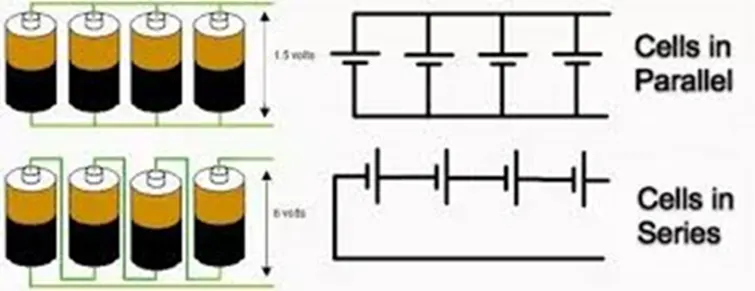
Now that we have seen about series and parallel connections, we are modelling a Simulink model to simulate thermal effects on 10 cells connected in series.
The simscape model to check thermal effect is shown below,
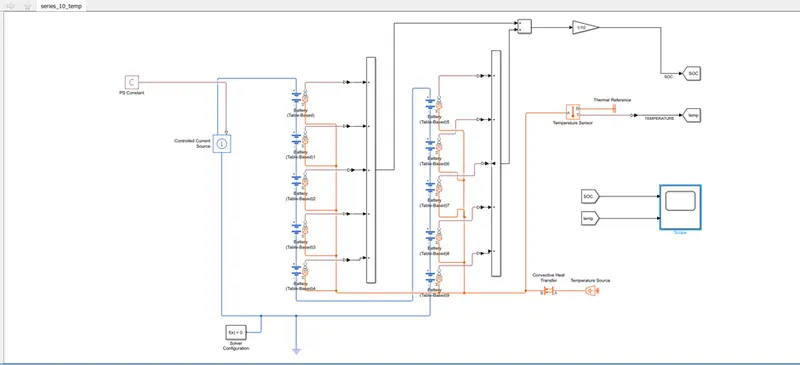
The model has a PS constant block which acts as constant current supply which can also be relplaced by a square wave generater and check the charging and discharging cycles, but for now we are inputting constant current to a controlled current source block. Further, the negative of this block is connected to positive of first cell and the positive of source block is connected to negative of the last cell. The cells in between are connected in series connection. The SOC ports are added for all the cells and the average SOC is taken. the model also has a thermal source connected which provides the thermal input to the cells. The thermal input is given in convective mode hence the convective heat transfer block is used. Since we are using phisical state blocks we are using the electrical reference, thermal reference and the solver configuration blocks.
Now that we have seen the model, we will see about the blocks used inside it.
Battery,
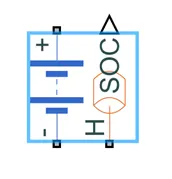
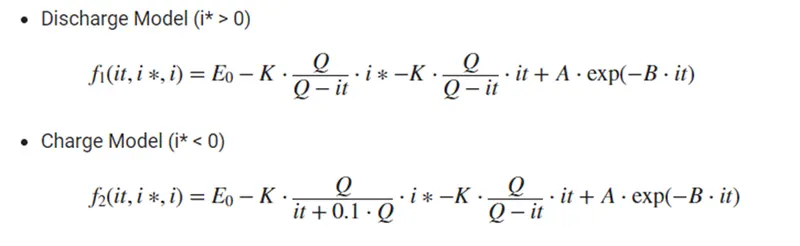
The battery (Table Based) block is used, The block represents a high-fidelity battery model. The block calculates no-load voltage as a function of charge level and optional temperature using lookup tables and includes several modeling options such as, Self-discharge, Battery fade, Charge dynamics and Calendar aging. The battery model for Li-ion uses the equation as shown below which is of the inverse Laplace transform of the equation,
`C_T (dT)/(dt) = P_S – (T-T_a)/(R_T)`
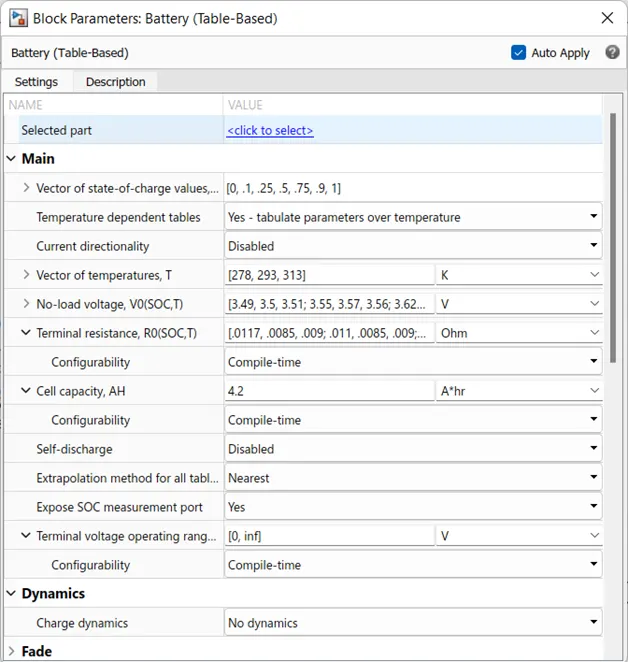
We also have the SOC and thermal port of the battery enabled. The battery parameters are set as shown below with initial SOC as 100%. We can also see the other parameters such as current capacity as 4.2 Ah apart from these we are keeping the remaining parameters unchanged.
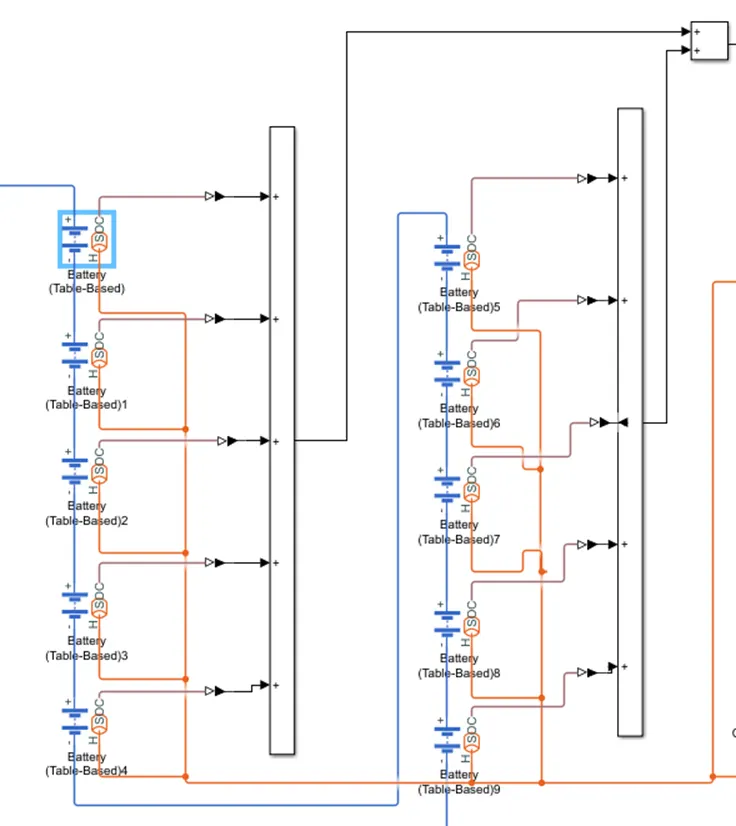
Now that we have got to know about the battery block, we are using 10 such same blocks to connect them in series connection. The below figure shows the cells connected in series where the +ve of one cell is connected to -ve of the other cell. We can also see that the SOCs from the battery blocks are added up this is because SOC of the battery pack is the average SOC of all the cells hence we are adding up all the SOCs and then dividing by number of cells using gain block.
After seeing the series connection of the cells, the current needs to be passed through the circuit. The battery is then connected to a controlled current source since it is discharging the +ve of the battery with the -ve of the source and vice versa while charging.
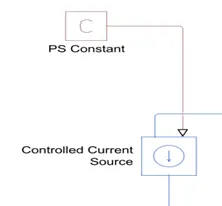
A PS constant block is connected to the source which gives the constant input of current as 4.2A (indicating 1 C-Rate) which can be varied through constant block.
The SOC ports from the cells are averaged and connected to a scope block to see the SOC behaviour over simulating for 1Hrs, in order to do so the physical signal is converted to Simulink signal through a PS to Simulink converter.
In the thermal port, the signal from the convective heat transfer block is fed in which gets the input signals from a temperature source.
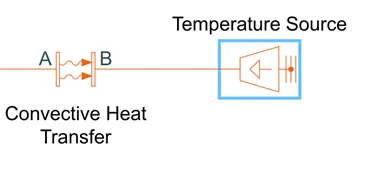
The Temperature Source block represents an ideal energy source in a thermal network that can maintain a constant absolute temperature at the port regardless of the heat flow rate.
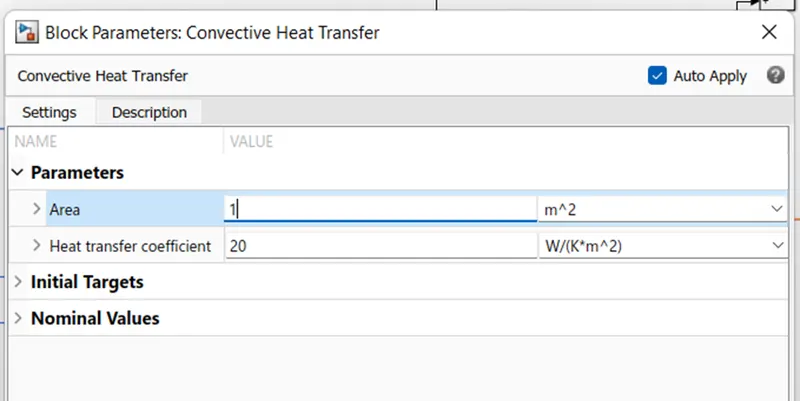
And the convective heat transfer as name suggests the block models heat transfer in a thermal network by convection due to fluid motion. The transfer is governed by the Newton law of cooling and is described with the following equation,
`Q = K*A (T_A-T_B)`
Q = Heat flow
K = convection heat transfer coefficient
A = Surface area
TA and TB = Temperatures of the bodies
The parameter of the block is shown below,
There is a temperature Sensor block connected to the circuit to check the changes in temperature the model consists of a electrical reference and a thermal reference as both electrical and thermal blocks are used for modelling.
The output from SOC port of battery and the temperature port of temperature sensor are connected to a scope block.
The simulation was conducted for area of contact of 1m2 and 1 C-Rate and temperature source at 00 C (263.15 K).
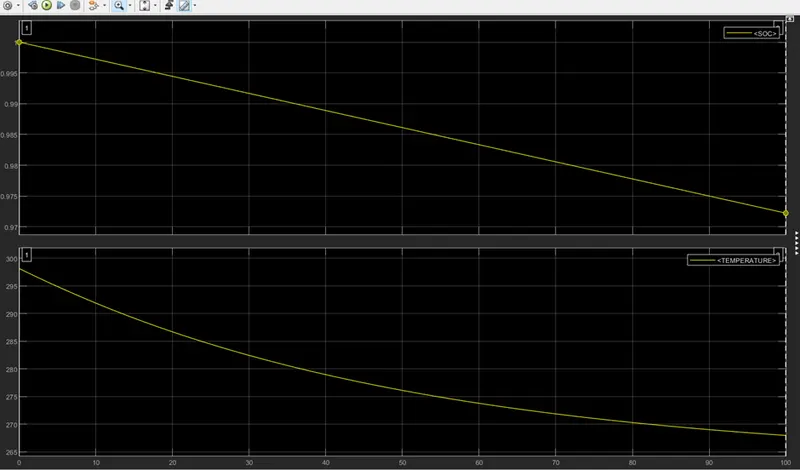
We can see that discharging the battery at 1 C-Rate for 100 seconds the SOC drops from 100% to 97.22% and the cell temperature is 298.15K, whereas the thermal source temperature is 263.15K (0 deg) we can see that after 100 seconds the temperature drops around 268K. this drop is due to the change in temperature values between the cells and source.
Now for the same condition we are simulating by changing the area of contact from 1 Sqm to 10 Sqm.
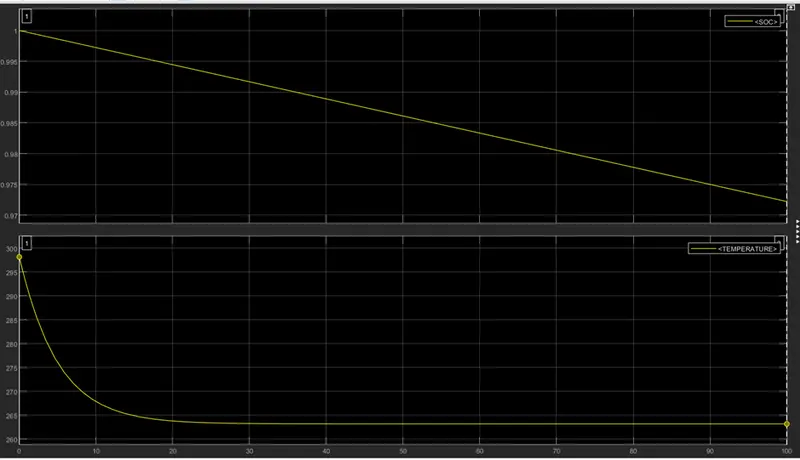
we can see that, the SOC remains same and the temperature changes from 298.15K to 263.15K, by which we can see since the area of contact is high the transfer of heat is high when compared with 1 Sqm.
Now the same model is simulated for the parameters such as, thermal source higher than the cell temperature i.e., at 300K and area of contact of 1 Sqm.
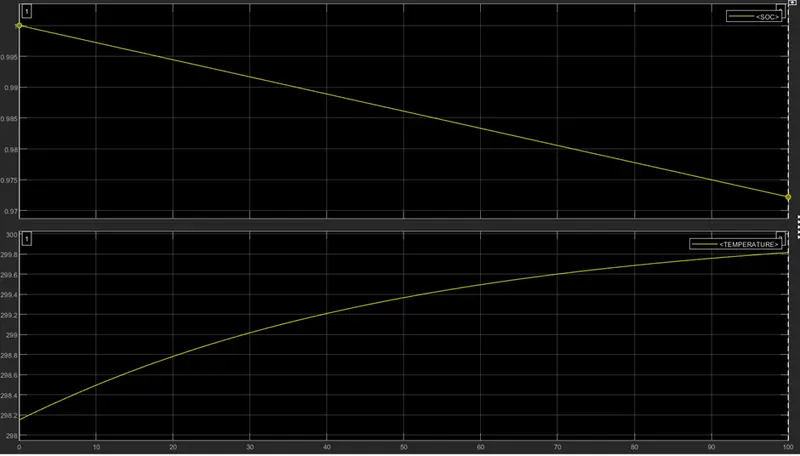
We can see that, the SOC drops down to 97.22% and the temperature rises as we have the thermal source higher than the cell temperature. The temperature rises from 298K to 299.814K which is slight increase, whereas we can see the temperature rising even more for higher contact area of 10 Sqm as seen below.
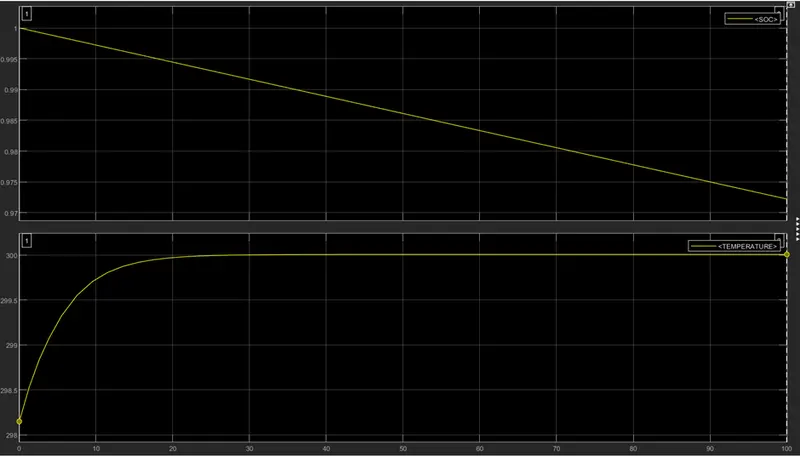
The temperature matches the thermal source temperature. Also we can see that the temperature starts to match much faster when compared with the one having lesser contact area.
The result when simulated with thermal source at 323K is shown below.
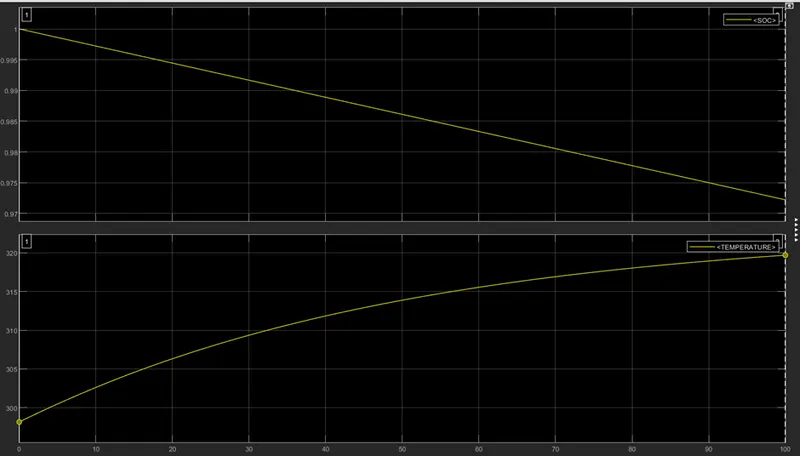
We can see there is 21.5K increase over the simulation time and for 10 Sqm the temperature reaches 323K and the increase of temperature is around 25K.
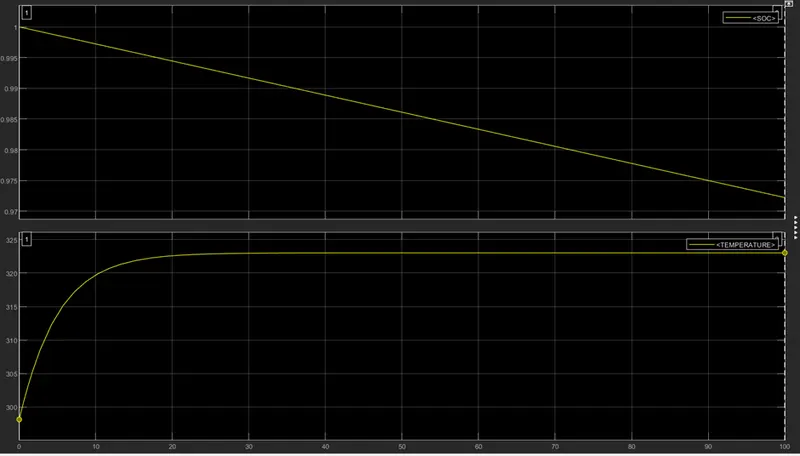
From these above plots we can see that the temperature changes when there is miss match between the cell temperature and thermal source. This change is faster when the area of contact is higher or in other words the higher the area of contact the faster the change in temperature.
Some simulations were conducted for different C-Rates at different temperatures and the results are as shown below.
For 300K, 2 C-Rate and 10 Sqm are of contact,
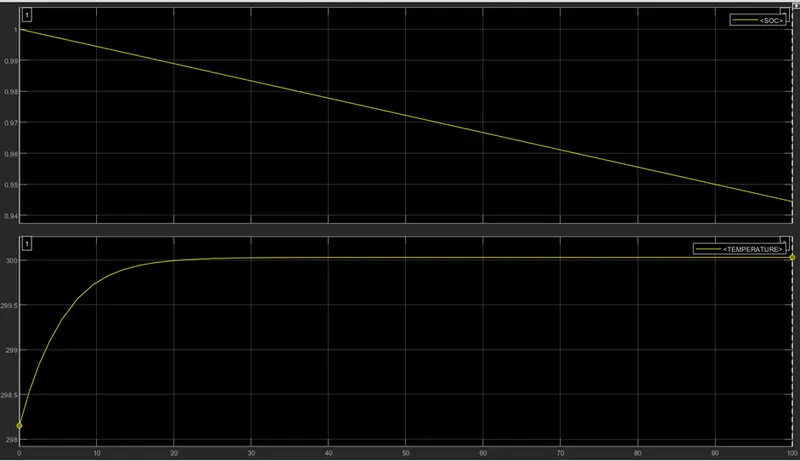
For same conditions with 1 C-Rate the SOC at the end of simulation was 97.22% whereas for 2C-Rate it is 94.44%, similarly for 3C-Rate it was observed as, the SOC dropped to 91.67%.
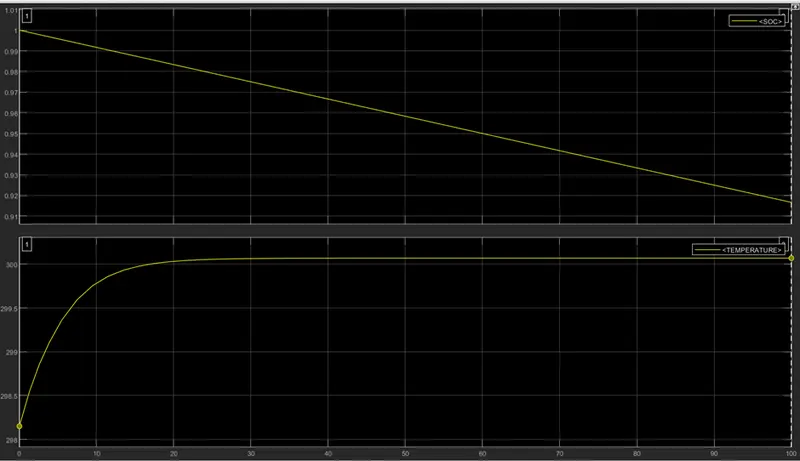
From the above plots we can see that, on changing the C-Rate the SOC is also changing for the same simulation period also there is change in temperature as well, this is because of the cell operating in higher rate. Hence for same area of contact and thermal source and increasing the C-Rates the SOC varies as well as the temperature varies.
Conclusion:
The Simulink model having 10 cells in series connection to simulate the thermal effects was modelled and the simulation was carried out, the results were discussed.
References:
https://in.mathworks.com/help/sps/powersys/ref/battery.html;jsessionid=6404bc7f8f98ecdcf51c75a6f6f8