Project 2 Thermal modeling of battery pack
Project 2
Thermal Modelling of Battery Pack
Question :
For a 10 cell series lithium ion battery model, simulate the thermal effects and compare life cycle performance at various temperatures, charge & discharge rates using MATLAB.
Aim :
Create a model in MATLAB for 10 cell series lithium ion battery, simulate the thermal effects and compare life cycle performance at various temperatures, charge & discharge rates.
Battery Thermal Management :
Batteries work based on the principle of voltage differential and at high temperature, the electron inside becomes excited which deserves the difference in voltage between the two sides of the battery. Because batteries are only manufactured to work between certain temperature extremes, they will stop working if there is no cooling system to keep it in working range.
If there is a larger internal temperature difference it can lead to different charge and discharge rates for each cell and deteriorate the battery pack performance. potential thermal stability issues such as capacity degradation, thermal runaway, and fire explosion could occur if the battery overheats or if there is nonuniform temperature distribution in the battery pack. In the face of life-threatening safety issues, innovation is continually happening in the electric vehicle industry to improve the battery cooling system.
Temperature affects batteries in five major ways:
- operation of electrochemical system
- efficiency and charge acceptance
- power and energy efficiency
- safety and reliability
- life and life-cycle costs.
For battery packs it is important to regulate the pack to remain in the desired temperature range for optimum performance and life, and also to reduce uneven distribution of temperature throughout a pack which would lead to reduced performance.
Effect of Heat on battery:
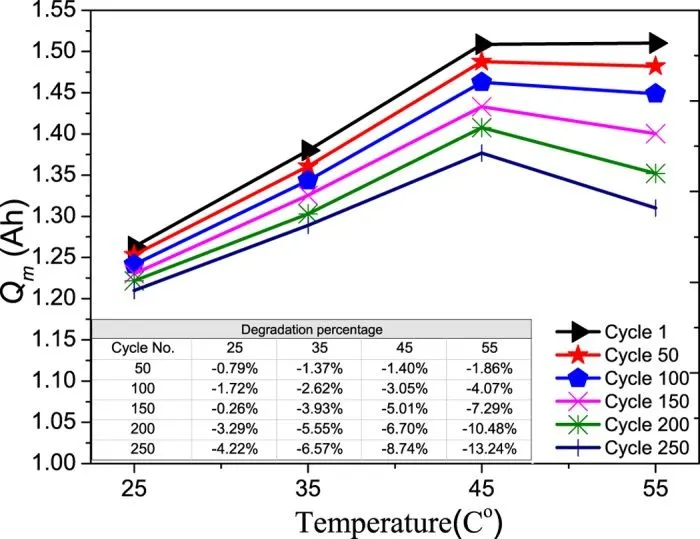
When temperature increase that affects the chemical reactions which occur inside of a battery. As the temperature of the battery increases the chemical reactions inside the battery also quicken. At higher temperatures one of the effects on LIBs is greater performance and increased storage capacity of the battery. A study by scientific reports found that an increase in temperature from 77°F to 113°F led to a 20% increase in maximum storage capacity. However there is a side effect to this increased performance. The lifecycle of battery is decreased over time. In that same study, it was found that when the battery is charged at 113° versus 77° the lifecycle degradation was much more significant at the higher temperature. For the 1st 200 cycles the battery performance only degraded 3.3% at 77 degrees; at 113 degrees the performance decreased by 6.7%. That’s more than double the amount of degradation! Based on the greater degradation at higher temperatures, the battery lifecycle can be severely diminished due to consistent exposure to extreme heat. While heat exposure does temporarily increase battery capacity the damage that it does to the lifecycle can cause long term problems and prolonged heat exposure should be avoided. The following figure shows the degradation on the capacity according to the increase in temperature.
Effect of Cold on Battery :
Prolonged exposure to cold temperatures also has a big impact on battery performance and safety. When temperatures drops, the internal resistance of the battery is increased. This means that it requires more effort by the battery to charge, in turn lowering the capacity(Ah). However, it is important to note that the loss of capacity also depends on the charge and discharge rates and effect of the cold weather is different for batteries made with different chemistries. The operating temperatures of batteries are also different based on the type of battery we are working with. For example, LIBs can be charged from 32°F - 113°F and discharged from –4°F - 140°F (however if you operate at such high-temperature levels you do run into the problems mentioned earlier). But Lead-acid batteries can be charged and discharged from -4°F to 122°F. It is very important to be aware of the charging temperatures that a battery can accommodate. If batteries do not operate at the accepted temperature, charge acceptance will be decreased because ion combination will be slower. Forcing high current can build up pressure causing explosions of sealed batteries. The following figure shows the voltage and capacity variations with respect to the different temperatures.
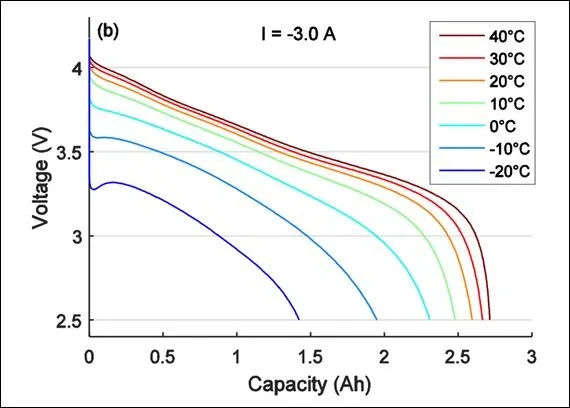
Battery capacity is reduced as temperature goes down, and increased as temperature goes up. This is why your car battery dies on a cold winter morning, even though it worked fine the previous afternoon. If your batteries spend part of the year shivering in the cold, the reduced capacity has to be taken into account when sizing the system batteries. The standard rating for batteries is at room temperature 25°C (about 77° F). At approximately -22° F (-30° C), battery capacity drops to 50%. At freezing, capacity is reduced by 20%. Battery charging voltage also changes with temperature. It will vary from about 2.74V per cell at -40° to 2.3V per cell at 50°C. This is why you should have temperature compensation on charge control if your batteries are outside and/or subject to wide temperature variations.
Li-ion Battery Model :
Using MATLAB Simulink, 10 cell series lithium ion battery model is created by following blocks.
Important blocks and parameters:
- Battery (Table-Based):
The Battery (Table-Based) block represents a high-fidelity battery model. The block calculates no-load voltage as a function of charge level and optional temperature using lookup tables and includes several modelling options:
- Self-discharge
- Battery fade
- Charge dynamics
- Calendar aging
Library: Simscape / Electrical / Sources
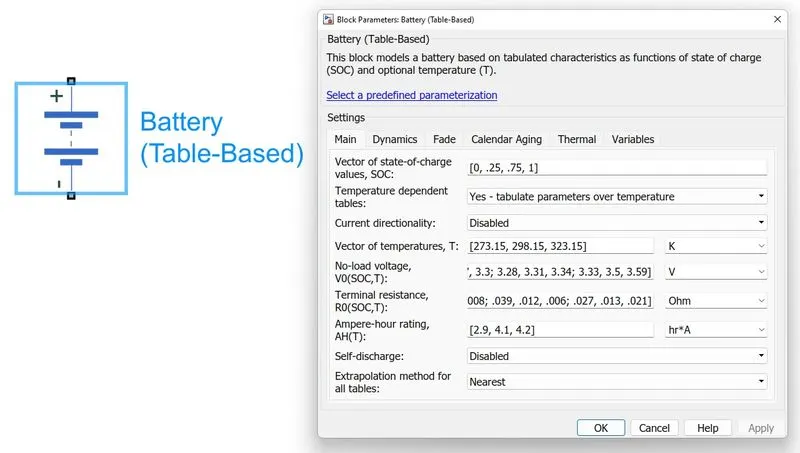
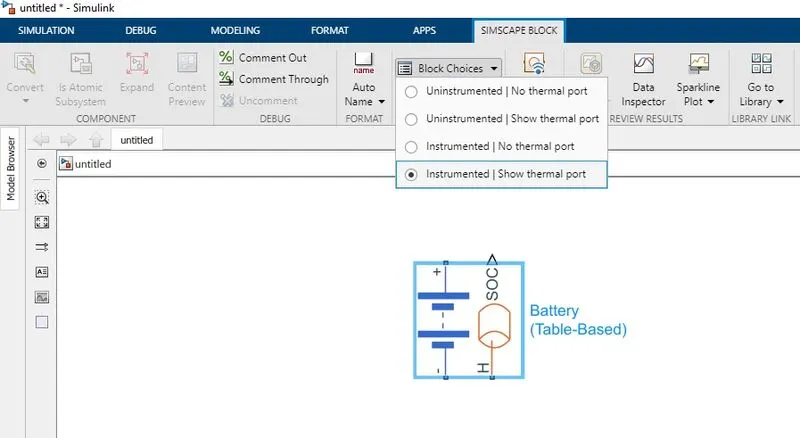
Change parameters from SIMSCAPE BLOCK tab for battery block as shown in below fig:
2. PS-Simulink Converter:
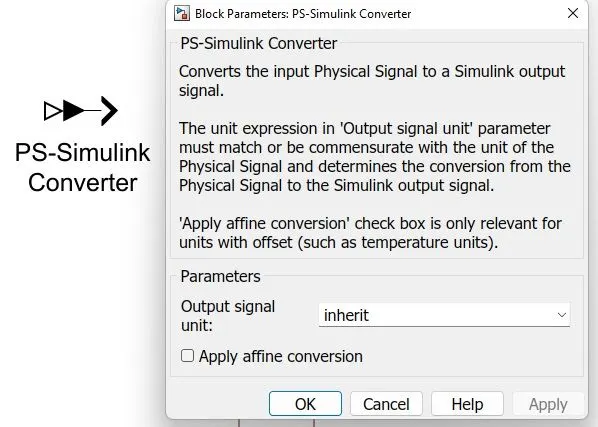
The PS-Simulink Converter block converts a physical signal into a Simulink® output signal. Use this block to connect outputs of a Physical Network diagram to Simulink scopes or other Simulink blocks.
To convey signal conversion while taking up minimal canvas space, the block icon changes dynamically based on whether it is connected to other blocks.
3. Signal Builder:
Create and generate interchangeable groups of signals whose waveforms are piecewise linear.
Library: Simulink / Sources
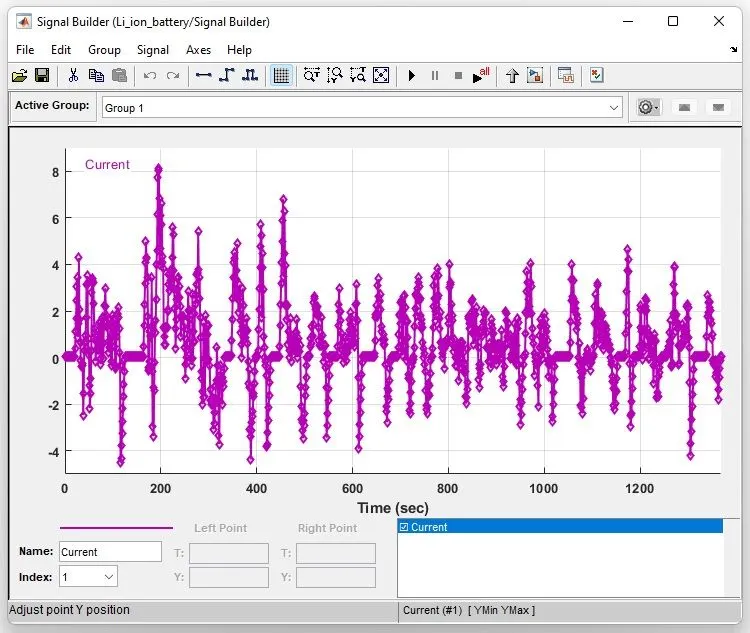
We need to change signal to current signal as per UDDS drive cycle signal.
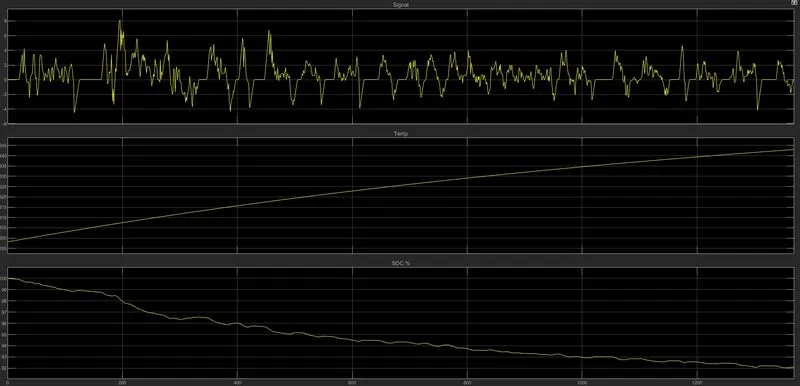
After changing values as per UDDS drive cycle, signal builder graph will look as follows
4. Temperature Senser :
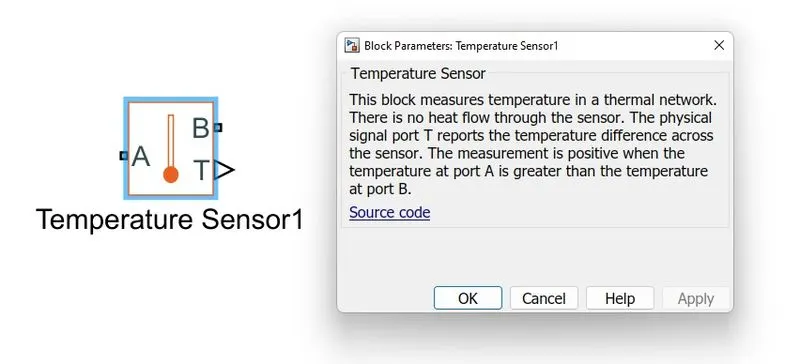
The Temperature Sensor block represents an ideal temperature sensor, that is, a device that determines the temperature differential measured between two points without drawing any heat.
Connections A and B are thermal conserving ports that connect to the two points where temperature is being monitored. Port T is a physical signal port that outputs the temperature differential value.
The block positive direction is from port A to port B. The measured temperature is determined as
T = T(A) – T(B).
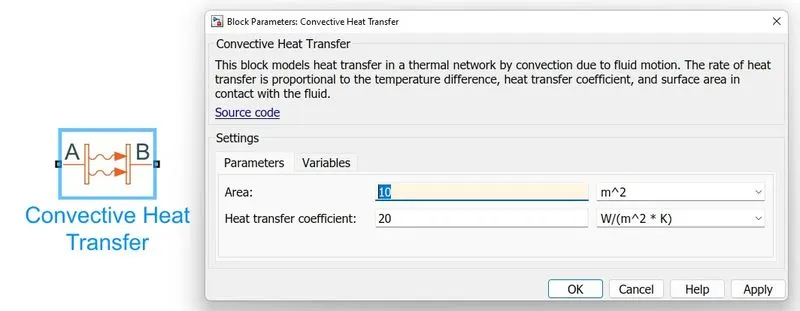
 5. Convective heat transfer:
The Convective heat transfer block represents a heat transfer by convection between 2 bodies by means of fluid motion. The transfer is governed by the Newton law of cooling and is described with the equation given below,
Q = k×A×(TA - TB)
where,
Q = Heat flow,
k = Convection heat transfer coefficient
A = Surface area
TA and TB are temperatures of the bodies.
The following image shows the Convective heat transfer block.
6. Conductive heat transfer :
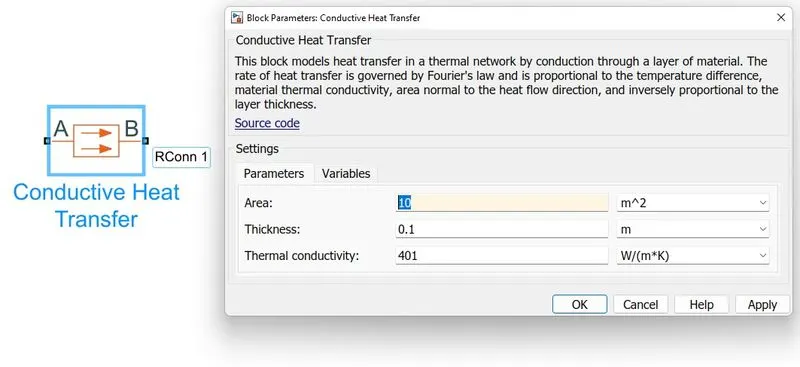
The Conductive heat transfer block represents a heat transfer by conduction between 2 layers of the same material. The transfer is governed by the Fourier law and is described with the equation given below,
Q=k·AD(TA−TB)
where, Q = Heat flow,
k = Material thermal conductivity,
A = Area normal to the heat flow direction,
D = Distance between layers
TA, TB are temperatures of the layers.
The following image shows the conductive heat transfer block
7. Display:
Display signal value during simulation
Library: Simulink / Dashboard
8. Scope:
Display signals generated during simulation
Library: Simulink / Commonly Used Blocks
9. GoTo :
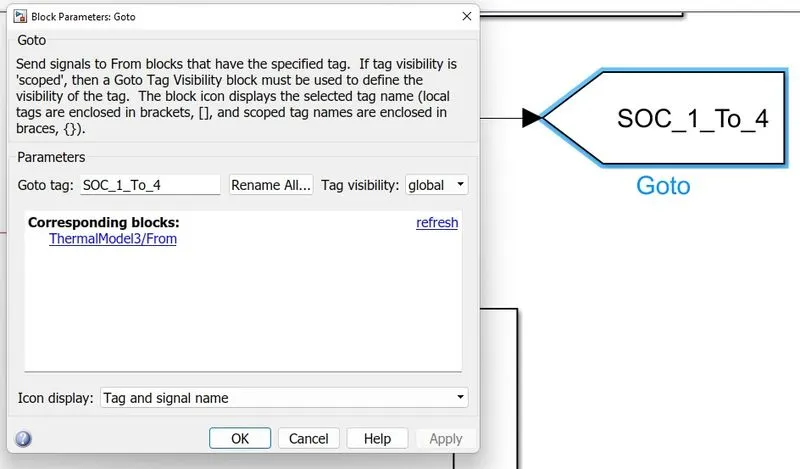
The Goto block passes its input to its corresponding From blocks. The input can be a real- or complex-valued signal or vector of any data type. From and Goto blocks allow you to pass a signal from one block to another without actually connecting them.
A Goto block can pass its input signal to more than one From block, although a From block can receive a signal from only one Goto block. The input to that Goto block is passed to the From blocks associated with it as though the blocks were physically connected.
For example, this model uses a Goto block and a From block.
10. From:
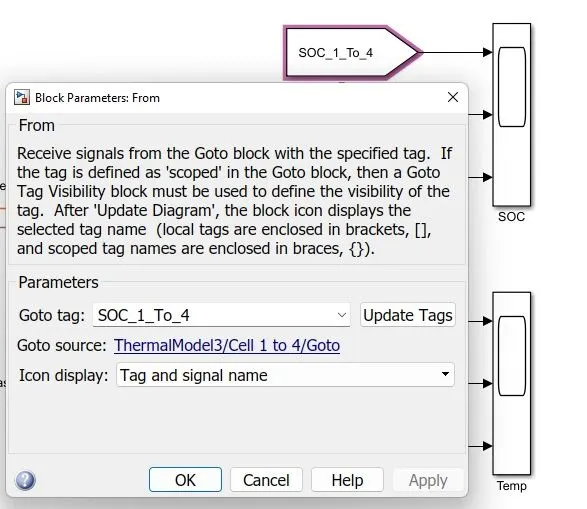
The From block accepts a signal from a corresponding Goto block, then passes it as output. The data type of the output is the same as that of the input from the Goto block. From and Goto blocks allow you to pass a signal from one block to another without actually connecting them.
Battery Model :
First, we create model with all 10 cells in series and try to run model for different temperatures by putting different values at temperature source parameter.
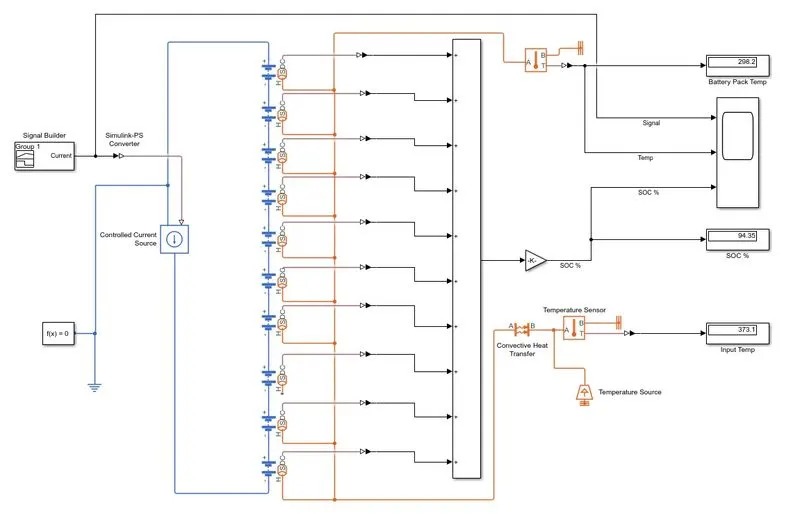
Result :
1] At room temp 25 °C i.e. 298.15 k
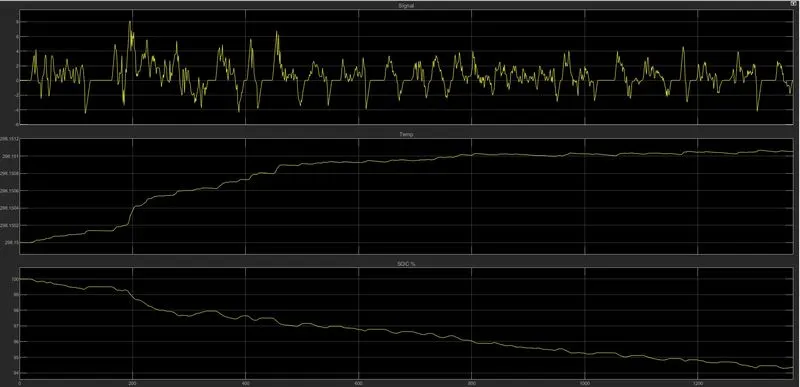
We can see Output reading in display of model as follows
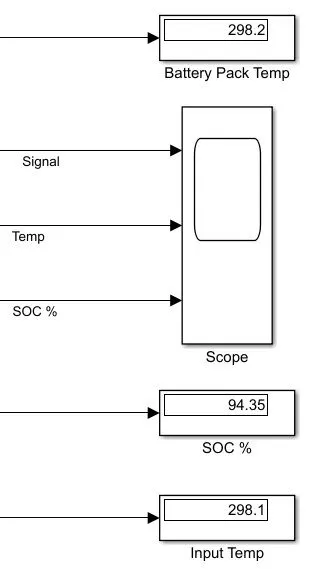
For input temp 298.15 k we get SOC% drop from 100 to 94.35 and temperature of battery pack slightly increased to 298.2k
2] At temp 50 °C i.e. 323.15 k
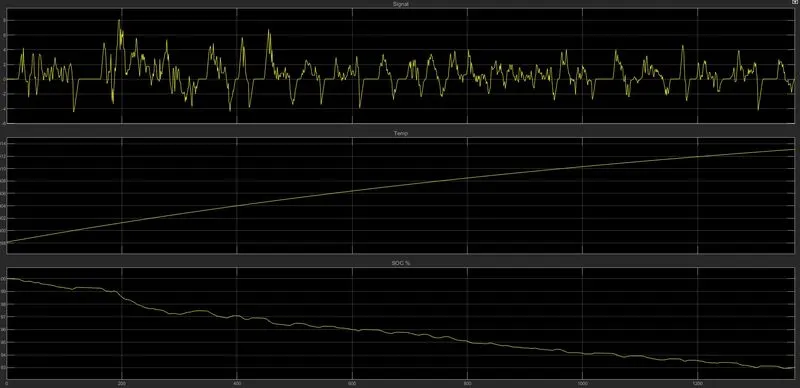
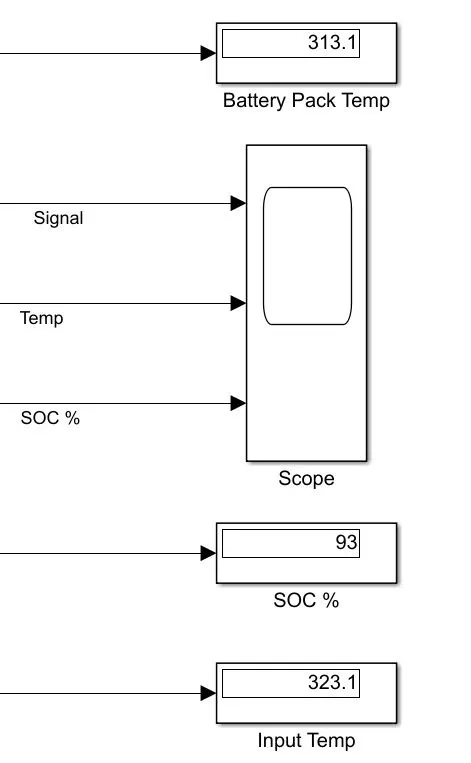
For input temp 323.15 k we get SOC% drop from 100 to 93 and temperature of battery pack reduced to 313.15k
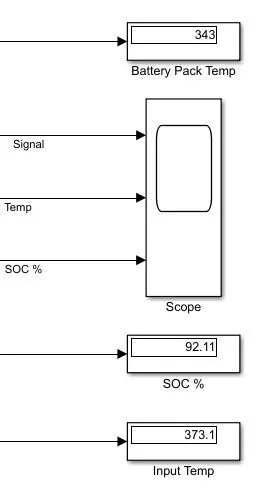
3] At high temp 100 °C i.e. 373.15 k
For input temp 373.15 k we get SOC% drop from 100 to 92.11 and temperature of battery pack reduced to 343k
Battery Model to check if cell is faulty :
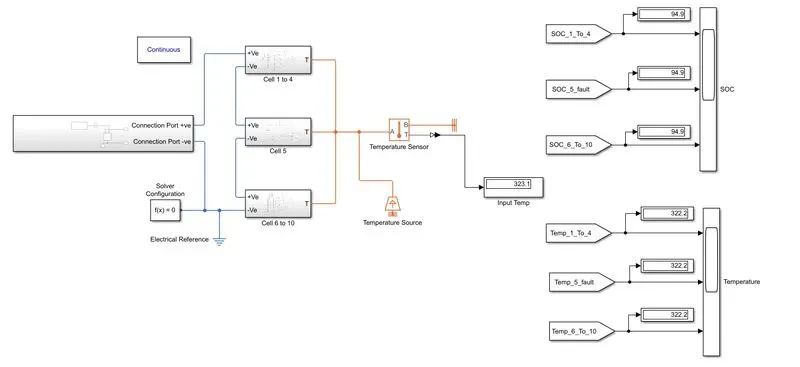
This model of 10 cell connections divided into 3 subsystems. Subsystem 1 consist of 4 cell (Cell 1 to 4) which are connected in series with Subsystem 2 consist of 1 cell (Cell 5) and these connected to subsystem 3 consist of 5 cell (Cell 6 to 10) all are connected in series.
The concept over here out of 10 cell one is given different input values as compare to other to see the difference in temperature curve .
we can also add the resistance block if need .
Signal builder provides the current input with respective to time and control current block use to control the flow of current.
We will be running the simulation for 1369 sec because of the available input data.
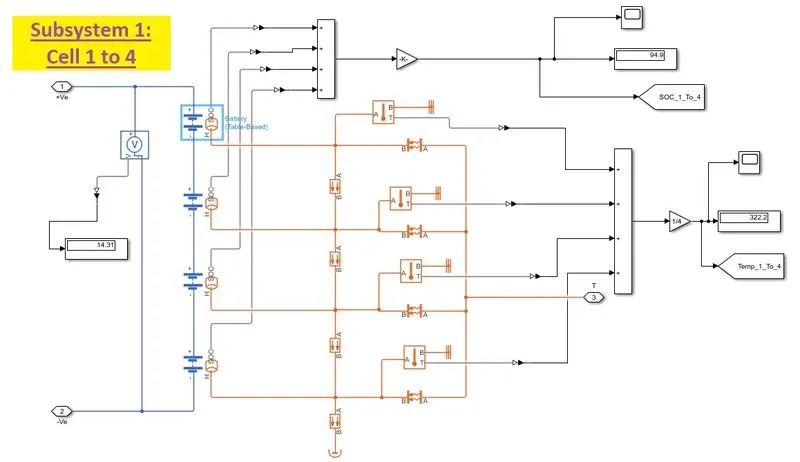
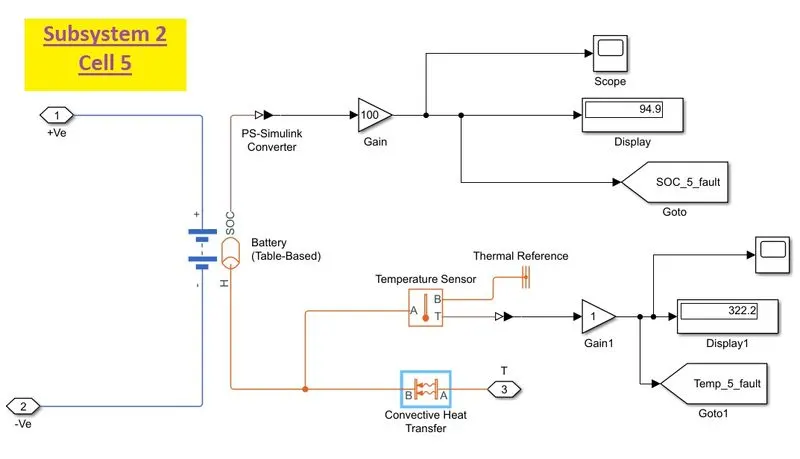
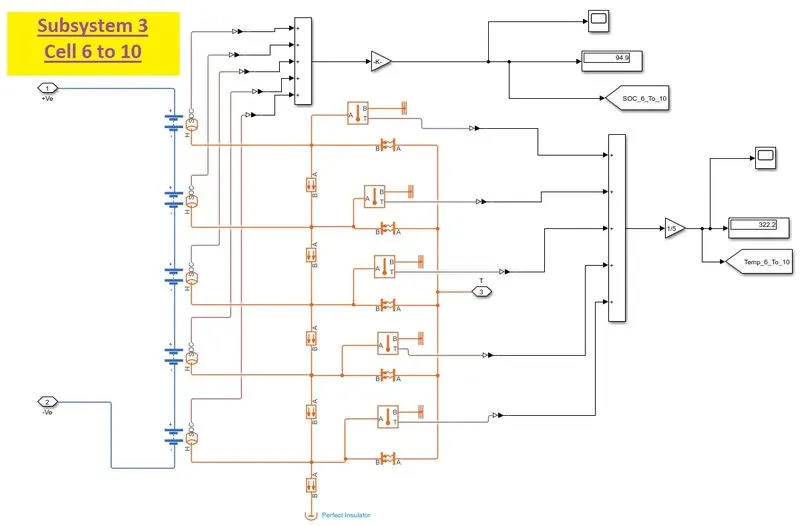
Case A: At room temp 25 °C i.e. 298.15 k and default parameters for all cells :
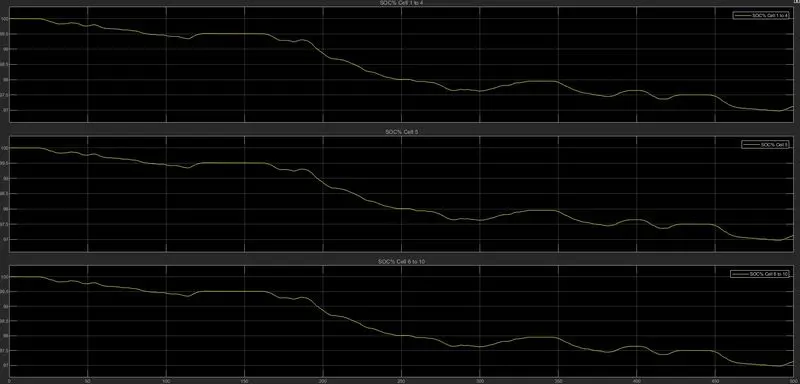
Readings in Output display :
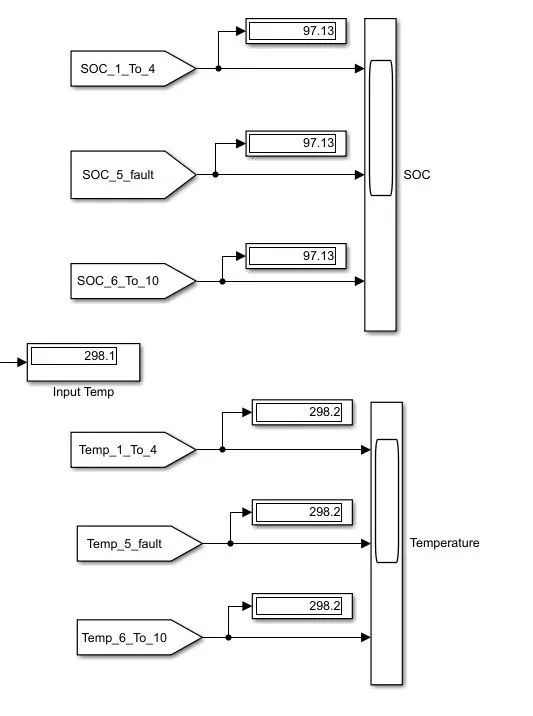
Here we can see that results for all subsystems remain same.
Case B: Change cell 5 parameters :
We add resistor of 5ohm parallel to cell 5
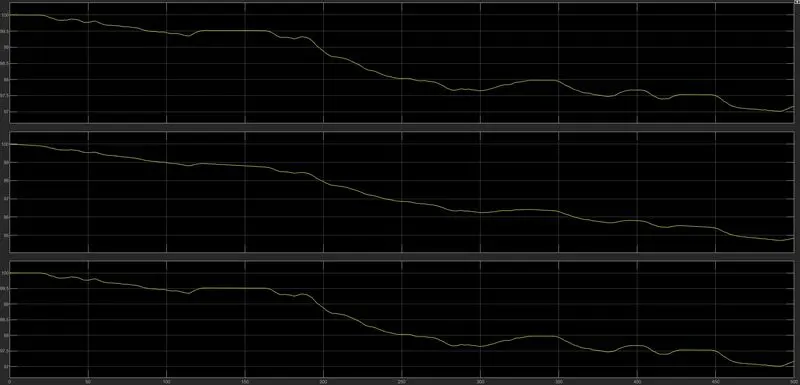
We can see the difference in SOC of Cell 5 due to adding resistor but temperature output remain same for all cells
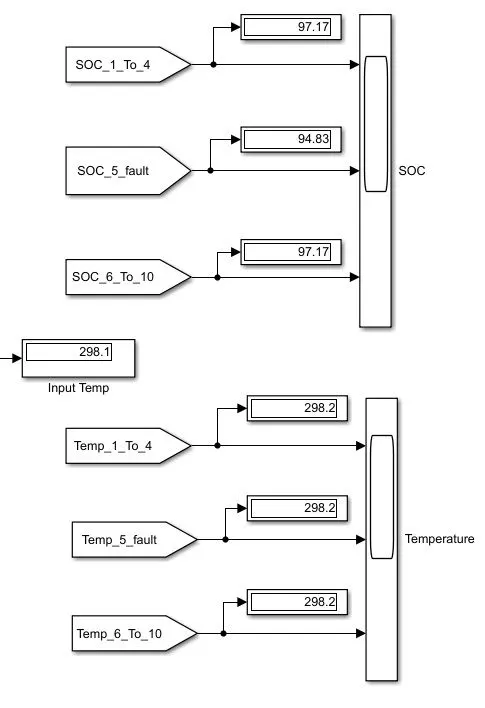
Case C: Change internal temp of cell 5 :
Graph of SOC% for all 3 subsystem
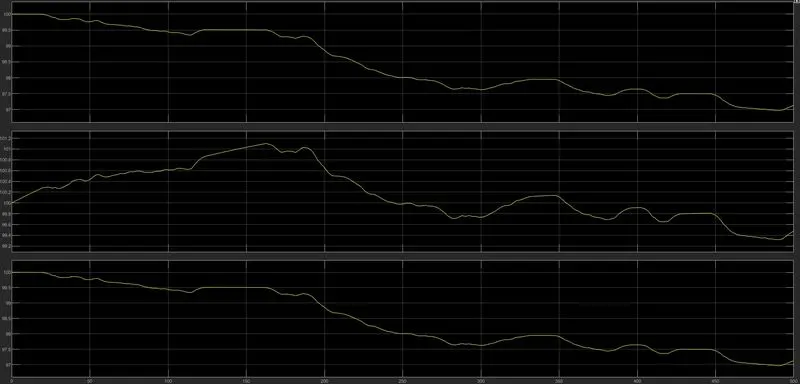
Graph of Temperature for all 3 subsystem
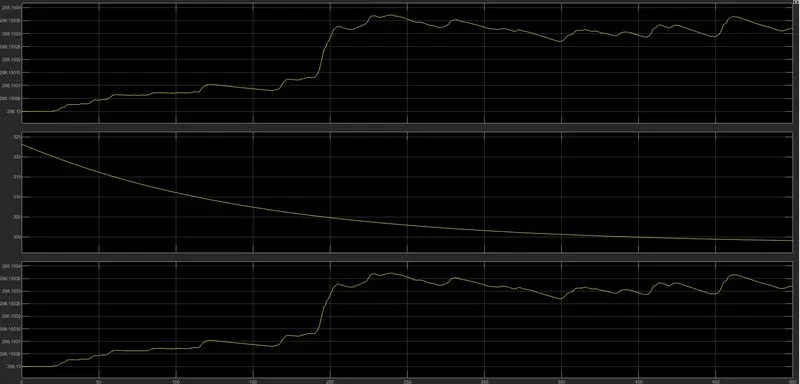
We can see in that both SOC% and temperature of faulty cell changes compares to other 2 subsystems if internal temperature increase of faulty cell.
Conclusion :
The thermal modelling of a 10 cell series arrangement has been perform at different temperature level for charging and discharging condition and we can conclude that if temperature increases SOC of battery pack decrease.
This simulation helps us to avoid the risk of battery pack's high temperature effects and made us to observe the Temperature behaviour of batteries at different Extreme usage conditions.
The alternate way is by employing proper cooling system to the battery packs while using it on any kind of application to prevent the High battery temperature effects.
Thus the Thermal Modelling of battery pack, evidently shows its Significance, that while developing any battery packs this process of simulation ensures the Safe operation and avoids Thermal Runaway to a great extent.
References :
- https://www.greentechrenewables.com/article/how-does-temperature-affect-battery-performance
- https://www.acc-emotion.com/stories/battery-cell-module-or-pack-whats-difference-infographics
- https://www.sciencedirect.com/science/article/abs/pii/S0360544221005855