Project 2 - Rankine cycle Simulator
Rankine cycle Simulator
Question :
Understand the concept of Rankine cycle by referring to standard thermal engineering text book.
- Create a Rankine Cycle Simulator using OCTAVE/MATLAB.
- Your code should calculate the state points of the Rankine Cycle (any type of your choice) based on user inputs.
- Then, plot the corresponding T-s and h-s plots for the given set of inputs. Title and axes labels are a must, while legends could be used if necessary.
- The presentation of your code will be taken into consideration while grading. Labelling sections of your code using comments is appreciated.
- Attach a report explaining the working of a rankine cycle simulator and also the research done by you.
Aim :
Write a code in MATLAB to Create a Rankine Cycle Simulator.
Objective :
- Calculate the state points of the Rankine Cycle based on user inputs.
- Plot the corresponding T-s and h-s plots for the given set of inputs.
Body of the content:
Rankine Cycle:
The Rankine cycle or Rankine Vapor Cycle is the process widely used by power plants such as coal-fired power plants or nuclear reactors. In this mechanism, a fuel is used to produce heat within a boiler, converting water into steam which then expands through a turbine producing useful work.
This is a thermodynamic cycle which converts heat into mechanical energy—which usually gets transformed into electricity by electrical generation.
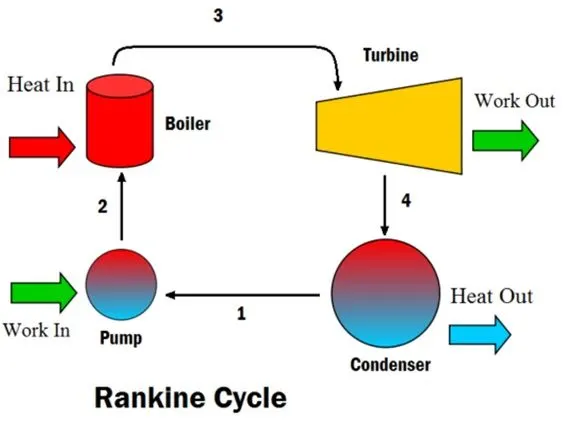
Pump: Compression of the fluid to high pressure using a pump (this takes work) (Figure 2: Steps 3 to 4)
Boiler: The compressed fluid is heated to the final temperature (which is at boiling point), therefore, a phase change occurs—from liquid to vapor. (Figure 2: Steps 4 to 1)
Turbine: Expansion of the vapor in the turbine. (Figure 2: Steps 1 to 2)
Condenser: Condensation of the vapor in the condenser (where the waste heat goes to the final heat sink (the atmosphere or a large body of water (ex. lake or river). (Figure 2: Steps 2 to 3)
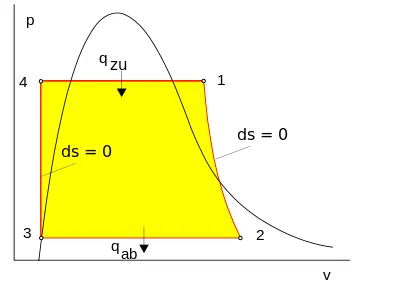
Fig: 2 Steps in Rankine Cycle
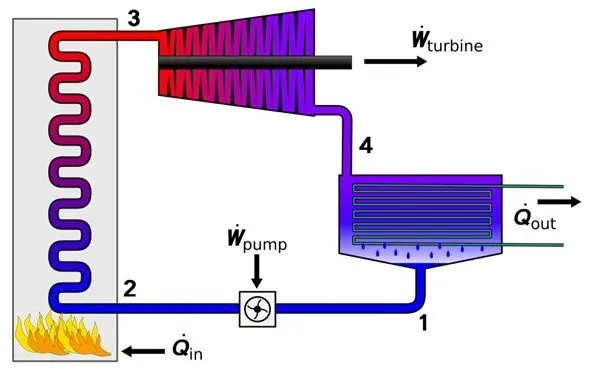
The processes in the Rankine cycle :
There are four processes in the Rankine cycle. The states are identified by numbers (in brown) in the T–s diagram.
- Process 1–2: The working fluid is pumped from low to high pressure. As the fluid is a liquid at this stage, the pump requires little input energy. Process 1-2 is isentropic compression.
- Process 2–3: The high-pressure liquid enters a boiler, where it is heated at constant pressure by an external heat source to become a dry saturated vapour. Process 2-3 is constant pressure heat addition in boiler.
- Process 3–4: The dry saturated vapour expands through a turbine, generating power. This decreases the temperature and pressure of the vapour, and some condensation may occur. The output in this process can be easily calculated using the chart or tables noted above. Process 3-4 is isentropic expansion.
- Process 4–1: The wet vapour then enters a condenser, where it is condensed at a constant pressure to become a saturated liquid. Process 4-1 is constant pressure heat rejection in condenser.
In an ideal Rankine cycle the pump and turbine would be isentropic, i.e., the pump and turbine would generate no entropy and hence maximize the net work output.
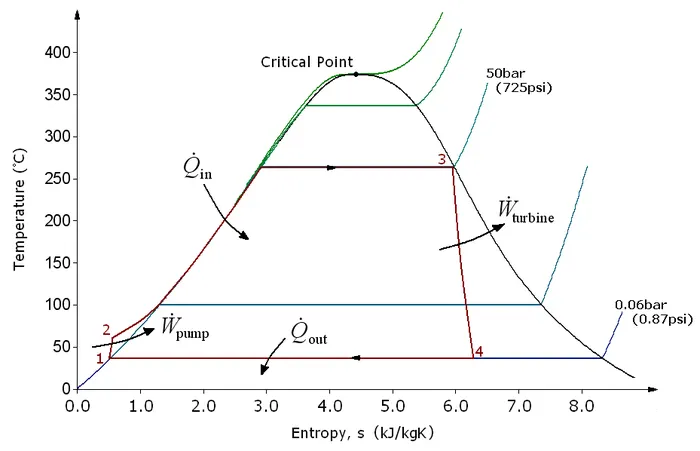
T-S Diagram of Rankine cycle
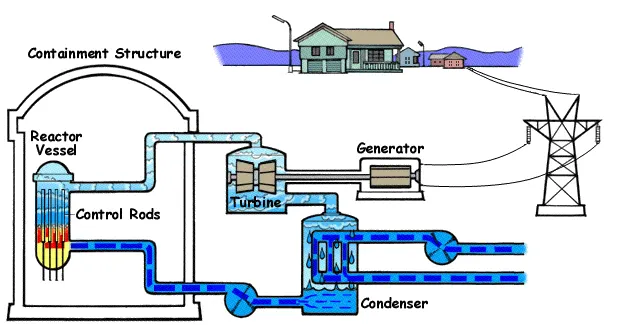
Fig: Rankine cycle in Boiling water reactor
Syntax used
# fprintf: To print the all process Description in Command Window we used Here 'fprintf' Command.
# Then we can get the Inputs like Pressure at Turbine inlet, Temperature at Turbine and Pressure at Condensor Inlet.
# XSteam: We calculated the State point values at various States like State-1,State-2, State-3 and State-4 from 'XSteam.m' File( Like Steam Table). we used XSteam Data to calculate Enthalpy, Entropy at various Temperature and Pressure. by using this we calculated Various State points in Rankine Cycle.
# The 'XSteam' data workes as h1=XSteam('h_pT',p1,T1); :- Enthalpy at pressure and Temperature 1.
# Then We calculated the Workedone by Turbine(Wt), Workedone by Pump (Wp),Net Work(Wnet), Heat in In System (Qin), Heat Out In System (Qut), Thermal Efficiency and S.S.C (Spescific Steam Consumption) by using Formulas.
# for loop: by using For Loop and 'plot' Command we are plotted the Saturation Curve for T-S diagram (Figure(1)) and H-S Diagram (Figure(2)).
# fprintf: By using 'fprintf' command and 'disp' command we are getting Results in Command Window.
By entering our Input Parameters Turbine Inlet temperature = 400° C, Turbine Inlet Pressure = 30 bars
Turbine Outlet Pressure = 0.05 bars = Condenser Inlet Pressure in Command Window We can get our Results.
Programming Language: MATLAB
clear
close
clc

% Process Description
disp('Rankine cycle')
disp('1-2 Isentropic Expansion in turbine')
disp('2-3 Constant Pressure heat rejection by condensor')
disp('3-4 Isentropic compression in pump')
disp('4-1 Constant Pressure heat absorbtion by boiler')

% Inputs
p1 = input('Enter the pressure at turbine inlet (in bar): ')
T1 = input('Enter the temperature at turbine inlet (in degree Celcius): ')
p2 = input('Enter the pressure at condensor inlet (in bar): ')

% State 1
h1 = XSteam('h_pT',p1,T1)
s1 = XSteam('s_pT',p1,T1)

% State 2
s2 = s1
sf2 = XSteam('sL_P',p2)
sg2 = XSteam('sV_p',p2)
x2 = (s2-sf2)/(sg2-sf2)
hf2 = XSteam('hL_p',p2)
hg2 = XSteam('hV_p',p2)
h2 = hf2+(x2*(hg2-hf2))

% State 3
p3 = p2
s3 = XSteam('sL_p',p3)
h3 = XSteam('hL_P',p3)

% State 4
s4 = s3
p4 = p1

% Workdone by Turbine
Wt = h1-h2

% Workdone to run pump
v3 = XSteam('vL_p',p3)
Wp = v3*(p4-p3)*100

h4 = h3+Wp

% Net Work-output
Wn = Wt-Wp

% Back Work ratio = Work Pump / Workdone by Turbine
Back_Work_Ratio = Wp/Wt


% Heat into system
Qin = h1-h4

% Heat out of the system
Qout = h2-h3

% Thermal Efficiency
eff_T = (Wn/Qin)*100

% Specific Steam Consumption = mass flow rate/power
SSC = 3600/Wn

% Calculating temp at state point
T3 = XSteam('Tsat_p',p3)
T2 = T3
Cp4 = XSteam('Cp_ps', p4, s4)
Cv4 = XSteam('Cv_ps', p4, s4)
k = Cp4/Cv4
T4 = T3/((p3/p4)^((k-1)/k))

% Calculate Entropy
s5 = XSteam('sL_p',p1)
s6 = XSteam('sV_p',p1)
% Calculate Temp
T6 = XSteam('Tsat_p',p1)
T5 = T6
% Calculate Enthalpy
h5 = XSteam('hL_p',p1)
h6 = XSteam('hV_p',p1)

% Plot Saturation Curve
T = linspace(1,375,1000);
for i = 1:length(T);
    sf(i) = XSteam('sL_T', T(i));
    sg(i) = XSteam('sV_T', T(i));
    hf(i) = XSteam('hL_T', T(i));
    hg(i) = XSteam('hV_T', T(i));
end

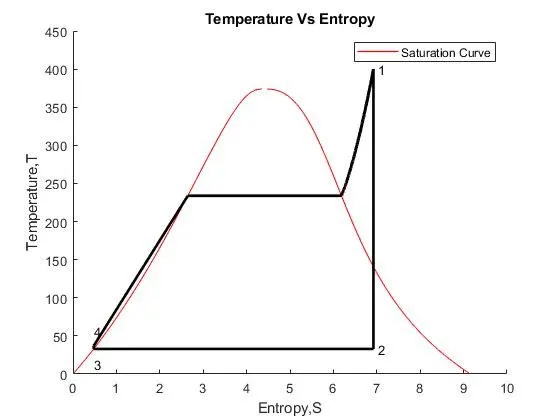
% Plot T-S Diagram
figure(1)
hold on
plot(sf, T, 'r','linewidth',1)
plot(sg, T, 'r','linewidth',1)
plot([s1 s2],[T1 T2],'k','linewidth',2)
plot([s2 s3],[T2 T3],'k','linewidth',2)
plot([s3 s4],[T3 T4],'k','linewidth',2)
plot([s4 s5],[T4 T5],'k','linewidth',2)
plot([s5 s6],[T5 T6],'k','linewidth',2)

sc1 = linspace(s6,s1,1000);

for i = 1:length(sc1)
    Tc1(i) = XSteam('T_ps',p1,sc1(i));
end

plot(sc1,Tc1,'k','linewidth',2)
text(s1+0.1,T1,'1')
text(s2+0.1,T2,'2')
text(s3,T3-20,'3')
text(s4,T4+20,'4')
title('Temperature Vs Entropy')
xlabel('Entropy,S')
ylabel('Temperature,T')
legend('Saturation Curve')

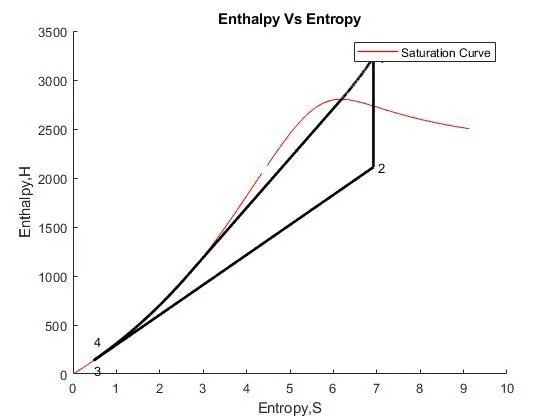
% Plotting H-S Diagram
figure(2)
hold on
plot(sf, hf, 'r','linewidth',1)
plot(sg, hg, 'r','linewidth',1)
plot([s1 s2],[h1 h2],'k','linewidth',2)
plot([s2 s3],[h2 h3],'k','linewidth',2)
plot([s3 s4],[h3 h4],'k','linewidth',2)

hc = linspace(h4,h5,100);

for i = 1:length(hc)
    sch(i) = XSteam('s_ph',p1,hc(i));
end

plot(sch,hc,'k','linewidth',2)
plot([s5 s6],[h5 h6],'k','linewidth',2)
for i = 1:length(sc1)
    hc1(i) = XSteam('h_ps',p1,sc1(i));
end

plot(sc1,hc1,'k','linewidth',2)
text(s1+0.1,h1,'1')
text(s2+0.1,h2,'2')
text(s3,h3-100,'3')
text(s4,h4+200,'4')
title('Enthalpy Vs Entropy')
xlabel('Entropy,S')
ylabel('Enthalpy,H')
legend('Saturation Curve')

% Displaying Result
disp('Results')
fprintf(('At state point 1\n'));
fprintf('p1: %8.3f bar \n', p1);
fprintf('T1: %8.3f Degree Celcious \n', T1);
fprintf('h1: %8.3f kj/kg \n', h1);
fprintf('s1: %8.3f kj/kg \n', s1);

fprintf(('At state point 2\n'));
fprintf('p2: %8.3f bar \n', p2);
fprintf('T2: %8.3f Degree Celcious \n', T2);
fprintf('h2: %8.3f kj/kg \n', h2);
fprintf('s2: %8.3f kj/kg \n', s2);

fprintf(('At state point 3\n'));
fprintf('p3: %8.3f bar \n', p3);
fprintf('T3: %8.3f Degree Celcious \n', T3);
fprintf('h3: %8.3f kj/kg \n', h3);
fprintf('s3: %8.3f kj/kg \n', s3);

fprintf(('At state point 4\n'));
fprintf('p4: %8.3f bar \n', p4);
fprintf('T4: %8.3f Degree Celcious \n', T4);
fprintf('h4: %8.3f kj/kg \n', h4);
fprintf('s4: %8.3f kj/kg \n', s4);

fprintf('Turbine Work: %8.3f kj/kg \n', Wt);
fprintf('Pump Work: %8.3f kj/kg \n', Wp);
fprintf('Net Work: %8.3f kj/kg \n', Wn);
fprintf('Efficiency: %8.3f in percentage \n', eff_T);
fprintf('Specific Steam Con: %8.3f kj/kg \n', SSC);
fprintf('Back Work Ratio: %8.3f \n', Back_Work_Ratio);
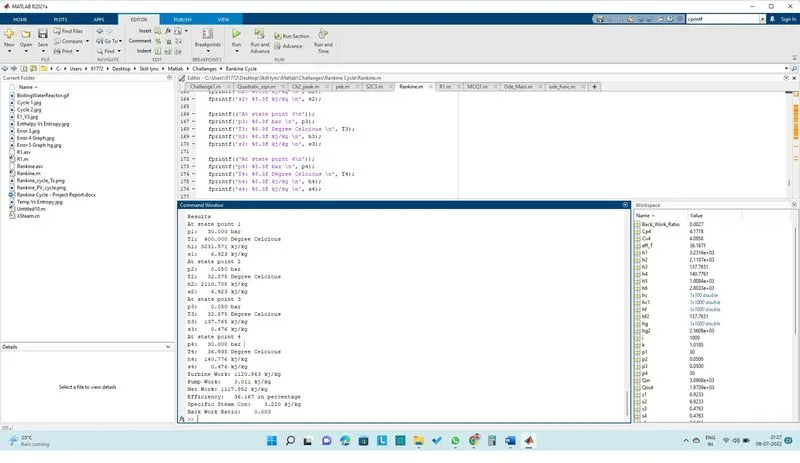
Command Window Output (As Text)
At state point 1
p1: 30.000 bar
T1: 400.000 Degree Celcious
h1: 3231.571 kj/kg
s1: 6.923 kj/kg
At state point 2
p2: 0.050 bar
T2: 32.875 Degree Celcious
h2: 2110.708 kj/kg
s2: 6.923 kj/kg
At state point 3
p3: 0.050 bar
T3: 32.875 Degree Celcious
h3: 137.765 kj/kg
s3: 0.476 kj/kg
At state point 4
p4: 30.000 bar
T4: 36.935 Degree Celcious
h4: 140.776 kj/kg
s4: 0.476 kj/kg
Turbine Work: 1120.863 kj/kg
Pump Work: 3.011 kj/kg
Net Work: 1117.852 kj/kg
Efficiency: 36.167 in percentage
Specific Steam Con: 3.220 kj/kg
Back Work Ratio: 0.003
Screenshots of Command window:
Graph of Temperature vs Entropy
Graph of Enthalpy vs Entropy
Screenshots of Errors
Error 1:
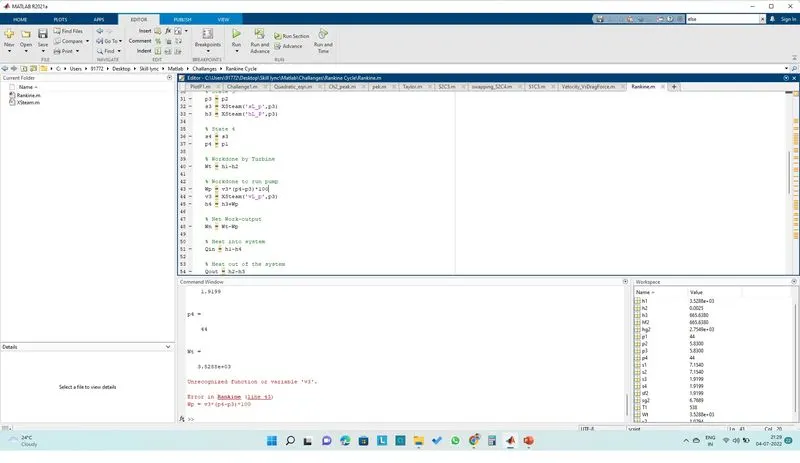
Error: Invalid sequence of variable
Corrected as: Bring variable v3 before Wp
Error 2:
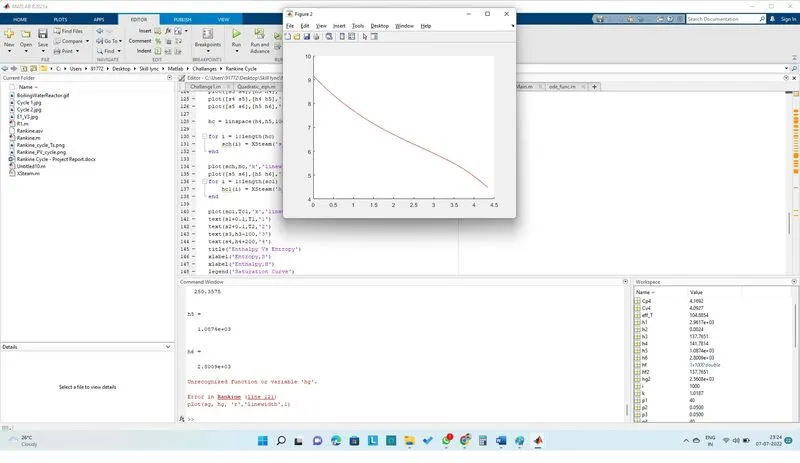
Error: Unrecognized function
Corrected as: hg was defined wrongly.
Corrected as: hg(i) = XSteam('hV_T', T(i));
Error 3
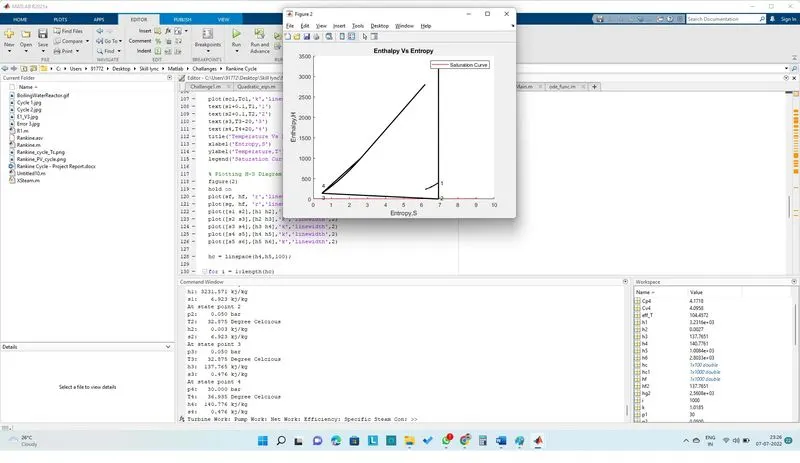
Error: Invalid Graph. Point 2 is not defined properly
Corrected as: text(s2+0.1,T2,'2')
Conclusion:
We can create Rankine cycle simulator and successfully calculate state points of cycle based on inputs. We can plot the corresponding T-s and h-s plots for the given set of inputs.
References:
- https://byjusexamprep.com/rankine-cycle-i
- https://www.thermopedia.com/content/1072/
- https://energyeducation.ca/encyclopedia/Rankine_cycle#:~:text=The%20Rankine%20cycle%20or%20Rankine,a%20turbine%20producing%20useful%20work.
- https://www.techtarget.com/whatis/definition/Rankine-cycle
- https://en.wikipedia.org/wiki/Rankine_cycle
- http://www.ecourses.ou.edu/cgi-bin/ebook.cgi?topic=th&chap_sec=10.1&page=theory