Project 1 - Parsing NASA thermodynamic data
File Parsing
Aim :
Write a code in MATLAB to extract data from given Nasa Thermodynamic data file using file parsing.
Objective :
- Write a function that extracts the 14 co-efficients and calculates the enthalpy, entropy and specific heats for all the species in the data file.
- Calculate the molecular weight of each species and display it in the command window.
- Plot the Cp, Enthalpy and Entropy for the local temperature range (low temperature : high temperature) specific for each species.
- The main program that will just take the "THERMO.dat" file as an input and generate Cp, H and S plots.
Body of the content:
What is File Parsing?
Parsing a file means reading in a data stream and building a memory model of the content of that data. This aims at facilitating performing some kind of transformation on the data. Parsing splits a file or other input into pieces of data that can be easily stored or manipulated.
Steps :
Download the given .data file and save it in same directory as that of MATLAB coding file.
# Open .data file in MATLAB using fopen command followed by ‘r’ for reading file. The output must be a positive number. fopen(‘file_name’,’r’)
# After going through file we can see that 1st line is header information, 2nd line is global temperature, 3rd ,4th and 5th lines are comments which we should ignore.
# Using function fgetl() we can read file line by line.
# Now we have to split global temperature values because the line read by fgetl() are in string format and we need them in number format.
# We can split them using strsplit(). Global values are converted into number format by using str2num().
# Define temperature range and Universal gas constant R=8.314
# Now we can see in data file there are 3 lines which contains 14 coefficients. Line 1 contain 5 (a1 to a5) coefficients Line 2 contains 5 (a6 to a10) and line 3 contains 4(a11 to a14).
Define these coefficients line by line.
# The FIRST 7 coefficients are HIGH-temperature coefficients and the SECOND 7 coefficients are LOW-temperature coefficients.
Using for loop define temperature range and using if-else statement allots coefficients according to temperature.
# Using given formulas find values of Cp, H & S
# Using mkdir(‘folder name’) command make new folder directory followed by cd(‘folder name’) to change current folder.
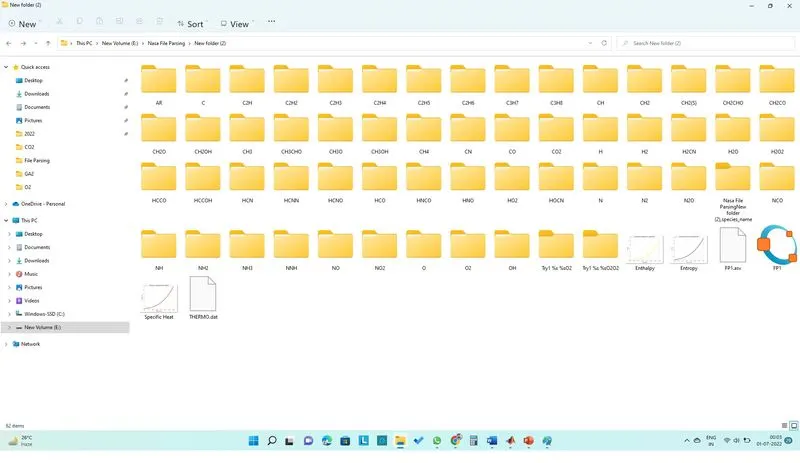
# Plot graph for temperature vs Cp, temperature vs H and temperature vs S with proper labelling and save for each species in respective folder.
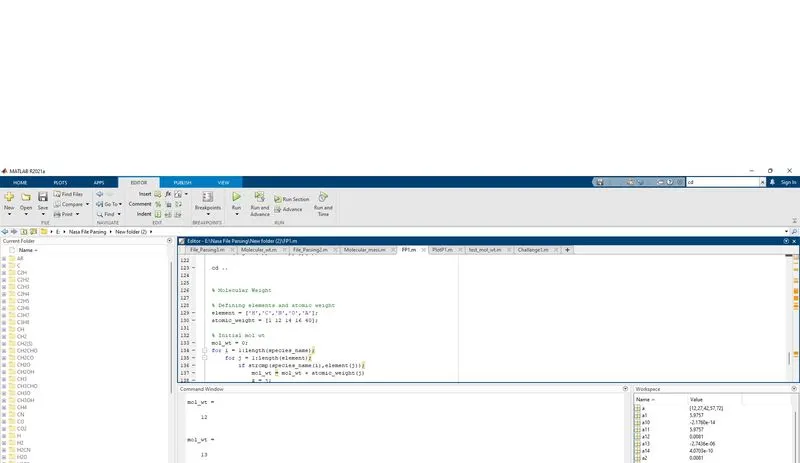
# We know atomic weights of present elements, using that calculate molecular weight for each species and display it in command window.
Programming Language: MATLAB
clear all
close all
clc

% Open given .data file and read
f1 = fopen('THERMO.dat','r');

 fgetl(f1);
 % Getting temperature data
  templ = fgetl(f1)
 % Splitting temperature data
 t = strsplit(templ,' ')

 % Skipping next lines
for i=1:3
    fgetl(f1)
end
% Total species = 53
for i = 1:53

% Spliting next line
Line1 = fgetl(f1);
L1 = strsplit(Line1,' ');
% Defining Species name
species_name = L1{1}

% Extracting temp range for species
Low_temp = str2num(L1{end-3});

High_temp = str2num(L1{end-2});

temp = linspace(Low_temp, High_temp, 500);
% Universal Gas Constant
R = 8.314;

% Coefficient line 1
tline = fgetl(f1);
C1 = strsplit(tline,' ');

a = findstr(tline,'E');

    a1 = str2num(tline(1:a(1)+3));
    a2 = str2num(tline(a(1)+4:a(2)+3));
    a3 = str2num(tline(a(2)+4:a(3)+3));
    a4 = str2num(tline(a(3)+4:a(4)+3));
    a5 = str2num(tline(a(4)+4:a(5)+3));

    % Coefficient line 2
tline2 = fgetl(f1);
C2 = strsplit(tline2,' ');
 b = findstr(tline,'E');
    a6 = str2num(tline(1:b(1)+3));
    a7 = str2num(tline(b(1)+4:b(2)+3));
    a8 = str2num(tline(b(2)+4:b(3)+3));
    a9 = str2num(tline(b(3)+4:b(4)+3));
    a10 = str2num(tline(b(4)+4:b(5)+3));

    % Coefficient line 3
tline3 = fgetl(f1);
C3 = strsplit(tline3,' ');
c = findstr(tline,'E');


    a11 = str2num(tline(1:c(1)+3));
    a12 = str2num(tline(c(1)+4:c(2)+3));
    a13 = str2num(tline(c(2)+4:c(3)+3));
    a14 = str2num(tline(c(3)+4:c(4)+3));

    % Defining temperature
   for n = 1:length(temp);

       % Allocating first 7 coeff to high temp and next 7 to low temp

       if temp(n)> 1000
       Cp = ((a1 + a2*temp + a3*(temp).^2 + a4*(temp).^3 + a5*(temp).^4)*R);
        H = ((a1 + (a2*temp)./2 + (a3*(temp).^2)./3 + (a4*(temp).^3)./4 + (a5*(temp).^4)./5 + (a6)./temp).*(temp).*R);
        S = ((((a1*log(temp)) + (a2*(temp)) + (a3*(temp).^2)/2) + ((a4*(temp).^3)/3) + ((a5*(temp).^4)/4) + a7)*R);

       else
           Cp = ((a8 + a9*temp + a10*temp.^2 + a11*temp.^3 + a12*temp.^4)*R);
        H = (a8 + (a9*temp)./2 + (a10*temp.^2)./3 + (a11*temp.^3)./4 + (a12*temp.^4)./5 + (a13)./temp).*(temp.*R);
        S = (((a8*log(temp)) + (a9*(temp)) + (a10*(temp.^2)/2) + (a11*(temp.^3)/3) + (a12*(temp.^4)./4) + a14)*R);
       end
   end

  % Directory for save folder

  mkdir(species_name)
  cd(species_name)
    % Temperature vs specific heat Cp %
 figure(1)
 plot(temp,Cp,'linewidth',3,'color','r')
 title(sprintf('Temperature Vs Specific Heat for %s %s',species_name));
 xlabel('Temperature');
 ylabel('Specific Heat');
 grid on


% Temperature vs Enthalpy %
 figure(2)
 plot(temp,H,'linewidth',3,'color','y')
 title(sprintf('Temperature Vs Enthalpy for %s %s',species_name'));
 xlabel('Temperature');
 ylabel('Enthalpy');
 grid on


 % Temperature vs Entropy %
 figure(3)
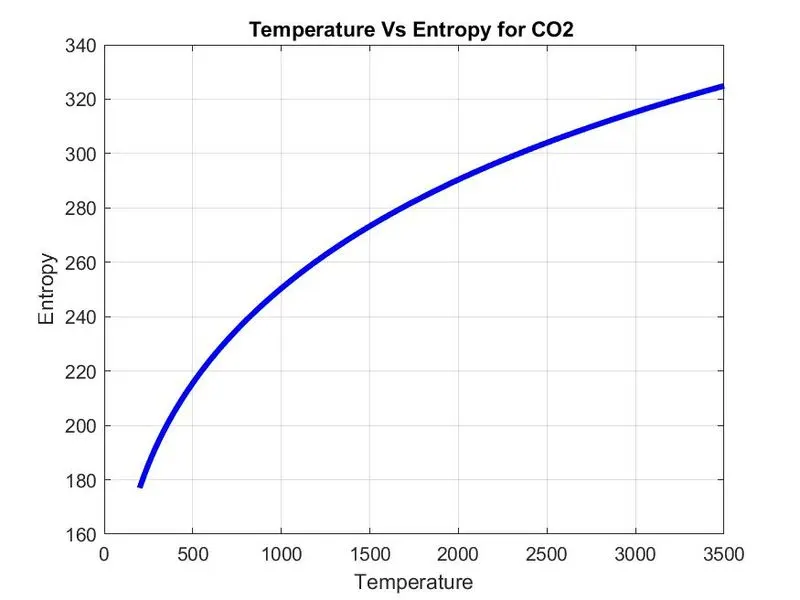
 plot(temp,S,'linewidth',3,'color','b')
 title(sprintf('Temperature Vs Entropy for %s %s',species_name'));
 xlabel('Temperature');
 ylabel('Entropy');
 grid on


 %Saving Graphs
 saveas(figure(1),'Specific Heat.jpg');
 saveas(figure(2),'Enthalpy.jpg');
 saveas(figure(3),'Entropy.jpg');

 cd ..


 % Molecular Weight

 % Defining elements and atomic weight
 element = ['H','C','N','O','A'];
 atomic_weight = [1 12 14 16 40];

 % Initial mol wt
 mol_wt = 0;
 for i = 1:length(species_name);
     for j = 1:length(element);
         if strcmp(species_name(i),element(j));
             mol_wt = mol_wt + atomic_weight(j)
             z = j;
         end
     end
     n = str2num(species_name(i));
     if n> 1
         mol_wt = mol_wt + atomic_weight(z)*(n-1);
     end
 end

 fprintf('Molecular weight of species %s is %f',species_name,mol_wt)


end
Output
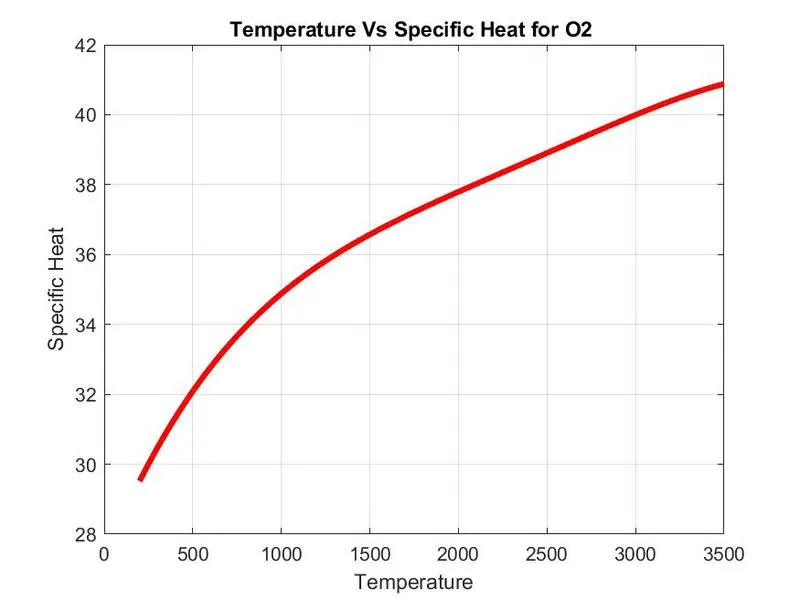
1)For O2 –
Specific Heat
Enthalpy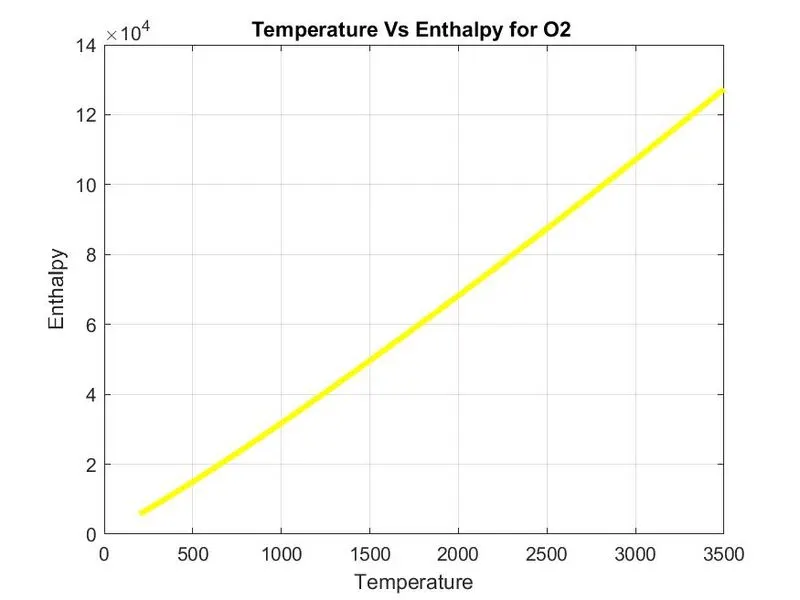
Entropy
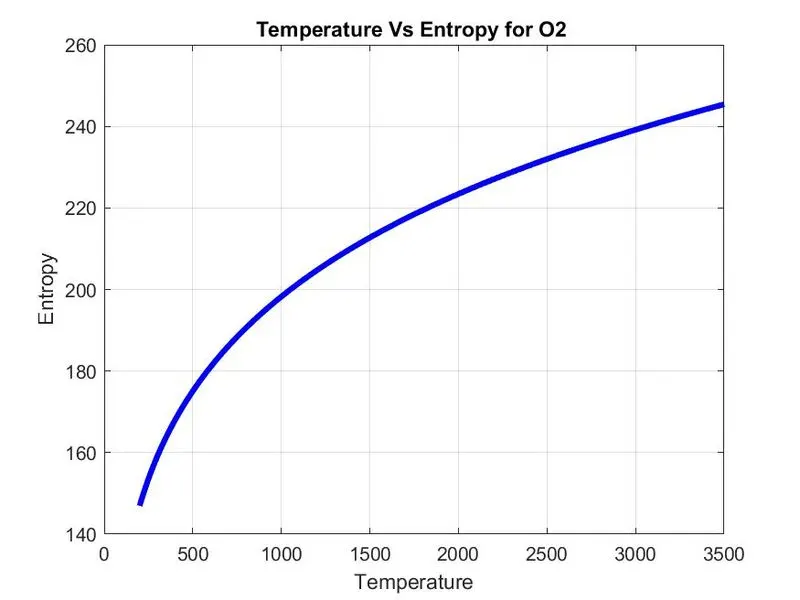
2)For N2 –
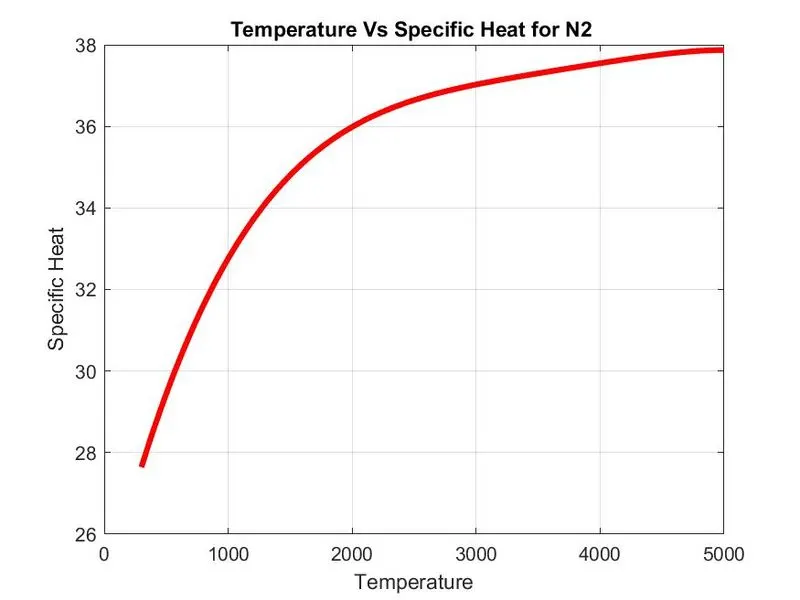
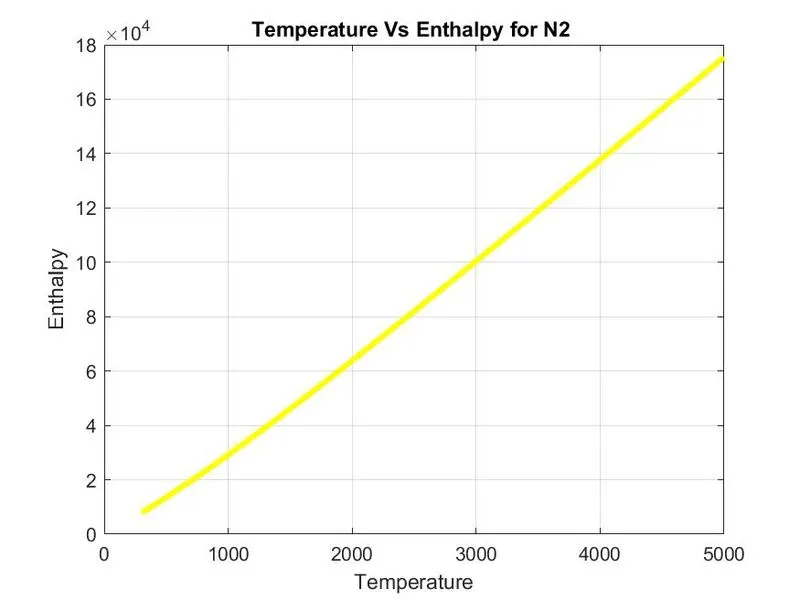
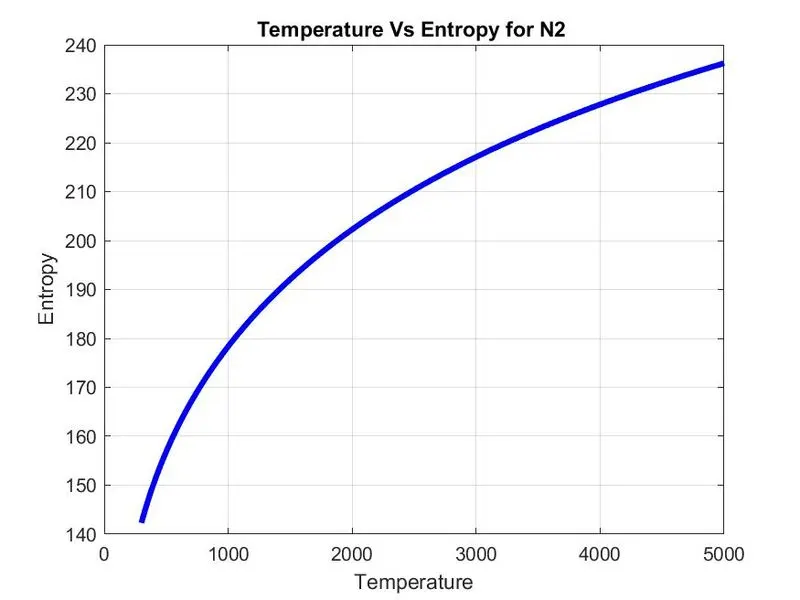
3)For Co2 –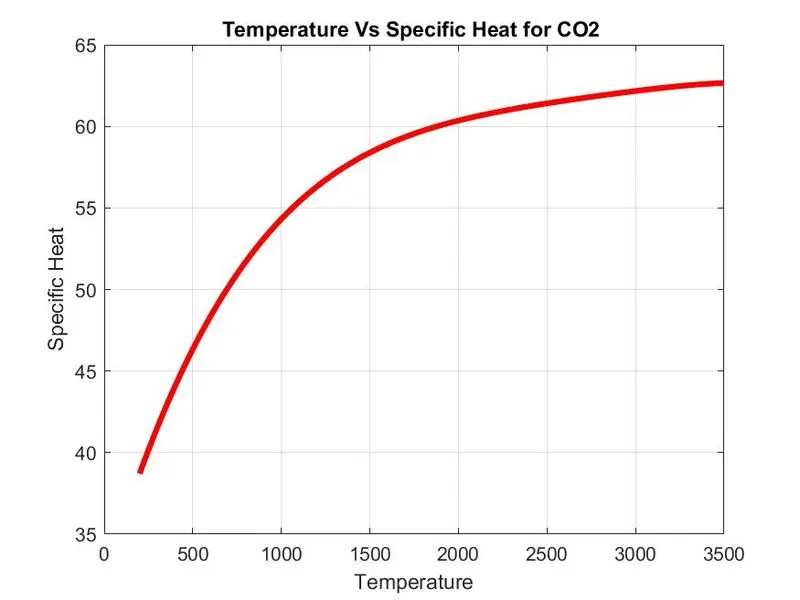
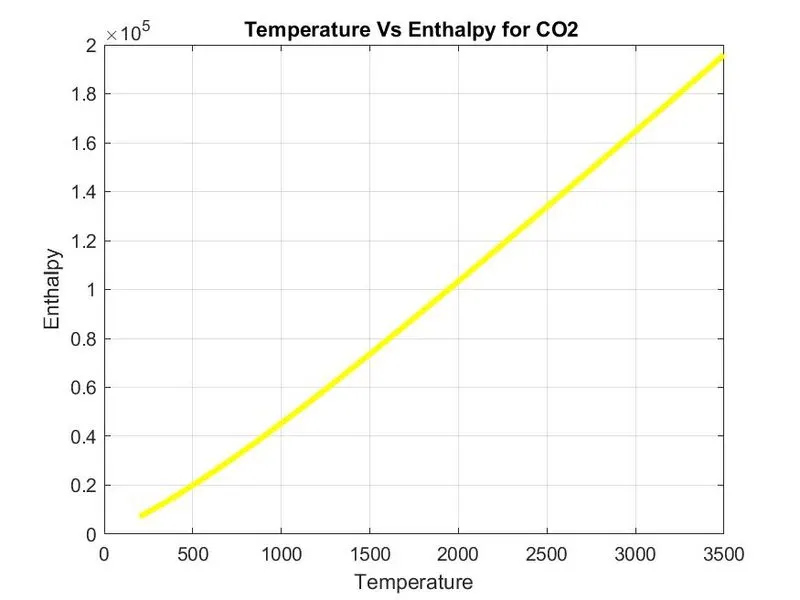
Screenshots of window: where all folders are saved
Screenshots of Molecular Weight
Screenshots of Errors
Error 1:
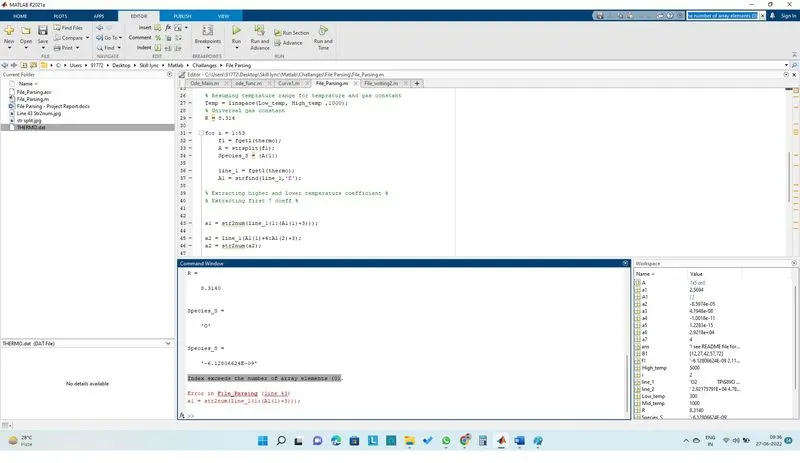
Typing Error: Invalid command
Corrected as: a1 = str2num(tline(1:a(1)+3));
Error 2:
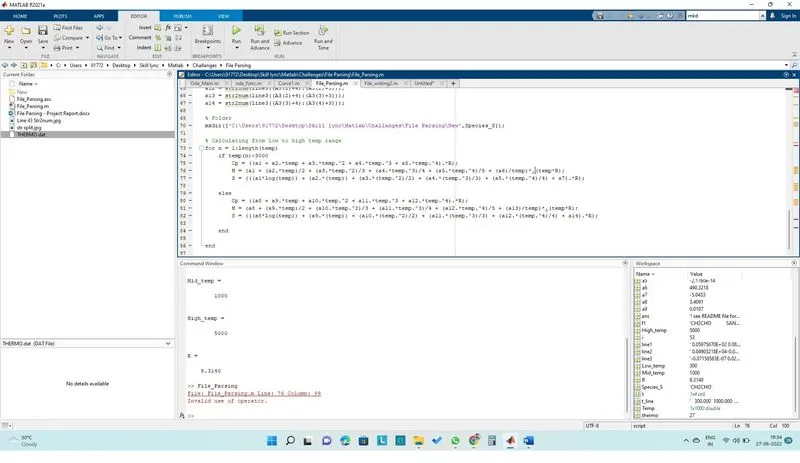
Typing Error: Invalid operator
Corrected as: Putting “.” Before “*”
Error 3
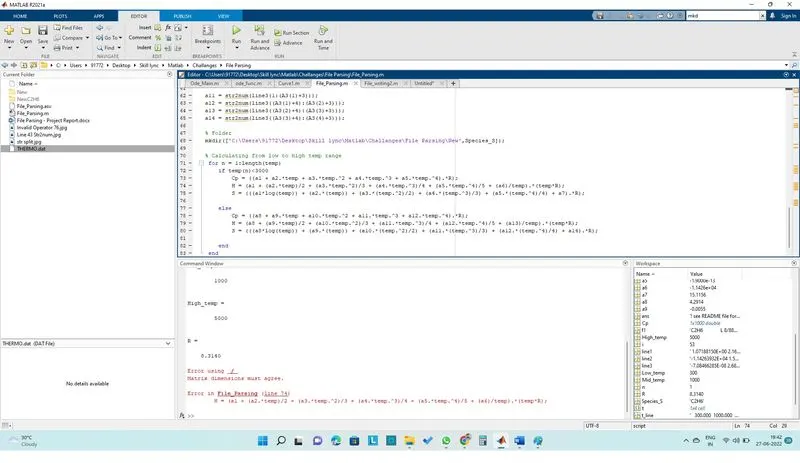
Typing Error: Invalid operator
Corrected as: Putting “.” Before “*”
References:
1. https://in.mathworks.com/help/matlab/matlab_prog/parse-function-inputs.html
2. https://web.cecs.pdx.edu/~gerry/MATLAB/plotting/loadingPlotData.html
3. https://community.aras.com/f/getting-started/6620/data-parsing-the-aras-innovator-using-matlab