Project 2 Thermal modeling of battery pack
Aim:
To simulate a 10 cell series lithium ion battery model
Objective:
- Create the simulink battery model for 10 series lithium-ion cell with thermal effects.
- Simulate this model at various temperature and compare age for equivalent full cycles.
- Simulate this model at various charge and discharge and compare age for equivalent full cycles.
Before we go to the project lets learn about Thermal Management
Theory:
Thermal Management:
Thermal management is the means of monitoring and controlling temperatures produced by devices in electrical enclosures. Control is possible through technologically advanced materials and components with known thermodynamic and heat transfer properties.
Temperature effect :
At low temperatures, the intercalation of lithium ions on the graphite electrode and the lithium plating proceed simultaneously. The activity of the positive electrode material (graphite electrode) decreases in low temperatures, so the number of lithium ions that can move and bring about the discharge current decreases, thereby reducing the battery capacity.
At low temperature the diffusion and movement of the charged ions of the positive and negative electrodes worsen. The transfer speed in the electrolyte reduces as well and deposits also form on the surface of the active material, which leads to an increase in battery resistance. On top of that, this process produces extra heat.
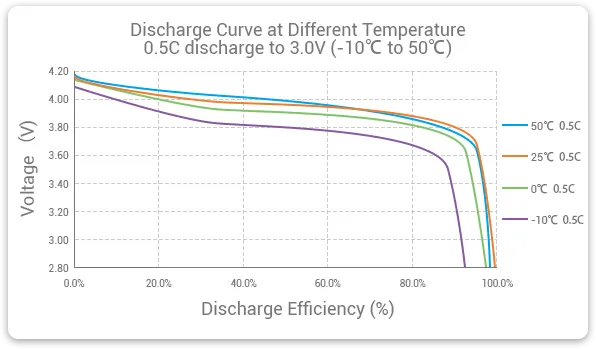
Ultimately, the performance of lithium batteries is severely degraded at low temperatures. At the same time, lithium ions undergo other reactions during battery charging and discharging. This is mainly an irreversible reaction between lithium ions and electrolytes. Long-term exposure to this environment will cause the capacity of lithium batteries to decline and can even cause permanent damage to the battery.
Life Cycle Of Battery:
This decreases the range and time needed between each journey to charge. Most manufacturers have a five to eight-year warranty on their battery. However, the current prediction is that an electric car battery will last from 10 – 20 years before they need to be replaced.
Most electric vehicle batteries have an estimated 1500 to 2000 charge cycles. The array of cells have to charge 100%, then discharge to 0% for a cycle to be complete. While 500 cycles may be practical in a phone, it is not so for a car that is expected to last well over ten years.
Simulink Model:
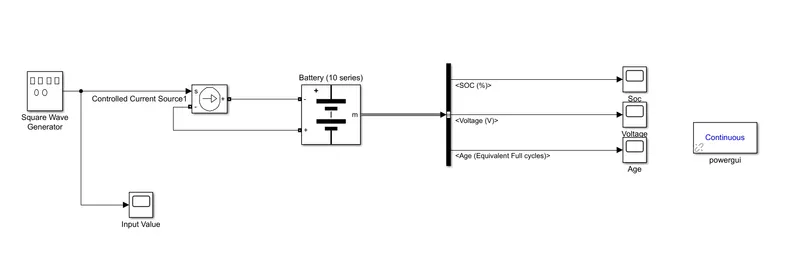
Block Model:
Explanation:
Battery (10 Series):
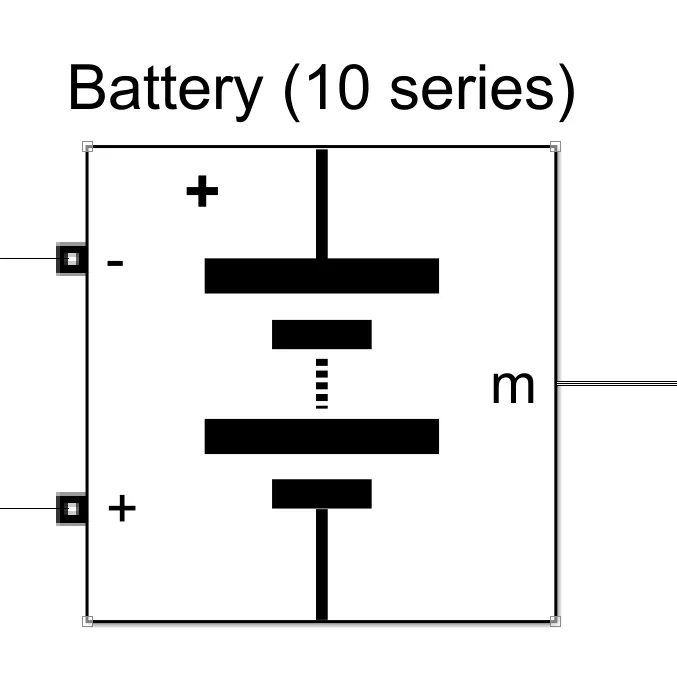
This battery model is found from the directory Electrical/specialized power system/Electric Drives /Extra source. It has two converting ports and one is positive battery terminal and another one is negative battery terminal. And has one output port as named as "m" it gives the multiple vector signal output port giving the SOC ,current, voltage signals, Age, cell temperature ect.
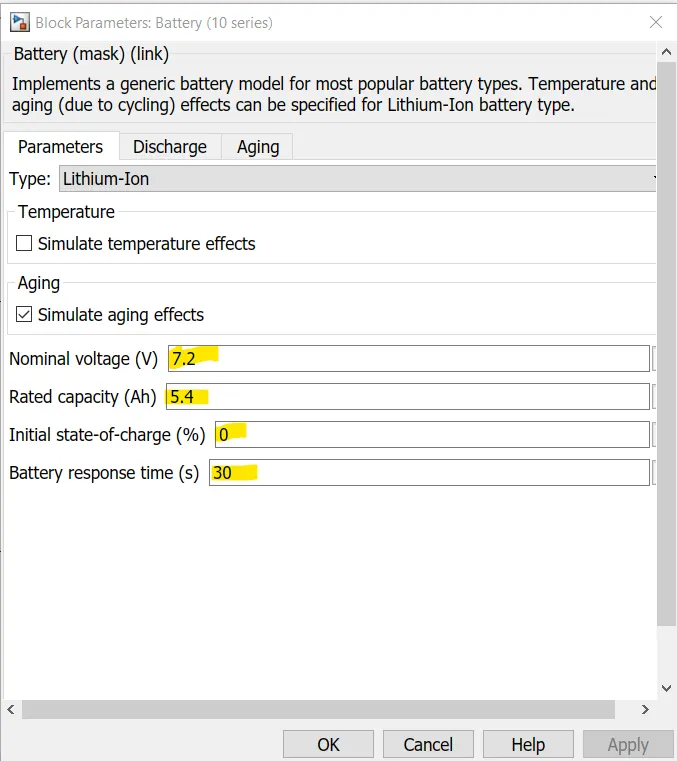
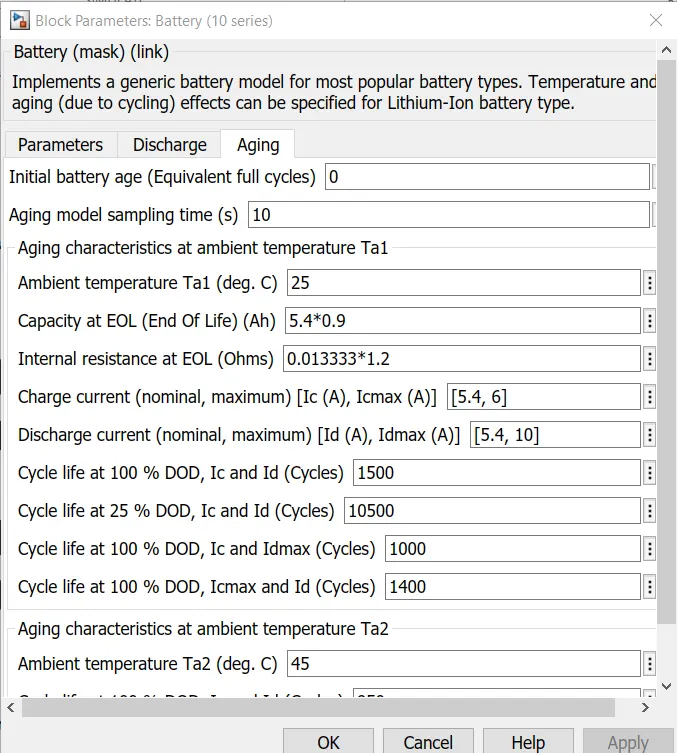
we need to configure the battery as the parameter of 10 series lithium ion battery for that we need to change some parameter in the box as shown in figure. For the 10 series battery the voltage the sigle cell voltage is add ten times for the series battery. for single cell voltage is 7.2 V. so, for the 10 series cell the voltage will be 72 V.
The values entered in the battery are been given is been shred through an image
For aging effect in the parameter box we need select the simulate aging effect. After that in that aging already all details are filled as default value from that we need to modify some parameters as shown in figure. Aging sample time is defaultly is very high. But for this simulation we reduce the sample time as 10 sec. And charge and dischage current is defaultly as 0.5C. but we change that to 1C by giving the full cuttert value of 5.4 as shown in below figure
Square Wave Generator:
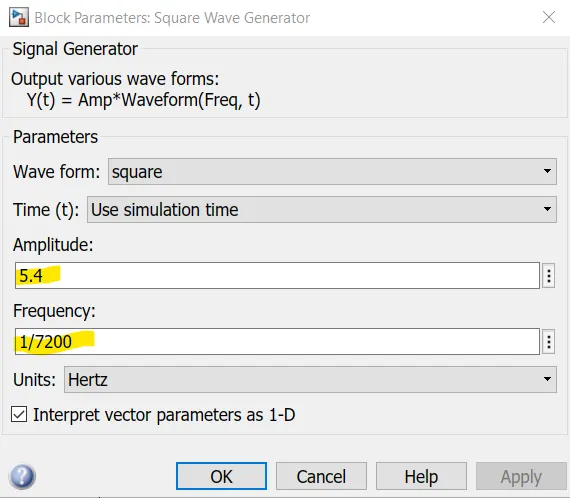
Square wave generator is used for generate the square waves by giving the amplitude and the frequency values in the parameter box.For our simulation we need the full charge and discharge the battery. so for charging at 1C rate which means 5.4 A current we need to charge for 60 min (or) 3600 sec .so we need to give amplitude of 5.4 and for the frequency we need to charge and discharge fully so the time taken is 7200 sec. so the Frequency we set as (1/7200) as shown in below figure.
Bus Selector:
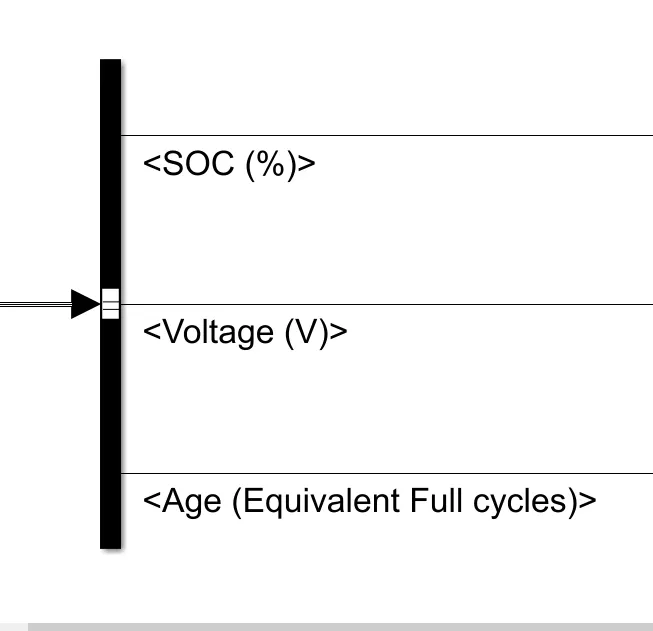
This block accepts a bus as input which can be created from a cell moudule, Bus selector or a block defines its output using a bus object. The left list box shows the signal in the input bus. Use the select button to select the output signals we need to show. The right list shows the selections. using up and down or remove button to reorder selections as shown in the following figure
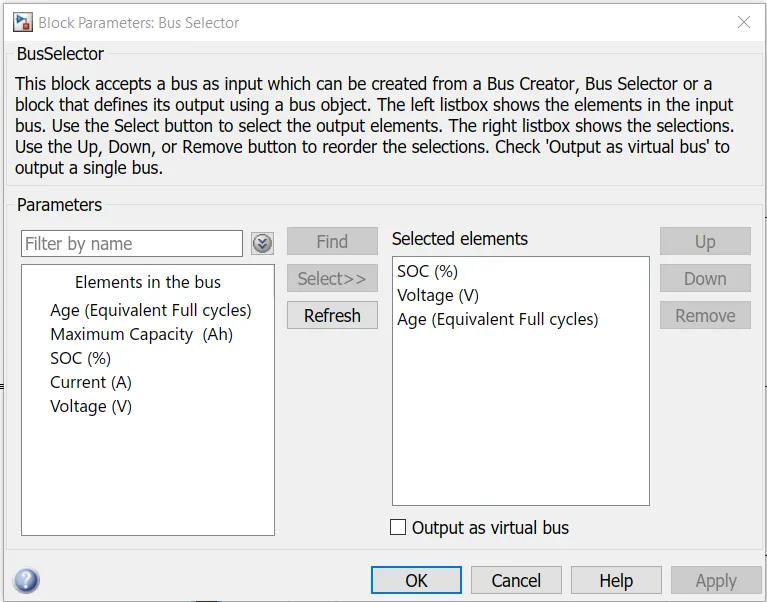
As we can see in the image that there are many variables but we have selected on SOC, Age and Voltage.
Controlled Current source :
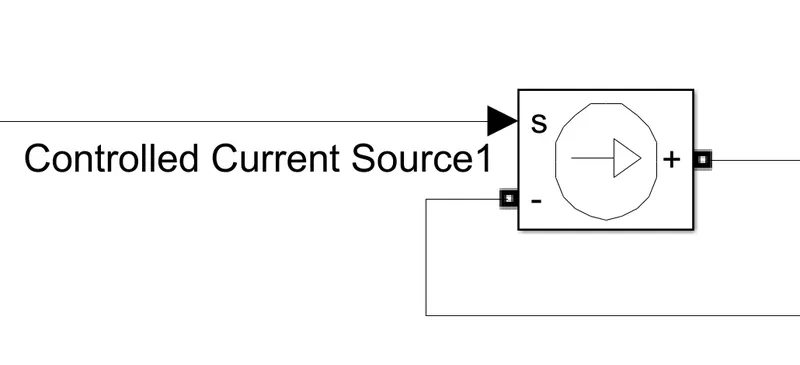
The controlled current source is used for giving the charge and discharge the bateery as the controlled source. by connect the battery postive and negative port in current source and the input is the current value given by the wave generator.
In this model the input singals are gerated by the wave generator for full charge and dicharge the battery. this current is given by the controlled current source to the Battery model. then the battery model output is connected to the bus selector and this selector output is given to scope to view the results.
Input signal:
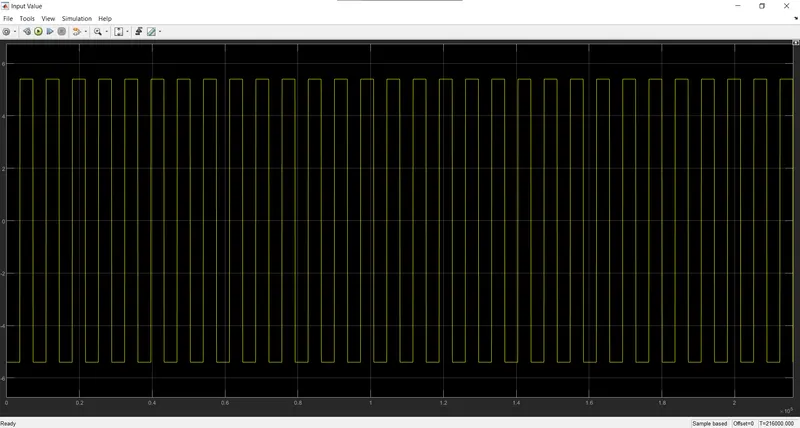
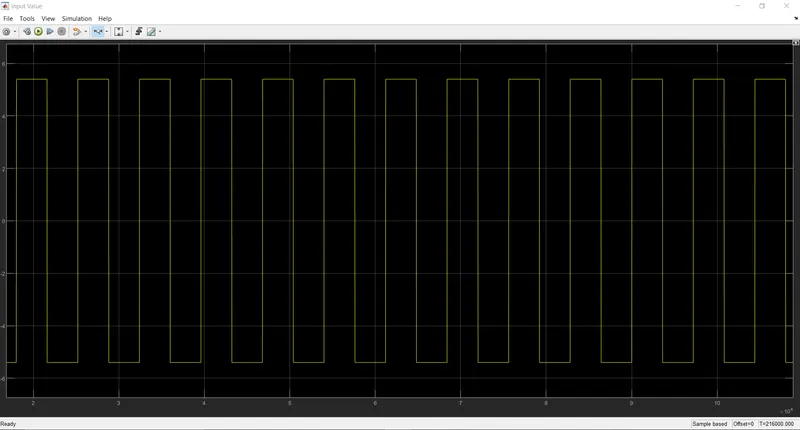
The simulation run time is around 3600*60 the zoomed image of the input value is shown below
Results:
The result images shared are been zoomed and captured.
SOC:
Voltage:
Age:
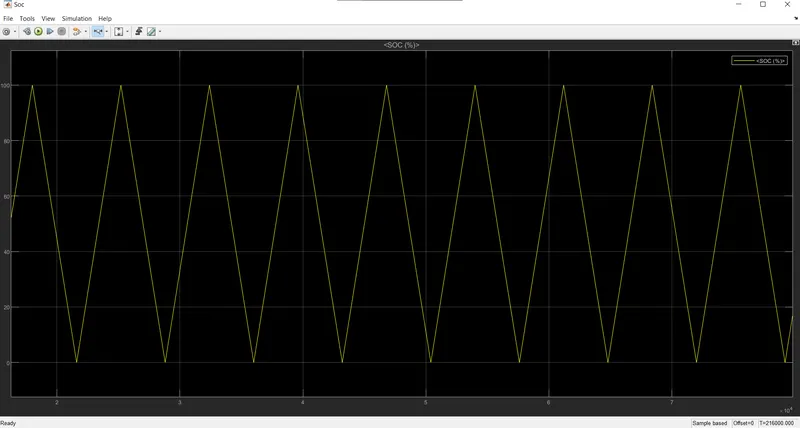
The first plot is shows the soc in % with the time trace value. from thet we see the starting the battery has no charge. And then the charging is happen upto the 100% charge and then the discharge is happen for 3600*60 sec to complete discharge. so the one cycle is one charge and the discharge of the battery. so here we simulate for 5 cycle of the lithium ion battery model.
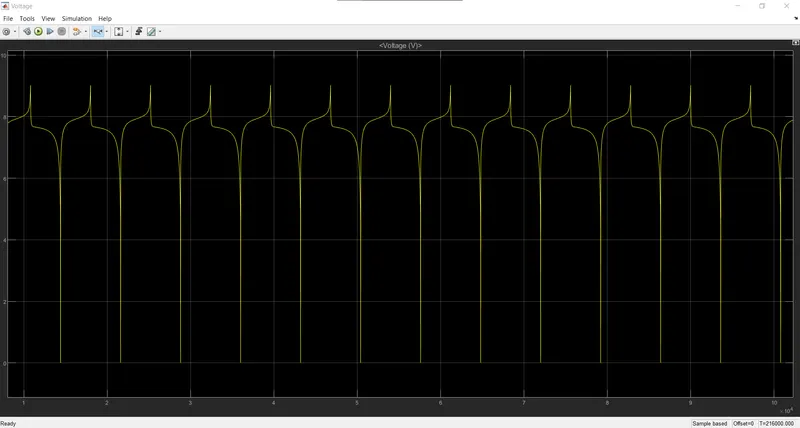
The Second plot is shows the voltage level of the battery with the time trace value. As we see while charging and discharging the voltage level is around 65V to 85V due to the nominal voltage of this battry is 70V.
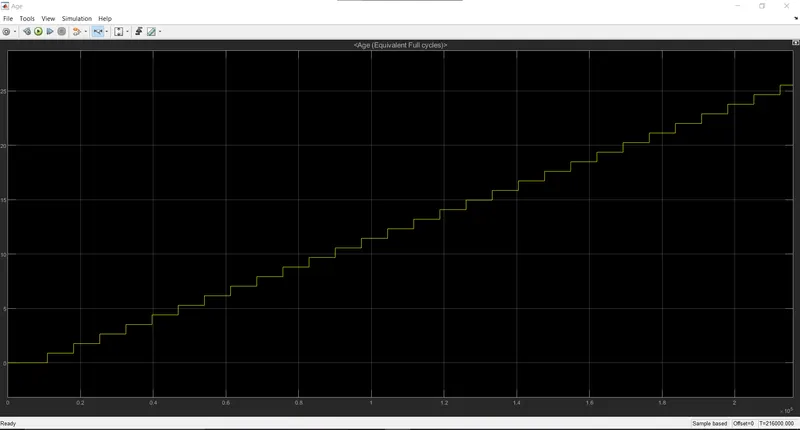
Third plot is for Age for equivant full cycles for the time trace value in this 5 cycles the age value also increase gradually. It around the one complete cycle the age value is 1 as shown in the figure so for all 5 cycles the age value is 4.
2) Simulate this model at various temperature :
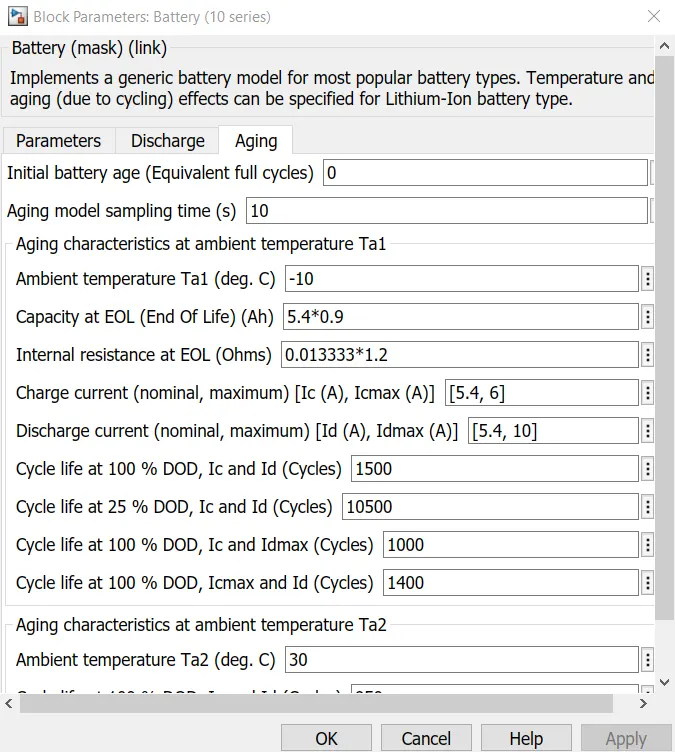
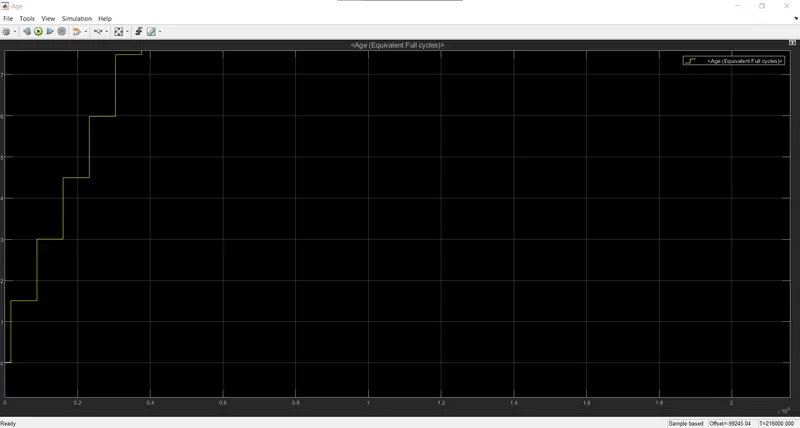
Now we going to simulate this model for the various temperature by default this is in 20 oC, so now for this simulation we change temperture and observe the result. in the battery parameter box from that Aging parameter we need to change the ambient temperature as -10 oC, 2and 30 oC as shown in the figure.
Result:
Simulate this model at various charge and discharge:
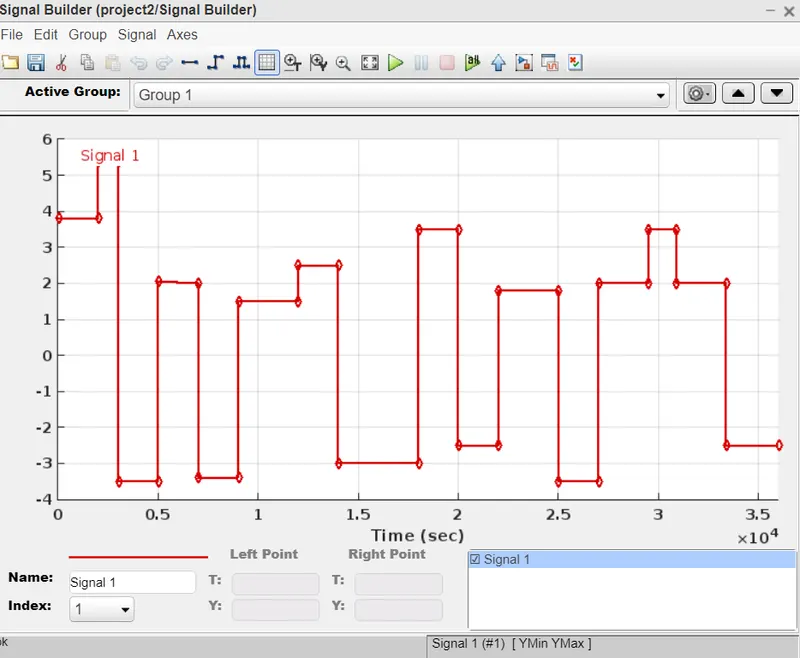
Now we going to simulate this model at various charge and discharge. In the practical life we use many places the battery and we no as fully charge or discharge the battery. At 50% we charge the battery and some time at 30% ect. so we to create the random charge and discharge. For that we use the signal builder and make the random signal to the battery model as shown in the figure. And run the simulation with this signals from the signal builder.
Results :
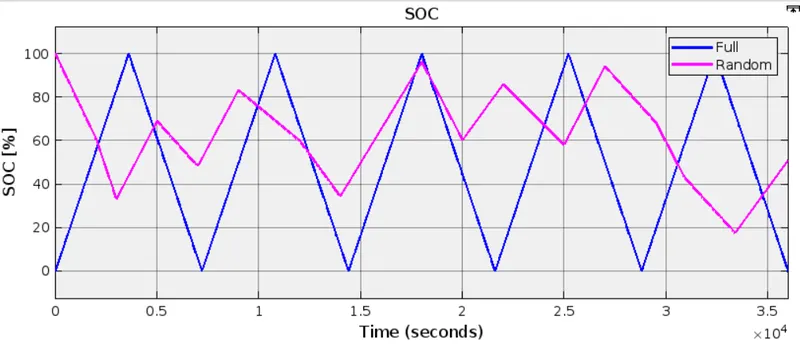
Here we see the SoC of the battery from the random signal(megenta) and the full charge and discharge(blue). And from that the blue line is goes full charge and the full discharge. But the megenta line is not like that it drain from 100% to 35% and then charge for 65% and then for discharge to 50% etc.
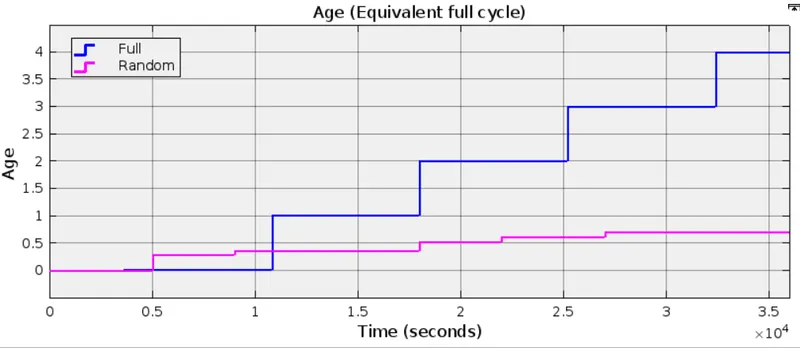
This plot is for the age for the time trace of 5 cycles for the full charge and discharge .so the charge line is less aging when compared to the full charge high aging as shown in the figure. Because the charge we are not fully charge and discharge so to find the one cycle is here is different here and high when comapred to the full cycles. so the aging is here is low which means the life cycle is high when compared to the full charge and discharge.
Conclusion :
Hence the simulation of 10 cell series lithium ion battery model and explaination of thermal effects and compare life cycle performance at various temperatures using MATLAB is done sucessfully. from the simulation we can understand at the low temperature the aging is faster which means the life cycle will decrease when compare to the high temperatures.