Project 1 - Parsing NASA thermodynamic data
The following program defines the file parsing the THERMO.dat
clear all
close all
clc

%universal gas constant(R)
R=8.314;

%loading data
file = fopen('THERMO.dat','r');

% reading lines
fgetl(file);

%collect global temperature
tline = fgetl(file);
global_temp = strsplit(tline);
global_low_temp = str2double(global_temp{2});
global_mid_temp = str2double(global_temp{3});
global_high_temp = str2double(global_temp{4});

%skiping comments
fgetl(file);
fgetl(file);
fgetl(file);

for i = 1:53 %iterate through all 53 elements
     %reads species
     line1 = fgetl(file);
     name = species(line1);

     %Calculate molecular weight and print it
     molecular_weight= function_for_molecular_weight(name);
     fprintf('molecular weight of %s is :%d',name,molecular_weight)

     %collecting local temperature
     local_temp1 = local_temp_range(line1);

     %Collecting coefficient data
     a(1:5) = get_coeffs(fgetl(file));
     a(6:10) = get_coeffs(fgetl(file));
     a(11:14) = get_coeffs(fgetl(file));

     %Temperature
     T = linspace(local_temp1(1),local_temp1(3),500);

     %Specific Heat
     Cp = Specific_heat_calculation(a,local_temp1,T,R);

     %Enthalpy
     H = Enthalpy_calculation(a,local_temp1,T,R);

     %Entropy
     S = Entropy (a, local_temp1,T,R);

     %Plotting aa=nd saving folder

     current_dir = pwd;
     mkdir(name);
     cd(name);

     %Plotting temperature vs specigfic heat
     figure(1)
     plot(T,Cp, "LineWidth",2,"Color",'b')
     xlabel('Temperature[K]');
     ylabel('Specific heat[kJ/Kg-K');
     title(sprintf('Temperature vs Specific heat plot for species'));
     grid on

     %Save jpg of figure(1)
     saveas(figure(1),'Specific Heat .jpg');

     %Plotting temperature vs enthaply
     figure(2)
     plot(T,H,'Linewidth',2,"Color",'b')
     xlabel('Temperature[K]');
     ylabel('Enthalpy [KJ/kg]');
     title(sprintf('Temperature vs Enthalpy plot for  species'));
     grid on

     %Save jpg of figure(2)
     saveas (figure(2),'Enthalpy .jpg');

     %Plotting temperature vs enthaply
     figure(3)
     plot(T,S,'Linewidth',2,'Color','b')
     xlabel('Temperature[K]');
     ylabel('Entropy[KJ/kg-K]');
     title(sprintf('Temperature vs Entropy plot for , species'));
     grid on

     %Save jpg of figure(3)
     saveas (figure(3),'Entropy .jpg');

     cd(current_dir)
end
Explanation:
We start the program using clear all close and clc. we know that the gas constant R=8.314, we are giving that as an input then we load the data,the data is given in the file THERMO.data to open this we use the fopen command the specified 'r' means to read the file.The next step to read lines we use the command fgetl to get the file line.
Now,collecting the global temperature the first step is to get the file and we call global temp, global low temp and global high temp,for global temp we sue the function strsplit to split the column and for low, mid and high temp using str2double (global temp 2, 3, 4) respectively.Next skiping comments to skip lines we use fgetl three times.Now, we use for loop function i = 1:53 to iterate all the 53 elements given in the file.
*Reading the species: to read the species
*Calculate molecular weight
*Collecting local temperature
*Collecting co effs data:There are 14 coefficients we use three variables so we call a(1:5),a(6:10)and a(11:14)
*Temperature: using linspace(local temp 1 to local temp 3 500 values are given.
Next we calculate the following:
*Specific Heat
* Enthalpy
*Entropy
for the above points we use different functions to calculate the values.
Now, we are saving the folder using the cureent_dir=pwd mkdir,cd to save the files automatically.
Plotting:
So, we have to plot images and save them for all the 53 elements where the saving shld br done automatically. We are going to plot for
*Temperature vs Specific heat
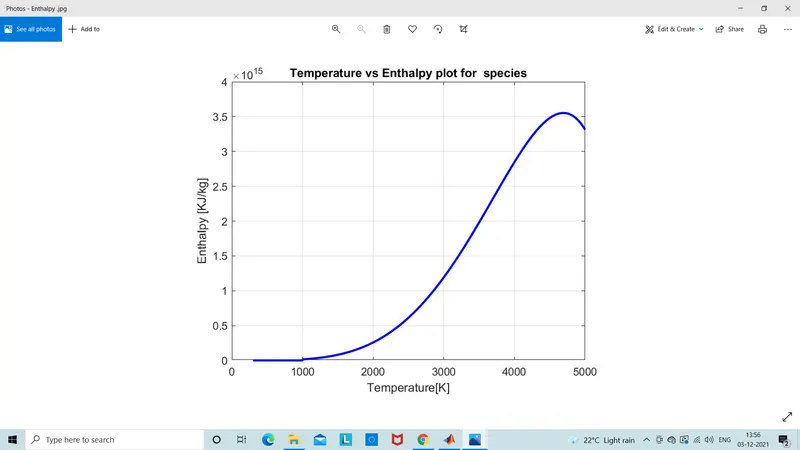
*Temperature vs Enthalpy
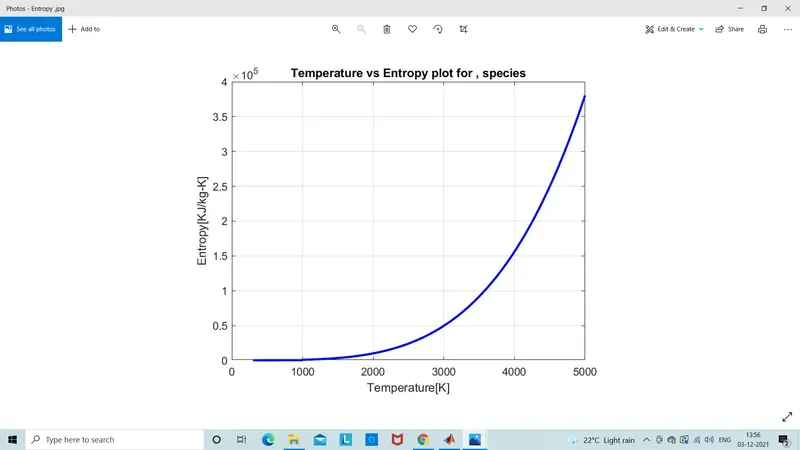
*Temperature vs Entropy
The command are similar for all the three plots we use title command to given title for the plot respectively. to save the plots we use save as (figure,the name of the plot .jpg) including the .jpg is important to save the images.
The program for calculating the molecular weight:
function molecular_weight = function_for_molecular_weight(species)

molecular_weight = 0;
Atoms = ['O','H','N','C','S','A'];
Atomic_weight = [16,1,14,12,32,40];
for i = 1:length(species)
    for j = 1:length(Atoms)
        if strcmpi(species(i),Atoms(j))
            molecular_weight= molecular_weight + Atomic_weight (i);
            mark = j;
        end
        k =str2double(species(i));
        if k> 1
            molecular_weight =molecular_weight+Atomic_weight(mark)*(k-1);
        end
    end
end
Explanation the we are namiont he atoms and the weight for the atoms we calling in two different functions atoms and atomic weight respectively. we ude for loop and if else to calculate thr weight the condition is to calculate'molecular weight + atomic weight(i) where i = 1:length of species and j=1:length of atoms we use strcmpi is used to compare two variables and calculate the true and false the comndition for molecular weight in if is k>1 and make sure that the function are closed.
The program to calculate Specific Heat
function Cp = Specific_heat_calculation(a,local_temp_range,T,R)

for i=1:length(T)
    if T(i) <= local_temp_range(2)
        Cp(i) = R*(a(8) + a(9)*T(i)+ a(10)*T(i)^2 +a(11)*T(i)^3 + a(12)*T(i)^4);
    else
        Cp(i) = R*(a(1) +a(2)*T(i)+ a(3)*T(i)^2 +a(4)*T(i)^3 + a(5)*T(i)^4);
    end
end
Explanation:
We use the for loop function and if else the calculation for cp is given i = 1:length of T thtas temperature.
The program for calculating the Enthalpy
function H = Enthalpy_calculation(a, locaL_temp_range, T, R)

for i = 1: length(T)
    if T(i) <= locaL_temp_range(2)
        H(i) = R*T(i)*(a(8) + a(9)*T(i)/2 + a(10)*(T(i)^2)/3 + a(11)*(T(i)^3)/4 + a(12)*(T(i)^4)/5 + a(13)/T(i));
    else
        H(i) = R*T(i)*(a(1) + a(2)*T(i)/2 + a(3)*(T(i)^2)/3 + a(4))*(T(i)^3)/4 + a(5)*(T(i)^4)/5 + a(6)/T(i);
    end
end
Explanation:
We use the for loop function i =1:length of(T) the condition for if and else is given.
The program for calculating the Entropy:
function S = Entropy(a,local_temp_range,T,R)

for i = 1:length(T)
    if T(i) <= local_temp_range(2)
        S(i) = R*(a(8)*log(T(i)) +a(9)*T(i) +a(10)*(T(i)^2)/2 +a(11)*(T(i)^3)/3 +a(12)*(T(i)^4)/4 +a(14));
    else
        S(i) = R*(a(1)*log(T(i)) +a(2)*T(i) +a(3)*(T(i)^2)/2 +a(4)*(T(i)^3)/3 +a(4)*(T(i)^4)/4 +a(7));
    end
end
The program for species
function species = species(line)

temp = strsplit(line);
species = (temp{1});

end
Explanation:
We use the function temp and split the values using the strsplit command.
The program for coefficients
function [a] = get_coeffs(line)

E= strfind(line,'E');
a(1) = str2double(line(1:E(1)+3));
for i = 1:length(E)-1
    temp = str2double(line(E(i)+4:E(i+1)+3));
    a(i+1)= temp;
end

end
Explanation:
We use strfind to find the co efficients we calling the function a(1) str2double 1:E(1)+3. for loop i=1:length(E)-1.
The program for local temp range
function [temp] = local_temp_range(line)

split = strsplit(line,' ');
l = length (split);
mid_temp_range = str2double(split{l-1});
high_temp_range = str2double(split{l-2});
low_temp_range = str2double(split{l-3});

temp = [low_temp_range mid_temp_range high_temp_range];
end
Explanation:
We use the function l = length of split and for mid, low and high temperature we use str2double(splitl(l-1),(l-2)and (l-3) respectively.
Errors:
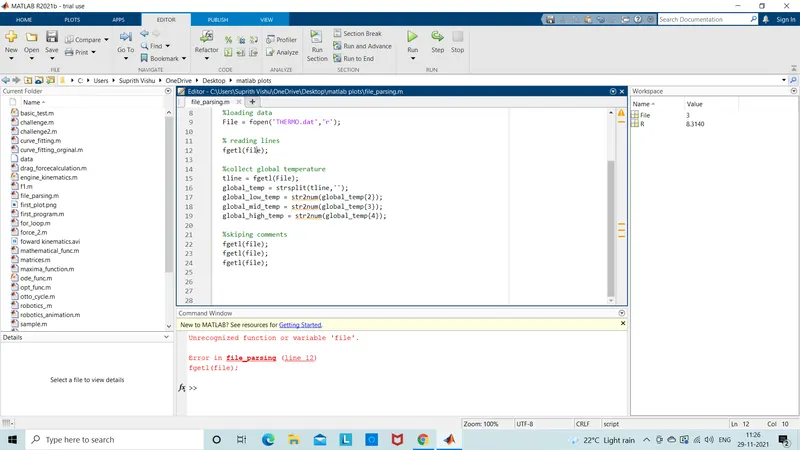
Faced a problem of fgetl(file) the error was calling the File was written in captial and in the same functiion it was written in small letters
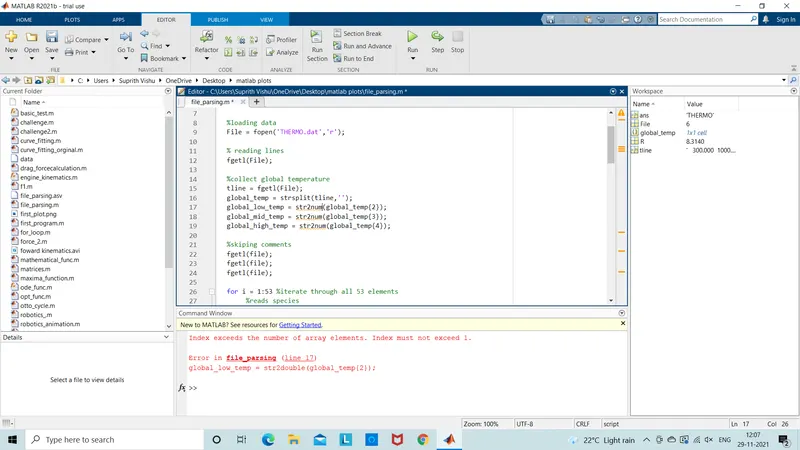
The string was not split and so the values so the function was not able to work so the space in the middle was not needed in the quotes given.
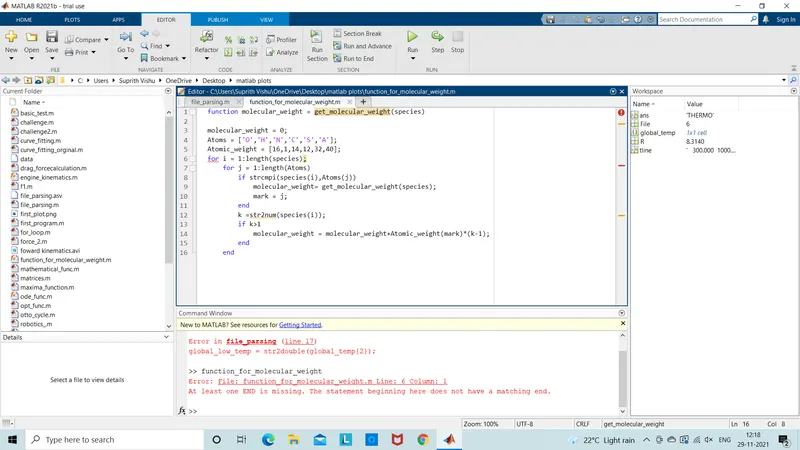
While calling the function get molecular weight we used only molecular weight in the main file parsing function and str2num was changed str2double was replaced.
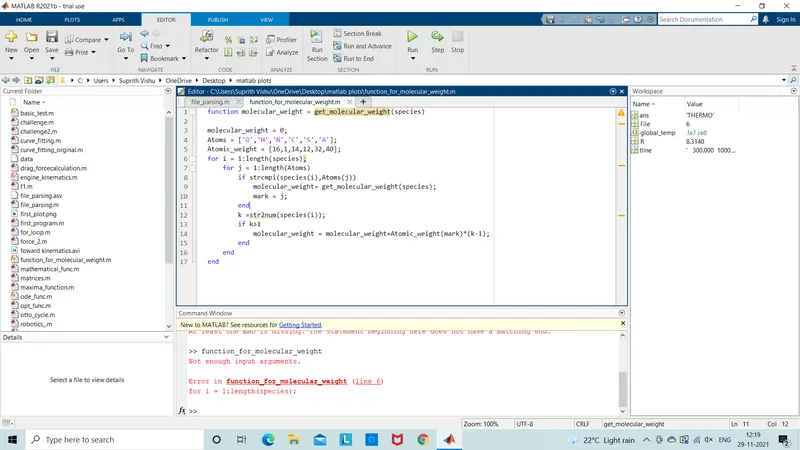
The inputs were not given 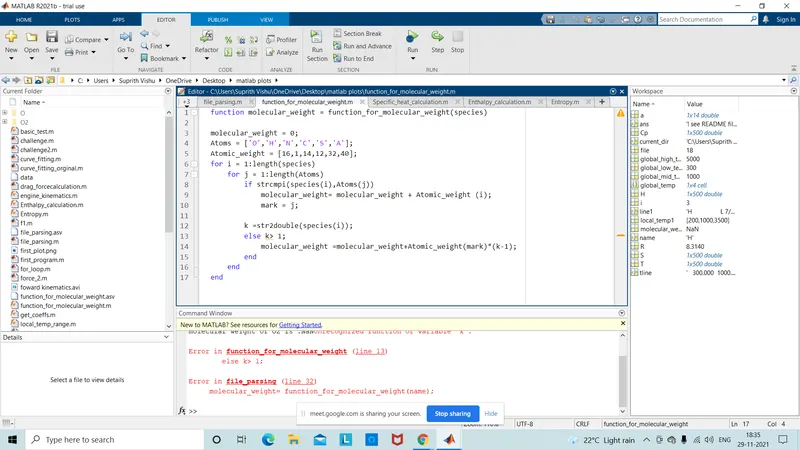
In the function the if command was used and the condition was given and the function was not closed we should look for whether the function are closed before running.
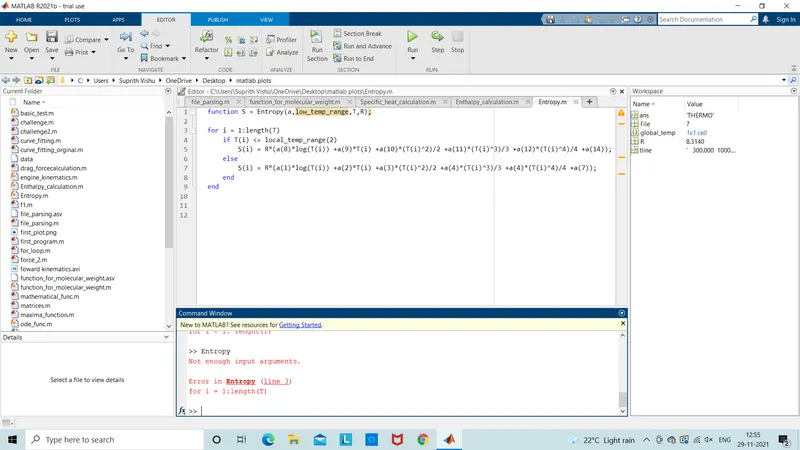
The low temp range was given in another in function the names were usesd twice in a function so that the function was not able to read the program make sure the names are not repeated.
Results:
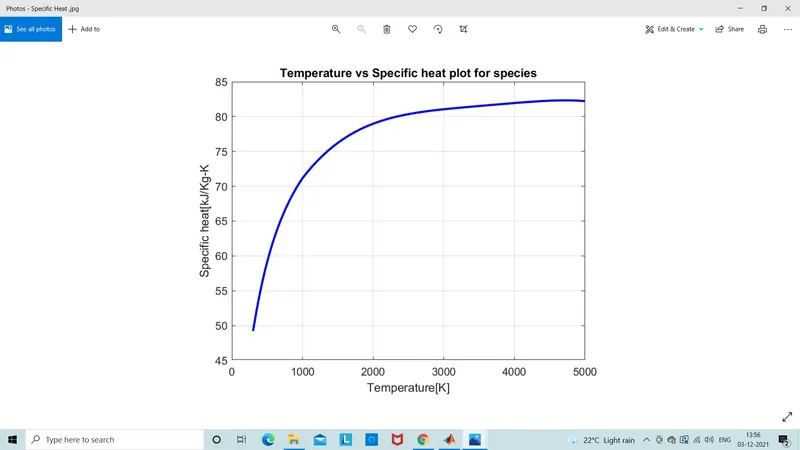
The files which were saved automatically
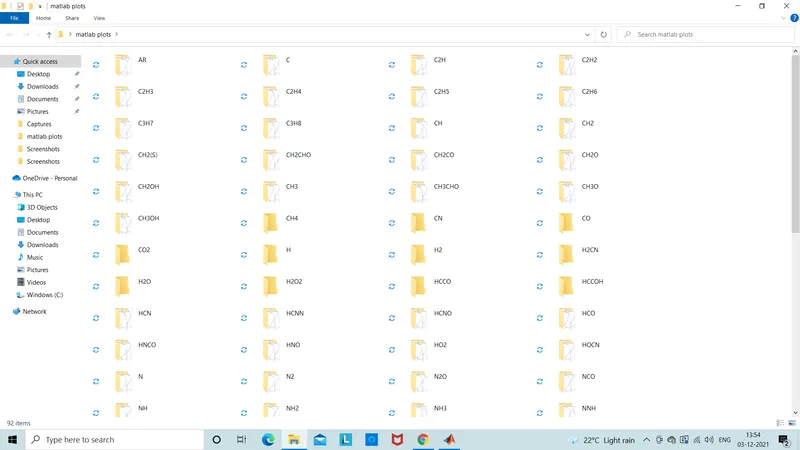
Plots of HCNN
Temperature vs Enthalpy
Temperarure vs Entropy
Temperature vs Specific