Week 4.1 - Genetic Algorithm
The following program is the staglamite program
clear all
close all
clc

%inputs
x = linspace(0,0.6,150);
y = linspace(0,0.6,150);
num_spaces = 50;

% creating a 2 dimensional mesh
[xx,yy] = meshgrid(x,y);

% Evaluating the staglamite function
for i = 1:length (xx)
    for j = 1:length(yy)
        input_vectors(1) = xx(i,j);
        input_vectors(2) = yy(i,j);
        f(i,j) = stagalamite(input_vectors);
    end
end

%study 1-unbounded
tic
for i = 1:num_spaces
    [results,fopt(i)]=ga(@stagalamite,2);
    xopt(i)=results(1);
    yopt(i)=results(2);
end
study_time1=toc;
figure(1)
subplot(2,1,1)
surf(x,y,-f)
shading interp
hold on
plot3(xopt,yopt,-fopt,'marker','o')
subplot(2,1,2)
plot(-fopt)
xlabel('iteration')
ylabel('function maximum')

%study 2 - bounded
tic
for  i = 1:num_spaces
    [results,fopt(i)]=ga(@stagalamite,2,[],[],[],[],[0;0],[0.6;0.6]);
    xopt(i)=results(1);
    yopt(i)=results(2);
end
study_time2=toc;
figure(2)
subplot(2,1,1)
surf(x,y,-f)
shading interp
hold on
plot3(xopt,yopt,-fopt,'marker','o')
subplot(2,1,2)
plot(-fopt)
xlabel('iteration')
ylabel('function maximun')

%study3 - increased initial population
tic
options=optimoptions('ga');
options=optimoptions(options,'PopulationSize',250);
for i=1:num_spaces
    [results,fopt(i)]=ga(@stagalamite,2,[],[],[],[],[0;0],[0.6;0.6],[],[],options);
    xopt(i)=results(1);
    yopt(i)=results(2);
end
study_time3=toc;
figure(3)
subplot(2,1,1)
surf(x,y,-f)
shading interp
hold on
plot3(xopt,yopt,-fopt,'marker','o')
subplot(2,1,2)
plot(-fopt)
colorbar
xlabel('iteration')
ylabel('function maximum')
Explanation
The first step is to assign values for x and y using linspace command of condition (0,0.6,150) and numspace(50).We creating a 2 dimensional mesh using the meshgrid command.The next step is to evaluating the staglamite function.Using the for loop function for x and y we are assigning i and j respectively.Two input vectors are given for x and y we end the function.
Then first condition is 1-unbounded using the tic and toc command we assign a new for loop i=1:numspaces we are giving the opt function for ga means (Genetic Algorithm) of stagalamite function opt means stepdataoption we get two results 1 and 2 we assign result 1 to xopt and result 2 for yopt and end the loop
We plot the graph for the given for loop subplot for unbounded condition we create a surface using the surf command and shadind interp to stop shading.
Next we plot for opt function of x,y and -f a sub plot the xlabel and ylabel are iteration and function maximum.
The next step is for the condition bounded we use tic n toc command using the for loop command i = 1:numspace we use results for fopt then we use the genetic algorithm fo a stagalamite function the values are been given two results are been obtained the result 1 is for xopt and result 2 is for yopt we end the for loop as we did for unbounded function the plotting is similar to bounded also .
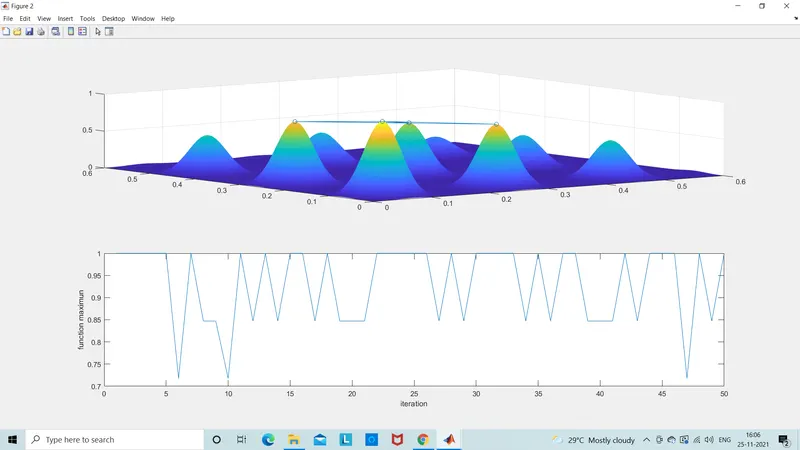
The bounded and unbounded means fo example if we find the highest peak in the whole world is unbounded and the unbounded can be taken as for a region, where the highest peak is a region is been founded. The bounded can give as many high peaks in a region so, we increase the population in the third study.
We are using the tic and toc commands there is a command called optimoptions the work of this command is returning thelist of options and the default values for the default interior point. We use the for loop as similar for the above two study and the plotting are been same but the populationsize is added and the value 250 is size of the population. the plotting command is similar to the above conditions.
Errors:
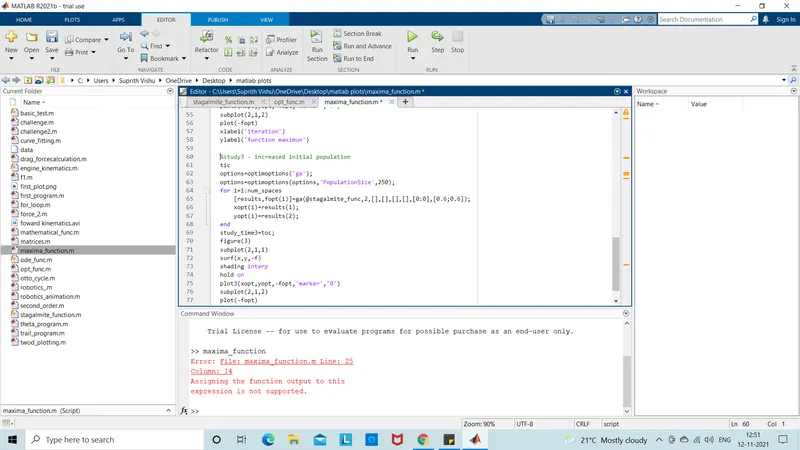 The values were not assigned for the function
We have used a function called ga(staglamite) to run this we need to write a new program
function A = stagalamite(input_vectors)

x = input_vectors(1);
y = input_vectors(2);
f1 = (sin(5.1*pi*x+0.5)).^6;
f2 = exp((-4*log(2)*((x-0.0667).^2))/0.64);
f3 = (sin(5.1*pi*y+0.5)).^6;
f4 = exp((-4*log(2))*((y-0.0667).^2)/0.64);
A = -(f1*f2*f3*f4);
end
we have substuited the values and equation in this program the staglamite values are give from this to the main program.
Results:
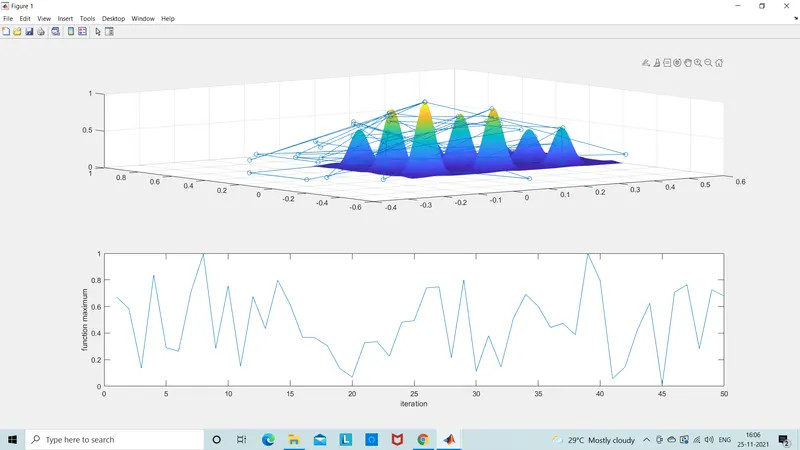
1) The plot for unbounded condition
2) THe plot for bounded ccondition
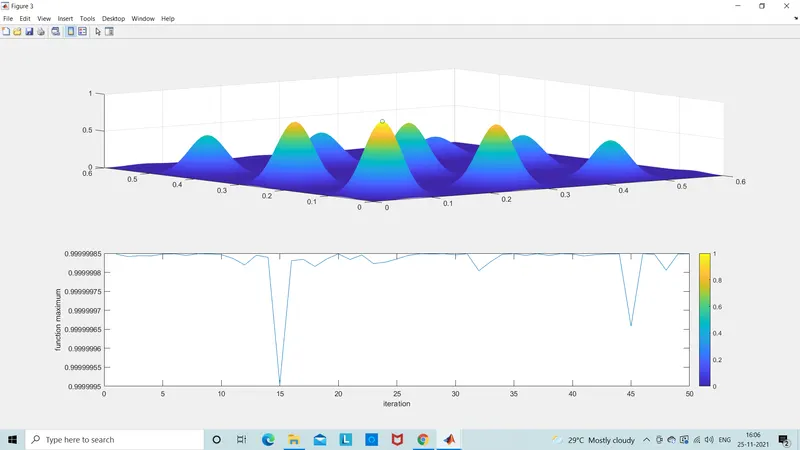
3) The plot fo increase in polulation size