Week 3 - Solving second order ODEs
The following program respresents the second order ode function and animation of the the simple pendulum
clear all
close all
clc

%inputs
b=0.05;
g=9.81;
l=1;
m=0.1;
ct=1;

%initial conditions
theta_0=[0;5];

%time points
t_span=linspace(0,20,500);

%solve ode
[t,results] = ode45(@(t,theta)ode_func(t,theta,b,g,l,m),t_span,theta_0);
plot(t, results(:,1))
hold on
plot(t, results(:,2))
ylabel('angular displacement and angular velocity')
xlabel('time')
title('simple_pendulum')
grid on

%creating animation of simple pendulum
 figure(2)
 ct=1;
 for i=1:length(t_span)
     theta = results(i,1);

     x1 = l*sind(theta);
     y1 = -l*cosd(theta);

     plot([-0.5,0.5],[0,0],'linewidth',3,'color','b');
     line([0 x1],[0,y1],'linewidth',3,'color','r');
     hold on
     plot(x1,y1,'o','markers',25 ,'markerfacecolor','g');
     grid on
     axis([-2 2 -2 1.5]);
     pause(0.00000001)
     hold off
     M (ct)= getframe(gcf);
     ct=ct+1;
 end

 movie(M)
 videofile =VideoWriter('simple pendulum.avi','uncompressed AVI');
 open(videofile)
 writeVideo(videofile,M)
 close(videofile)
Report:
Explanation of the program: We start with the basic commands then the inputs are given b=0.05 damping, gravity,length=1and the mass is given as m=0.1 and (ct) current transformer is 1. Then the initial conditions are given as theta_0 ranging frm 0 to 5 where time points are t_span of linspaace(0,20,500) linspace generaters values 500 valeus between 0 to 20 solving the ode function we have taken ode45 which is an inbuilt function in matlab we need to write another program not o complicate within the single program in the ode function used to call all the paramaters like b,g,m,l,t_span and theta_0. We plotting the function program using the plot command and using plot(t, results(:,1)) and another plot similarly plot(t, results(:,2)) marking y axis as angular displacement and angular velocity x axis as time
To create an animation video: Using the for loop lets take i=1;length(t_span) and x1 is l*sind(theta) similarly y2 is -l*sind(theta) using the plot command using thr range -0.5 to 0.5 and 0,0 the next plot using the marker and markerfacecolor.The use of markers and markersfacecolor is to distuinguish multiple lines and to fill color respectively using axis9[-2 2 -2 1.5]) and pause command usinf getframe command we derive the function and close the for loop usinf videofile command and writevideo command the animation is saved
To run the ode_func in the program
function [dtheta_dt] = ode_func(t,theta,b,g,l,m)

theta1 = theta(1);
theta2 = theta(2);
dtheta1_dt = theta2;
dtheta2_dt = -(b/m)*theta2-(g/l)*sin(theta1);
dtheta_dt = [dtheta1_dt; dtheta2_dt];

end
Errors while typing the program
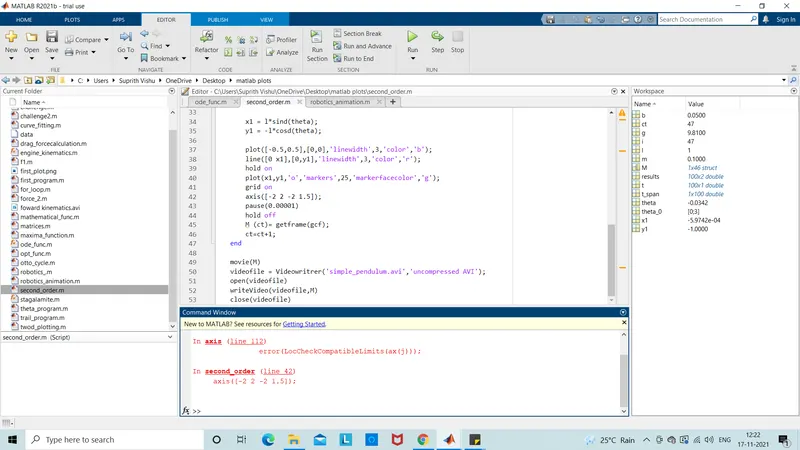
rectified using the semicolon the program was not closed
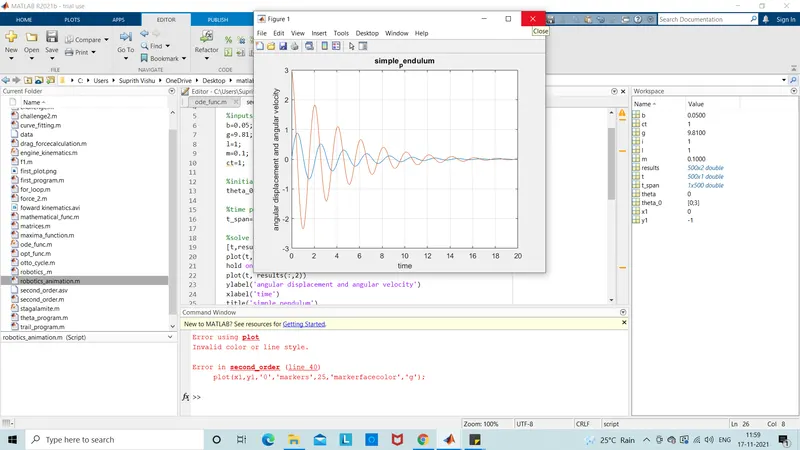
the error was typing zero(0) in the plot function isntead of the alphabet (o)
the final result plot of the program
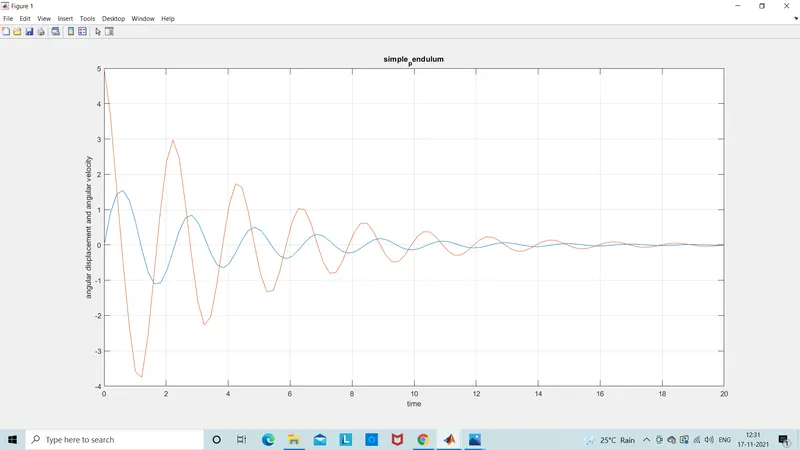
The following link is the animation of the simple_pendulumhttps://drive.google.com/file/d/1PjjNdIJrEFdel9kV1IRfroYLO1un7H_h/view?usp=sharing