Project 2 Thermal modeling of battery pack
For a 10-cell series lithium-ion battery model, simulate the thermal effects and compare life cycle performance at various temperatures, charge & discharge rates using MATLAB.
AIM:
To built a 10-cell series lithium-ion battery model,
To simulate the thermal effects and compare life cycle performance at various temperatures, charge & discharge rates using MATLAB.
Battery pack with the thermal effect:
The battery pack is a set of cells or modules which are connected in either series or parallel based on the required voltage and current capacity ratings. The main thing we gave to observe is that in the battery pack each have to be in the same voltage and capacity ratings whether it having different type of connections to get good efficiency and perfect SOC.
It is an important part in the electrical vehicle because of it runs on this battery cells only. The baseline battery pack produced by the plant is sufficient for 20 miles of vehicle travel at 70% of the pack energy for a vehicle with an energy use of 300 Wh/mile. Due to running by this means it gets in charging and discharging the cells when the vehicle is in running condition which will generates some heat in the cells itself. By this it will gets heat of its continuous working, also by this charging and discharging.
The heat that forms inside of the cells and the heat absorbs by the battery through outside also shown affects on the battery pack which leads to reduce the efficiency and also its life be affected at some conditions if it’s increased it get explode. The effects that come in the battery by the heat are called as thermal effects. To avoid these heat losses in the battery we use the material called the battery management system (BMS) which protect the battery pack from the thermal forms by the cooling systems as well as by some electronic gadgets.
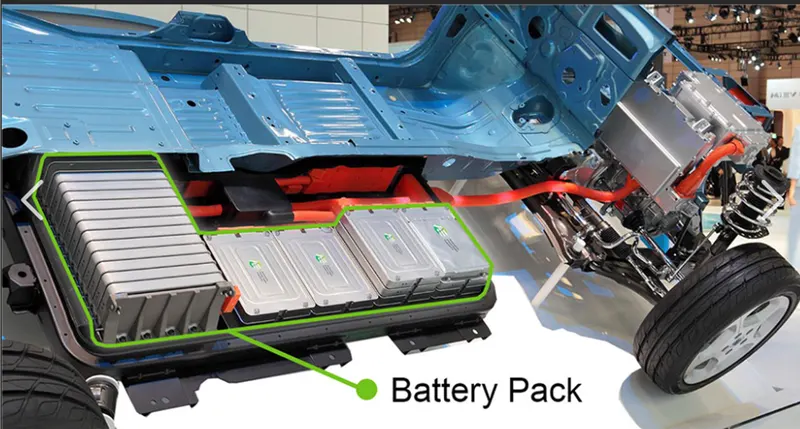
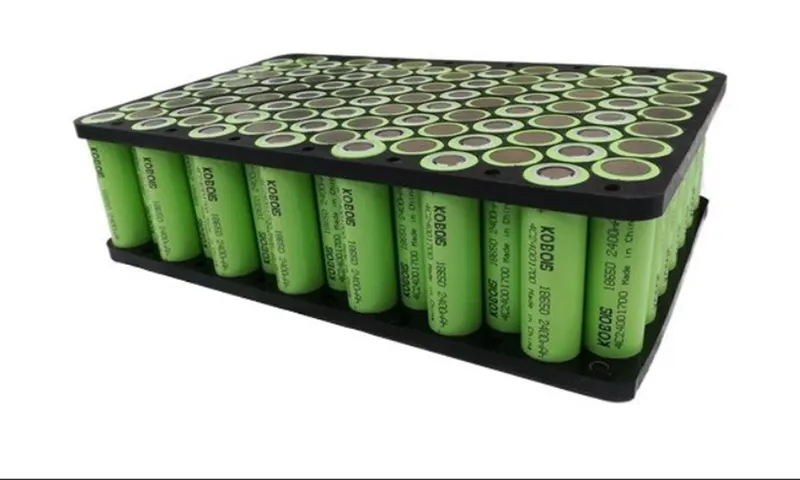 MATLAB Simulink model of a battery pack which included thermal effects and aging as well.
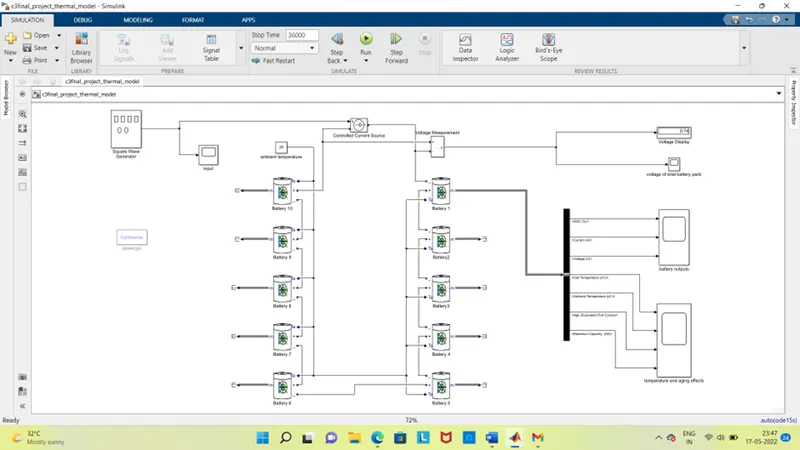
Here we can observe that the all batteries are connected in series that is each battery of +ve terminal connected to the -ve of the next terminal as shown. We used the no of batteries for the connection are 10 as mentioned above. To discharge or charge the battery we use the controlled current source with some signal given by the square wave generator here the controlled current source connected in between the battery 1 one -ve and 10 +ve with +ve and-ve terminals of this source. We are taken the results from the single battery cell in the entire battery pack because all the parameters in each cell are equal and due to connection in the series current values are also same. To find the overall voltage value we take measurement block. Now by changing the values of the temperature that is outside temperature and c rates we can observe the performance of the battery pack.
The blocks that are used to build the model are,
- Battery
- Controlled current source
- Square wave generator
- Voltage measurement
- Bus selector
- Scope
- display
- powergui
Battery:
The battery cells that we used in here is the model are located in the Simulink library at Simscape / Electrical / Specialized Power Systems / Electric Drives / Extra Sources
It is called as a Generic battery model.
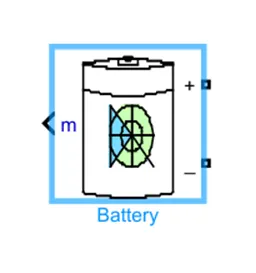
This battery is also called as a generic battery model. It is used to act as same as a real battery, we can use this as different model like 18650, by changing the parameters of the battery and also, we can change based on our requirement in the parameters block, we can also add the temperature that is internal temperature and aging based on our requirement in the parameters block as shown below.
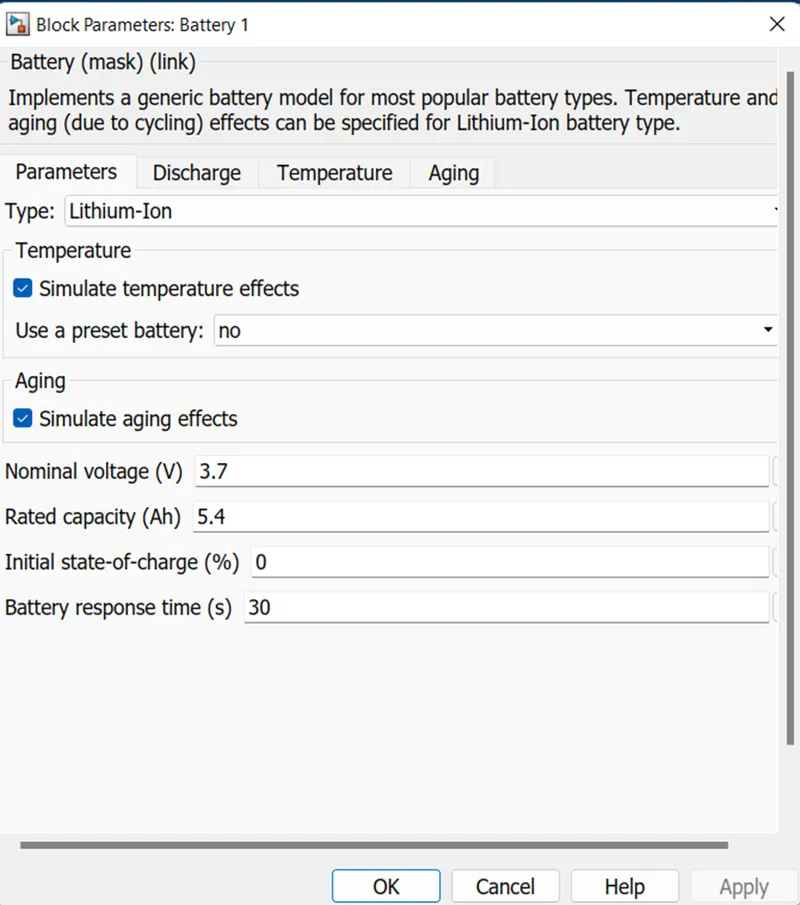
We can also change the parameters like discharge, temperature, and aging effects as shown.
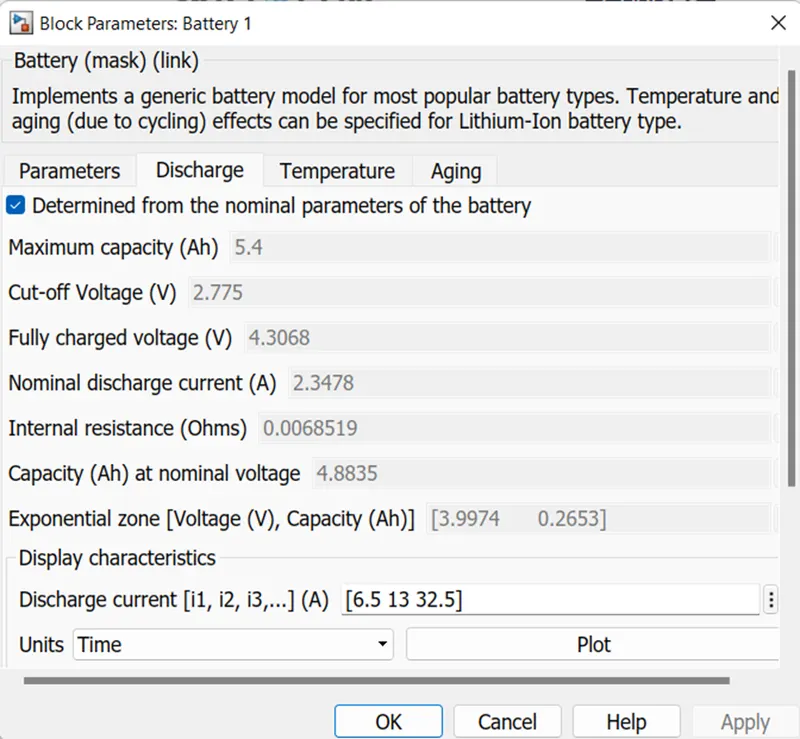
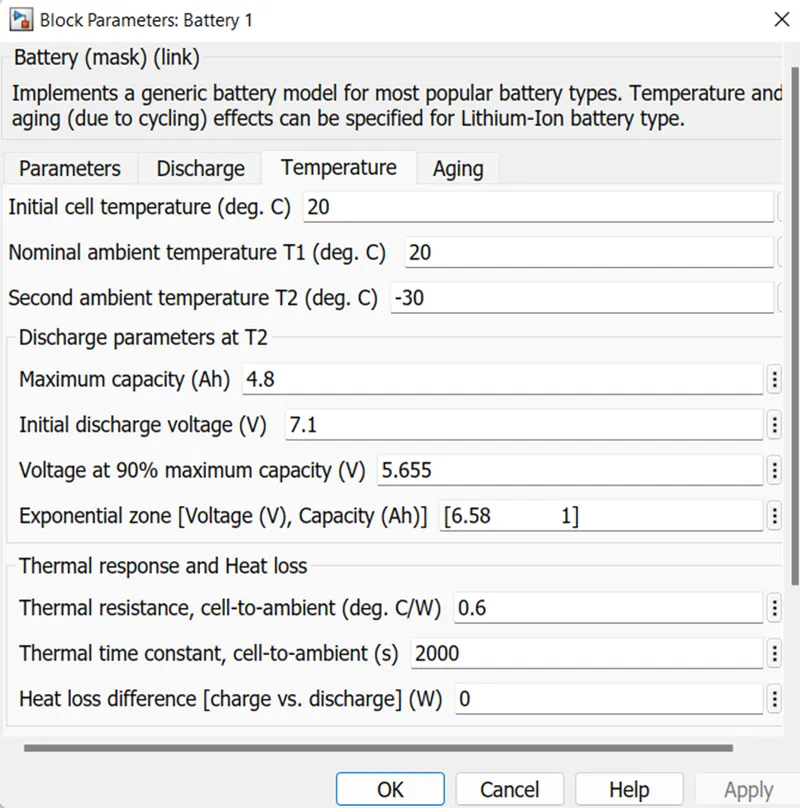
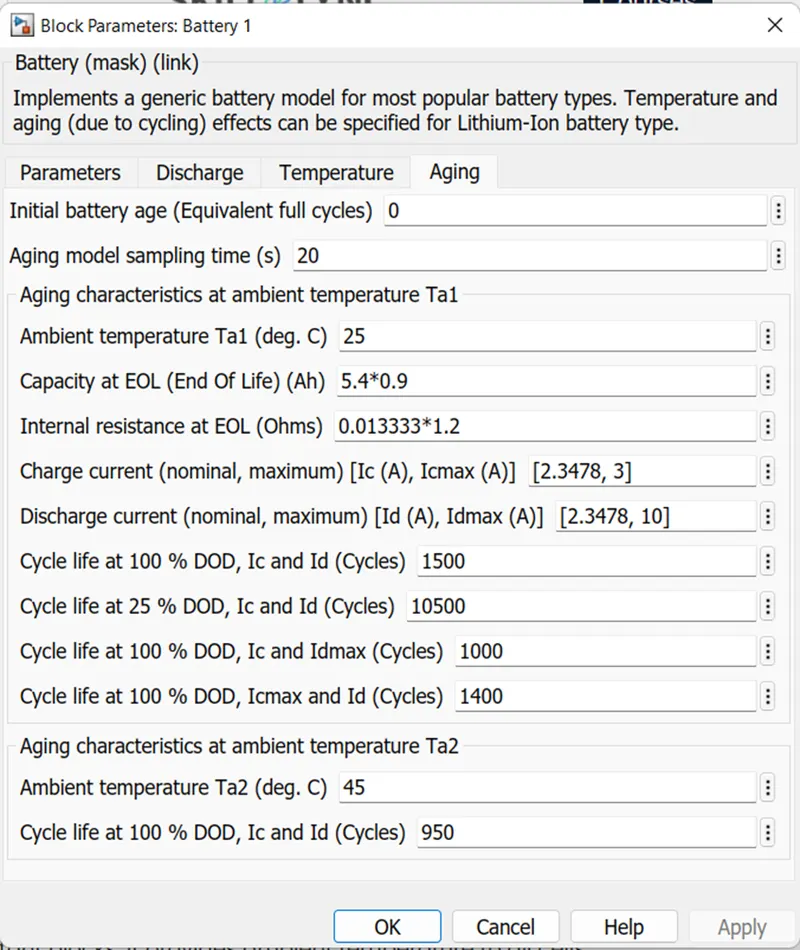
Here in this parameter, we used the initial State-Of-Charge is 0 because we considering that the batteries are being chagrining condition at starting.
This battery is used as a cell in the model which are 10 connected in the series form as from the given condition.
Controlled current source:
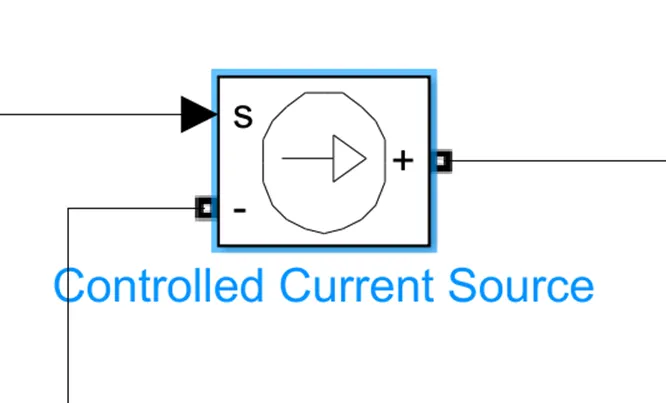
It is located in the library at Simscape / Electrical / Specialized Power Systems / Fundamental Blocks / Electrical Sources
The controlled current source is the current source which is used to control the given input which is at point S. By this block we can control the current flow based on the given signal.
Square wave generator:
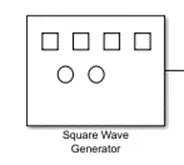
It is located in the Simulink library at Simulink / Sources
It is used to generate the square wave signals as an input to the other sources. It is called as a signal generator which generates various signals like sine, square, sawtooth, and random.
The parameters block of the signal generator is looks like as shown,
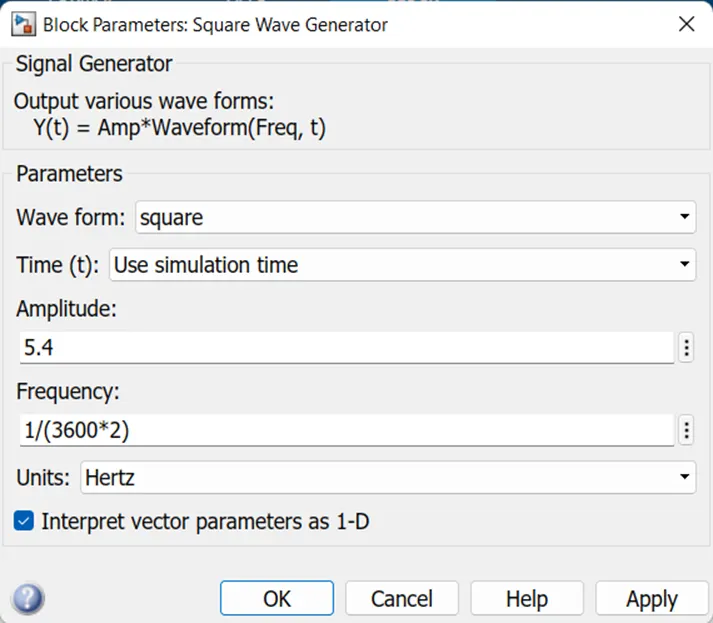
Here we used the amplitude value of about 5.4 because the ampere rating is 5.4Ah that is 1 c rate, by changing the c rate its amplitude value to be change. The frequency is inverse to the time so we take the charge and discharge as one period so the total time of total charge is 7200 sec that is 2 hours this charging and discharging be change by chagrining time that is c rate changes. For frequency we used the hertz as a unit.
Voltage measurement:
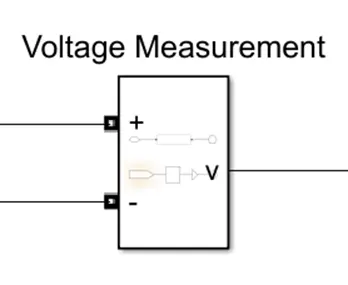
It is located at Simscape / Electrical / Specialized Power Systems / Fundamental Blocks / Measurements in the library.
It is the measurement block which is used to measure the voltage that passes through controlled current source and the battery cells. It is placed in parallel with the battery pack to measure the exact value of voltage. The value from the measurement block is given to the display and the scope through the v in the measurement block to see the results in the form of digital and the graph as well.
Bus selector:
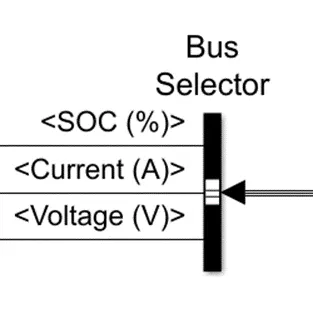
The bus selector is used to collect the output of the all the values of the battery block and used to get the output values based on our requirement. It’s like a selector which is used to select based on our choice. Here we selected all values that is SOC, Current, Voltage from the battery which is used to observe the results of the battery from one side. For another side we used to observe the graphs are cell temperature, ambient temperature, aging and maximum capacity. To see the results, we use the scope.
Display:
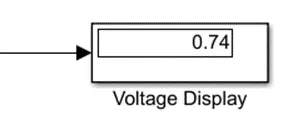
It is located in the Simulink library at Simulink / Sinks
It is used to see the output of the values in the form of digital way
Scope:
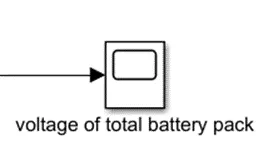
It is located in the library at,
Simulink / Commonly Used Blocks
Simulink / Sinks
HDL Coder / Commonly Used Blocks
HDL Coder / Sinks
It is used to see the output in the form oof a graphical representation that is used to observe each and every sec output to identify or understand easily.
Constant:
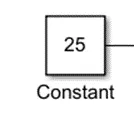
It is located in the library at,
Simulink / Commonly Used Blocks
Simulink / Sources
DSP System Toolbox / Sources
HDL Coder / Commonly Used Blocks
HDL Coder / Sources
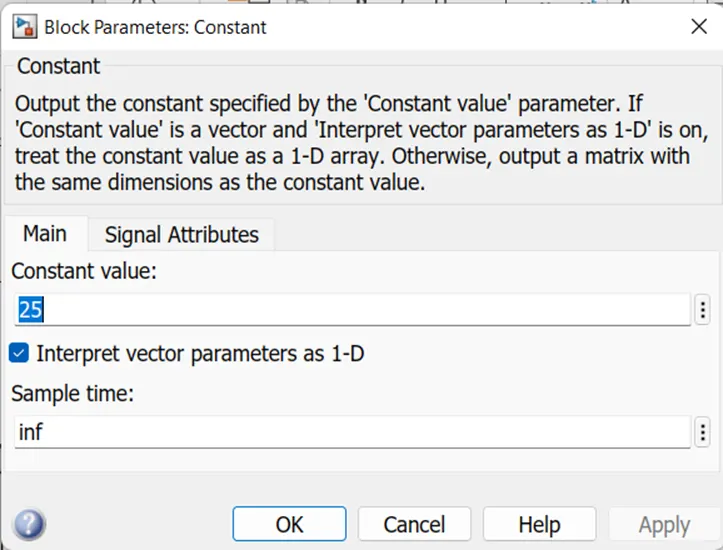
It is used to give the input values in the form of a physical value that is in the form of number.
The parameter block of a constant block is,
Powergui:
It is located in library at Simscape / Electrical / Specialized Power Systems / Fundamental Blocks
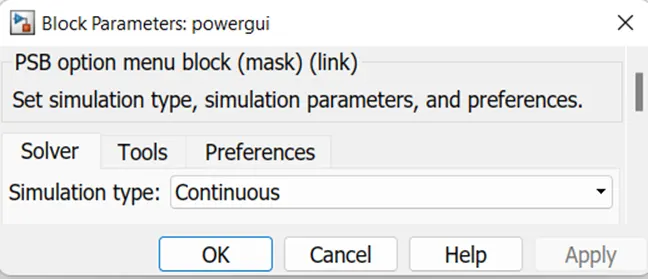
It is used to sole the simulation functions in the model while running. The simulation that we used type is the continuous type which shows in the parameter block as below.
We use terminator that to not to show the errors for the un-useful connections.
Here for the running of the model we taken the stop time is the 36000 sec which is having 10 hours of 5 charging and discharging as well.
Results:
Here we can observe the results in the form of cases at various ranges that is by changing the temperature and c rate values which is charging and discharging rates.
Case 1: ambient temperature is 250C and charge and discharge rate are 1 C i.e., 5.4 Ah
Input is:
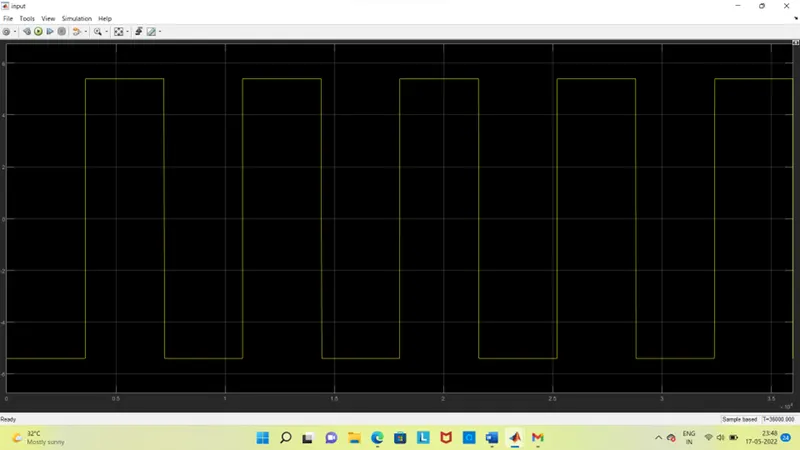
Here if we observe that the amplitude values are 5.4 in positive and negative sides, in this graph that the values are plotted from the down side which means that the battery is going to discharge first, it changes from every hour up to 36000 sec which means 10 hours.
Battery outputs:
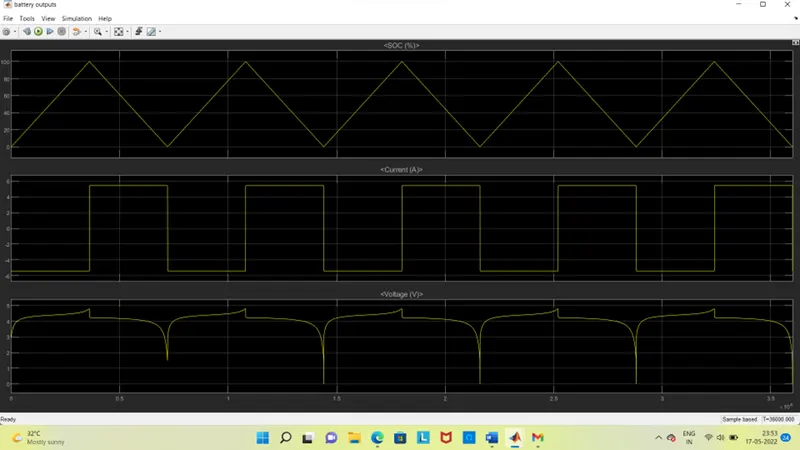
Here if we observe in the SOC graph as we mentioned above that it starts charging from 0, to discharging it gets discharged from 100 to 0.
If we observe the current value that it looks similar to the input because of the given input signals through the controlled current source and also its value is 5.4 A.
In the voltage graph it starts from 3 volts and it flows to 4.8 V at the time of charging and it starts decreasing to 4.2 V to 1.5 V for discharging. again, it starts from 3 V to charge reaches to 4.8 V and discharge from 4.2 V to 0 V in this time and it continuous up to 36000 sec.
Temperature and aging effects:
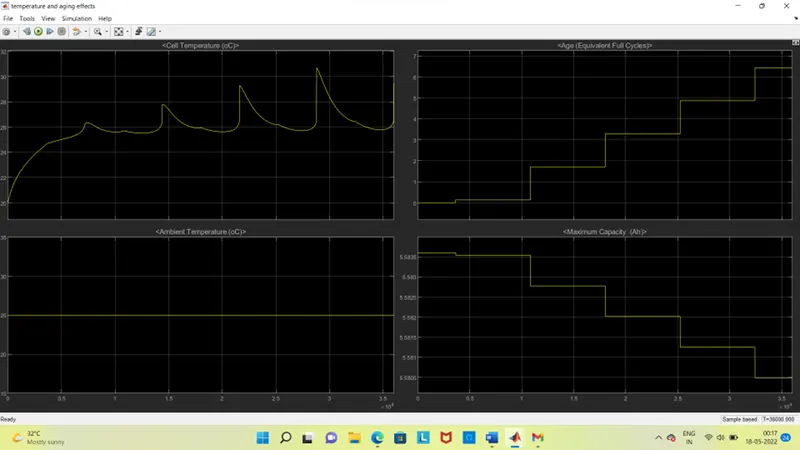
In this first we observe is the cell temperature which is the internal temperature. It is starts from the 200C as from the given and it reaches up to 310C and ends at 29.50C based on the internal changes of the charge ratings.
If we observe the second graph which is the ambient temperature it always kept as a constant value of 250C which is as an outside temperature.
In the age graph if we observe that the aging is at start charging time its life is increased very low of about 0.13 after that for every full cycle it starts increasing 1.62 value nearly that is its age is increased gradually up to 6.5.
If we observe the maximum capacity Ah it looks similar to the aging which is in opposite to each other. here at starting half cycle that is at charging state it reduces low after that its every full cycle it gets reduced the capacity of about 0.0008 nearly.
Voltage of total battery pack:
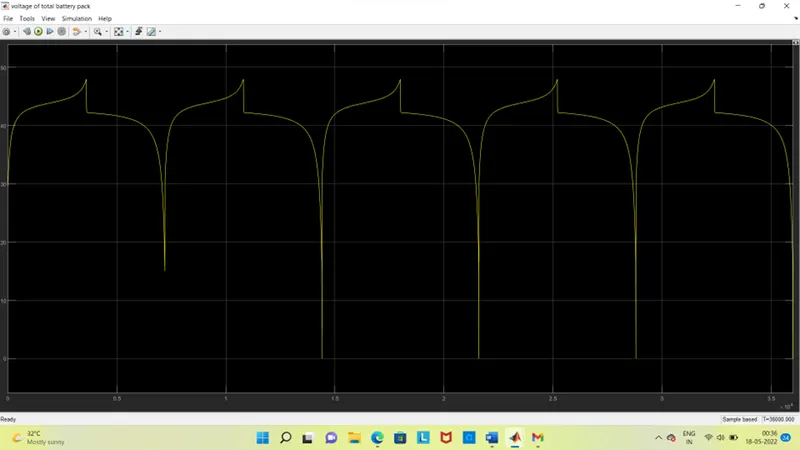
If we observe here, it is same as voltage of each cell battery but the difference is its value are 10 times more than each cell values because in series connection current constant voltage is different. So, battery pack of 10 series connections its values increase to 10 ties that is its starting is 30 V its complete charge at 48V and starts discharging at 42 V and ends at 0 at every time of full cycle except first cycle.
Case 2: ambient temperature 400C and charging and discharging are 5.4Ah.
By changing the ambient temperature that is outside temperature the total voltage, and battery outputs are not changed. Only the temperature and aging effects are changes as shown below.
Temperature and aging effect:
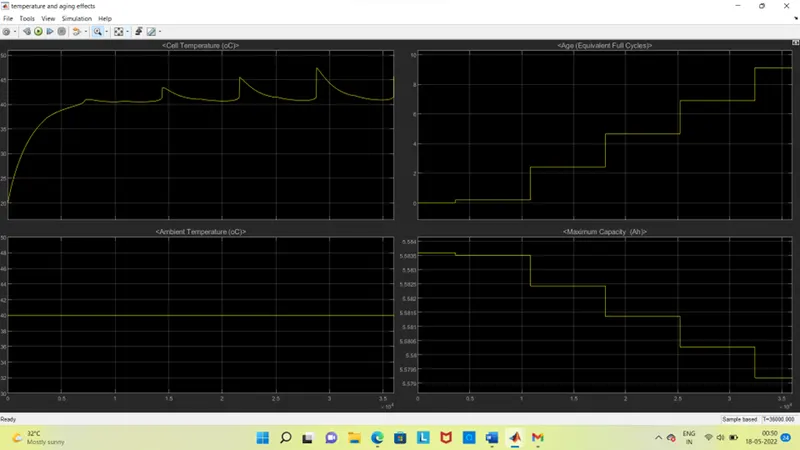
In this first graph we observe is the cell temperature which is the internal temperature is starts from the 400C as from the given and it reaches up to 470C and ends at 45.80C based on the internal changes of the charge ratings.
If we observe the second graph which is the ambient temperature it always kept as a constant value of 400C which is as an outside temperature taken by the constant value.
In the age graph if we observe that the aging is at start charging time its life is increased very low of about 0.2 after that for every full cycle it starts increasing 2.2 value nearly that is its age is increased gradually up to 9.2.
If we observe the maximum capacity Ah it looks similar to the aging which is in opposite to each other. here at starting half cycle that is at charging state it reduces very low after that its every full cycle it gets reduced the capacity of about 0.0010 nearly.
Case 3: ambient temperature is 400C and charging and discharging are 2.7Ah.
In this case we changed the c rate to 0.5 from 1 that is from 5.4 Ah to 2.7 Ah, for this we changed the input square wave value amplitude from 5.4 to 2.7 as below.
Input:
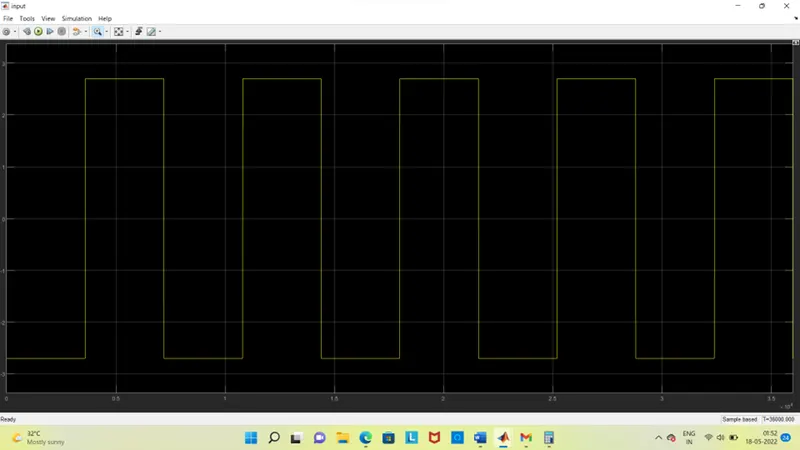
The resultant graph for this is as shown below.
Battery output:
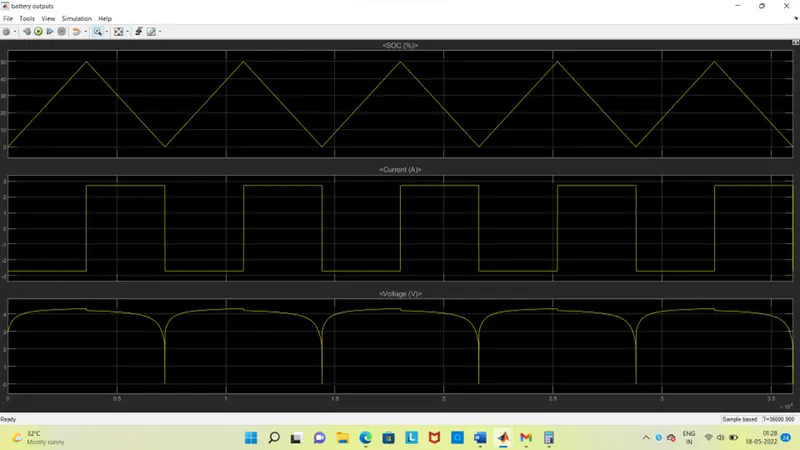
Here if we observe in the SOC graph as we mentioned above that it starts charging from 0 to 50 that is half charging it gets discharged as well as from 50 to 0 as from the given condition.
If we observe the current value that it looks similar to the input because of the given input signals through the controlled current source and also its value is 2.7 A.
In the voltage graph it starts from 3 volts and it flows to 4.32 V at the time of charging and it starts decreasing to 4.2 V to 0 V for discharging.
Temperature and aging effects:
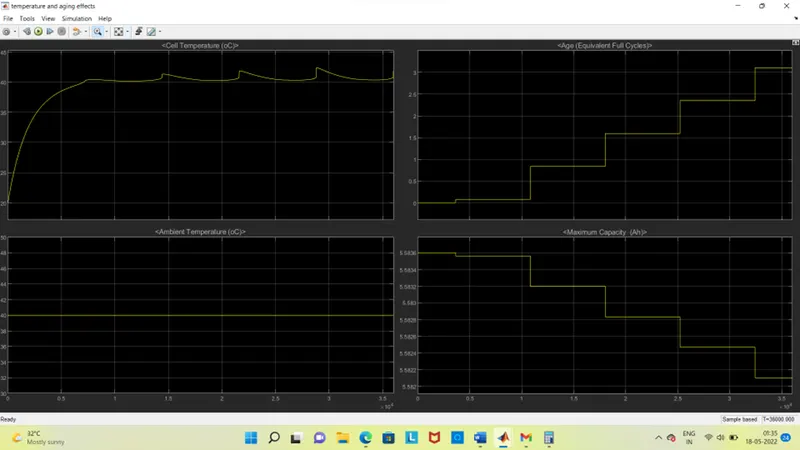
In this first graph we observe is the cell temperature which is the internal temperature is starts from the 400C as from the given and it reaches up to 42.50C and ends at 420C based on the internal changes of the charge ratings.
If we observe in the ambient temperature, it always kept as a constant value of 400C which is as an outside temperature taken by the constant value.
In the age graph if we observe that the aging is at start charging time its life is increased very low of about 0.08 that is very less after that for every full cycle it starts increasing 0.755 value nearly and its age is increased gradually up to 3.1 for 10 charging and discharging in 36000 sec.
If we observe the maximum capacity Ah it looks similar to the aging which is in opposite to each other. here at starting half cycle that is at charging state it reduces very low after that its every full cycle it gets reduced the capacity of about 0.00035 nearly.
Voltage of total battery pack:
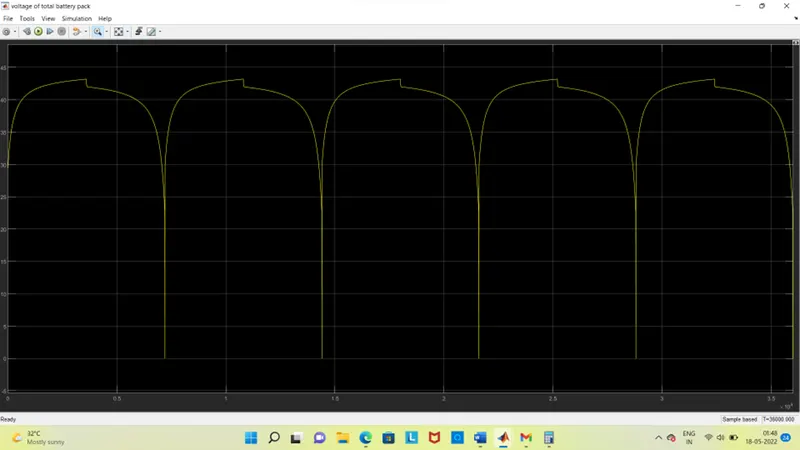
If we observe here, that its starting is 30 V its complete charge at 43.2V and starts discharging at 42 V and ends at 0 at every time of full cycle except first cycle.
Conclusion:
From these results we can conclude that by changing the ambient temperature the battery SOC voltage and current are not gone be affected or as much but its internal cell temperature aging and mac capacity changes are gone be affected. Which will reduce the life and the capacity.
By changing the charging and discharging values that is the C rate its total values all are have to be change that is its SOC be changes as well as voltage and current also be. At the same time, it going to be effect on temperature even though its ambient is not changed. This change is caused by the temperature effecting by internal value that is internal temperature. As the same its shows effect on the aging and the mac capacity as well. Its overall voltage also going to be change.
Here we observe that if we charge and discharge the battery with less C rate its life and max capacity increase as well as temperature is going to down.