Week - 4
- Implement control logic of a “washing machine” using Stateflow as per given sequence:
- If the power supply is available, the system gets activated
- If the Water supply is not available, stop the process & indicate through LED
- Soaking time should be 200s followed by Washing time of 100s.
- Then rinsing happens for next 20s & dryer runs for 50s
After all the processes have completed turn on the finished LED
Based on the given condition we can design the model by using the chart and some other blocks like. Constant, display, led. As shown below fig 1.
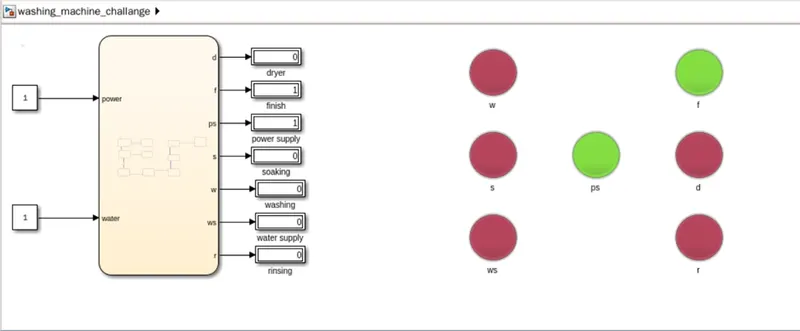
fig 1.
The chart block be designed based on our condition which be look like fig 2. And the process is explained as below
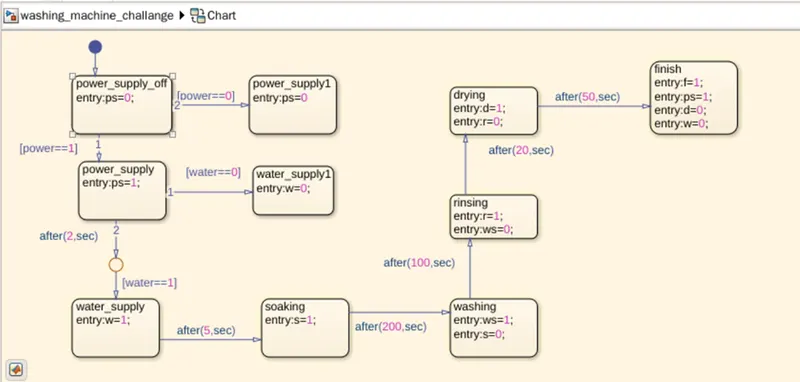
Fig 2.
Process:
The components we used in the chart are the states and condition.
Here the control logic first state (power supply off) is created with two conditions for power supply.
One is the [power==1] which active when power supply is on and displays PS=1,
Another is the [power==0] which active when power is off state. and displays PS=0.
The second is the (power supply) state which is created also the two conditions are one is the [water==0] which actives the water flow to 0 and displays value as w=0 here when we remove the power supply the active machine be deactivated, when we changes the water to 0 total processes be stop until the water state changes to 1 even the power is in on condition. Second is the [water==1] condition is be performed after the given condition of after (2, sec). after 2 sec of time, it draws the condition and establish the results based on the water input
Water supply is the 3-rd. condition state and if the condition of water=1 and it is it displays the output as w=1
After 5 sec the soaking condition be executed, in that case there be one condition that is [after (200, sec)] means after 200 sec of delay time here the washing be started and it continues with condition of 100 sec and displays ws=1 and s as 0.
The next state was the rinsing which works for 20 sec based on condition [after (20, sec)] and displays the output as r=1 and ws=0.
The next condition was the drying which is to be done for 50 seconds, for that condition we use the state is labelled as drying and it display the output as d=1 and r=0.
After that the washing is to be ideal and water supply to be in off state and all the states to be off except the power supply. For that condition we use the state block named as finish in this condition the output values be changed as the f=1, PS=1, d=0, w=0.
All the input and the output values all given to the led based on our requirement, and gives the certain conditions as in the chart.
The input and the output values are shown in the symbols plane.as shown in fig 3.
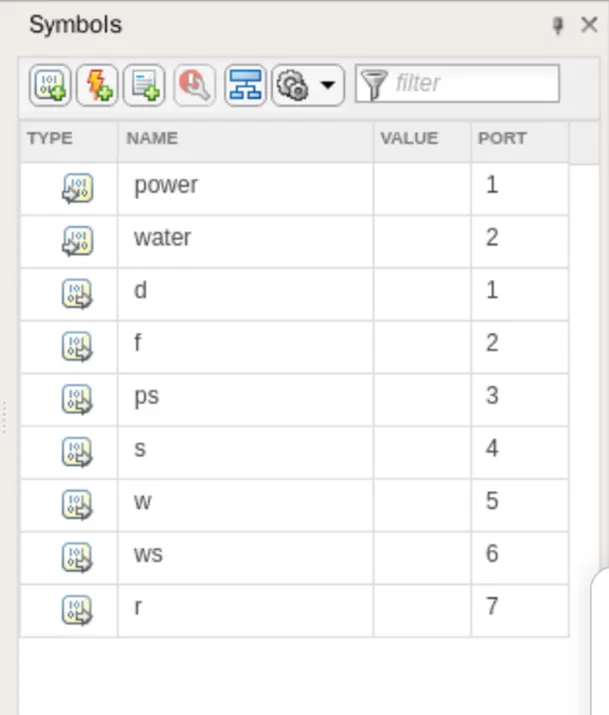
Fig 3.
Here the power and water are the input signal, while the other are all d, f, ps, s, w, ws, r. all output values based on the symbols on left on the above fig we can identify the data types.
The main conditions in the model that we have to observe is as below.
- If the power supply is available, the system gets activated as shown in fig 4 and fig 5.
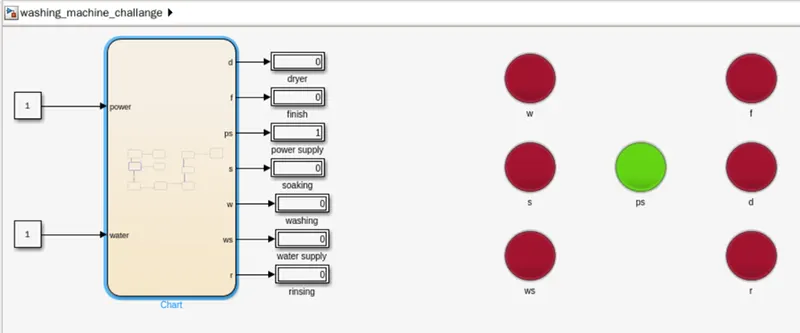
Fig 4.
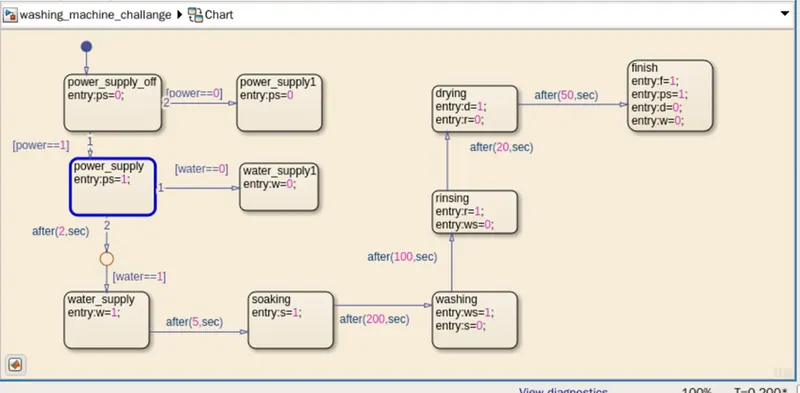
Fig 5.
- If the Water supply is not available, stop the process & indicate through LED as shown in fig 4. And the chart is shown in fig 6.
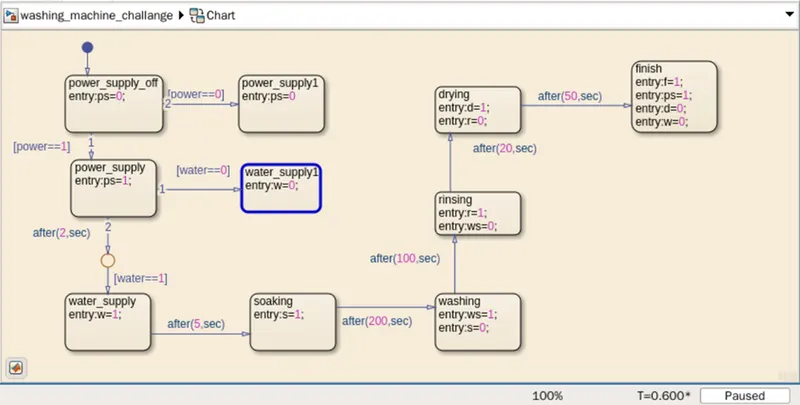
Fig 6.
- Soaking time should be 200s followed by Washing time of 100s.
Before to satisfy this condition first the water supply to be on as shown below after 2sec 3 when the power is on as shown below fig 7. And fig 8.
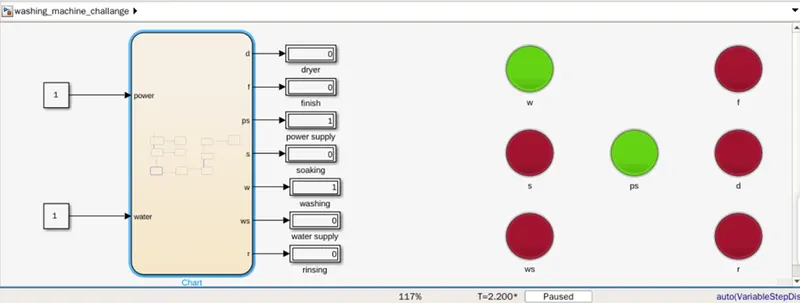
Fig 7.
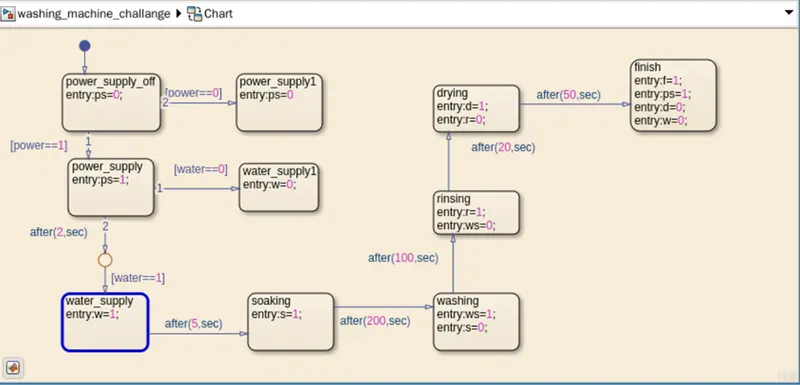
Fig 8.
After the water supply was on the process be continued as shown below figures
After 5 sec the soaking be started for 200 sec.
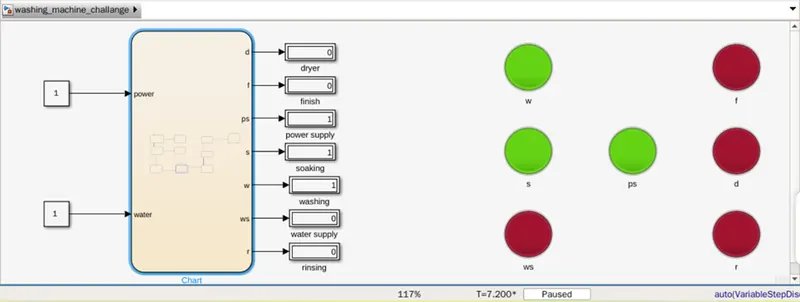
Fig 9.
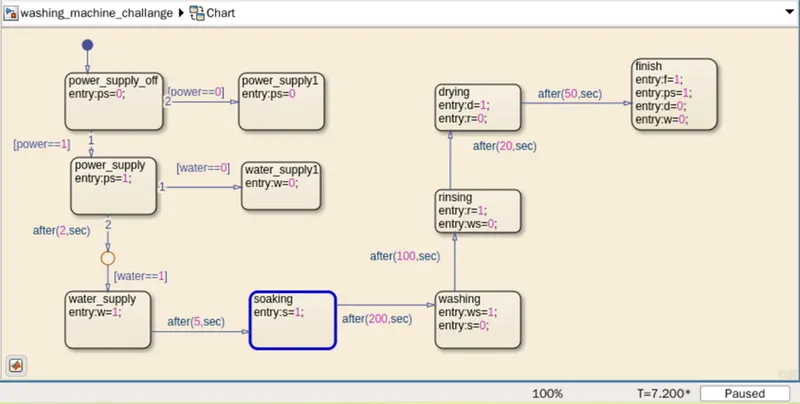
Fig10.
After 200 sec the washing, be started. And it continued for 100 sec
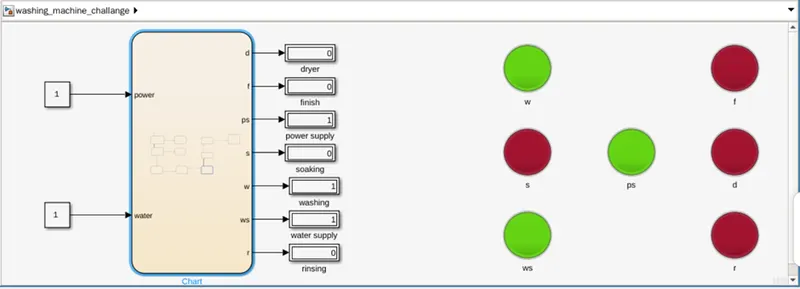
Fig 11.
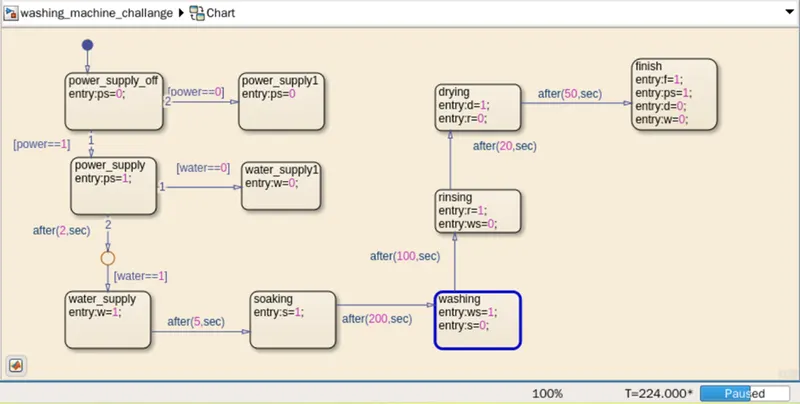
Fig 12.
After 100 sec rinsing be processed and continued for 20 sec.
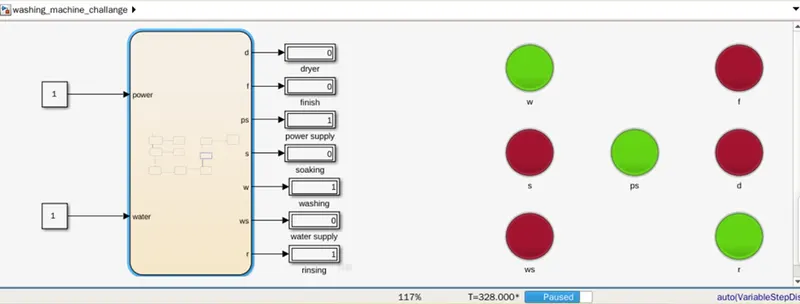
Fig 13.
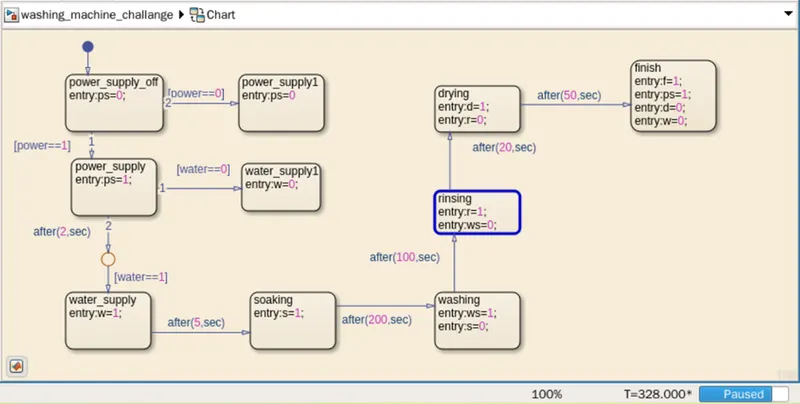
Fig 14.
After 20 sec it changes to drying and it continues for 50 sec.
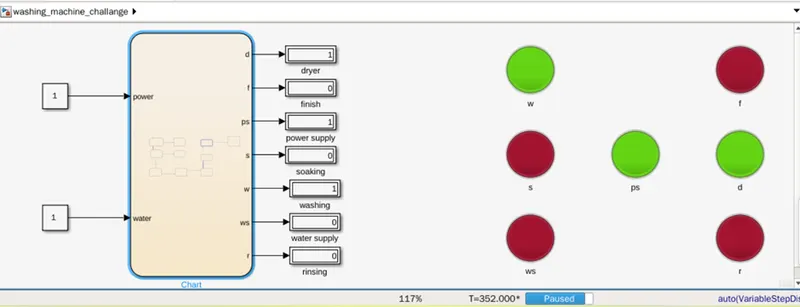
Fig 15.
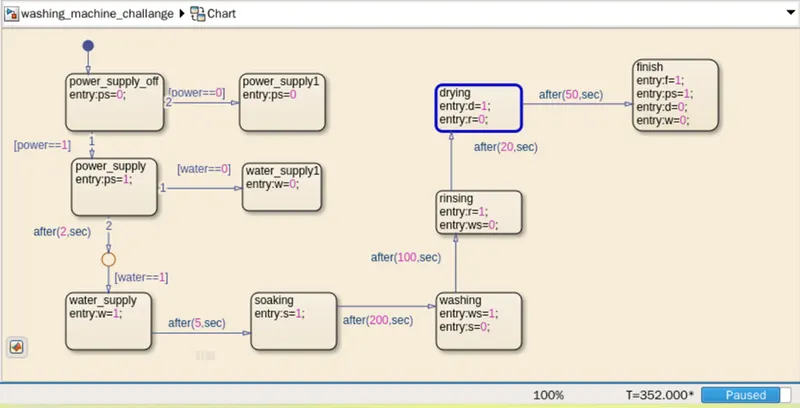
Fig 16.
Finally it complete all the process and end by finishing by led glows to green as shown in fig 17 and 18.
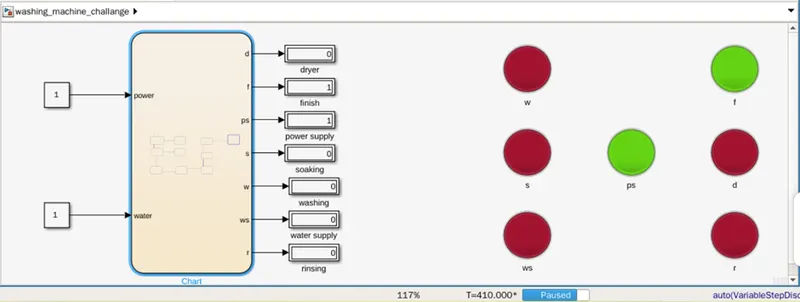
Fig 17.
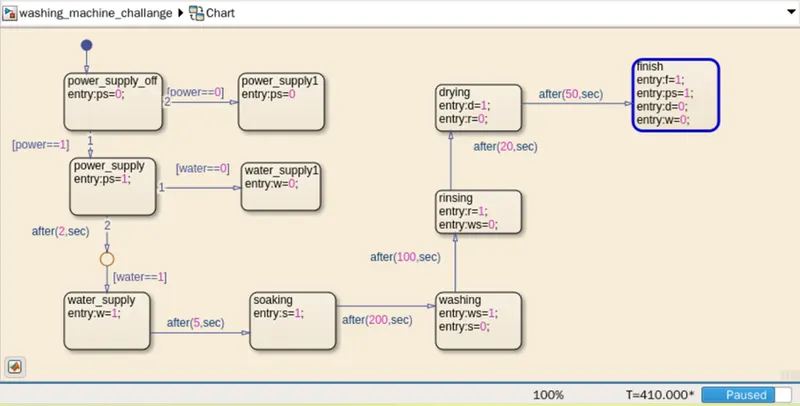
Fig 18.
Hence in this way we can design the model for washing machine based on our given condition.
- Make a Simulink chart for the “Gear shift” logic as per below conditions:
Speed Range(kmph) Gear
0 to 15 1
16 to 25 2
26 to 40 3
41 to 60 4
Above 61 5
Give speed input while the simulation is running & display the gear number.
Based on the given conditions we designed the gear shift model as shown in fig 1. below by using state flow
The condition was build in the chart block by using the various features from the state flow window.as shown in fig 2.
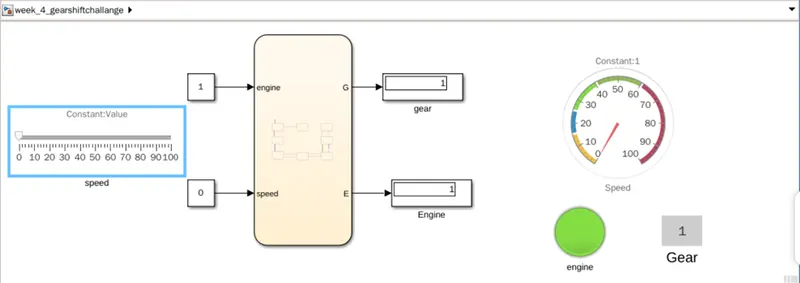
Fig 1.
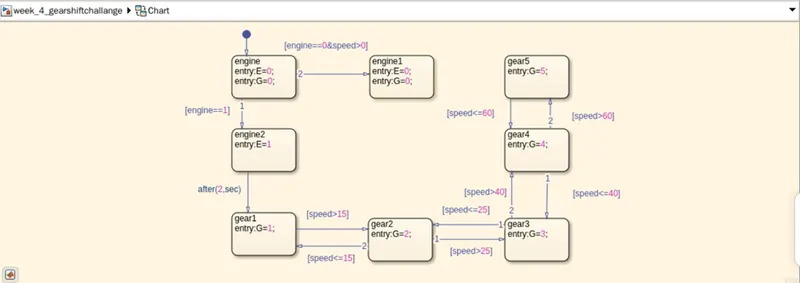
Fig 2.
the symbols panel be looks like as shown in fig 3.
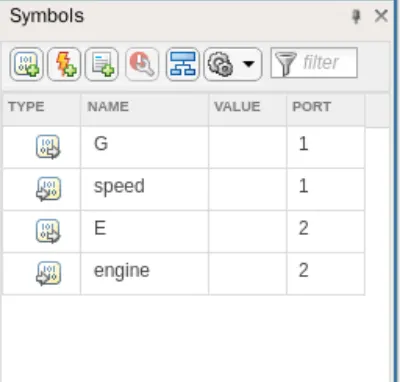
Fig 3.
The blocks used for the input and output connections in Simulink are constants, slider, and display, gauge, lamp, led respectively.
Here the constant blocks are connected to the input ports, engine and speed. display is connected to the output ports, G and E. respectively
Here slider is connected to the input port speed which is used to change the value during the simulation time by just changing the pointer value. And the gauge is also connected to the same speed input block to see the speed of the given input.
Led and the display is connected to the output ports E and G respectively which is used to identify the engine status by blinking the light as given and the display is to identify the gear values based on the speed.
In the chart block each state is connected based on the condition as above which is called control logic to form state flow by using state blocks.
When the engine start (engine==1) then the model be started and displays the output E=1 and based on the speed the gears are adjusted and displays in the output G from 1 to 5 based on the given condition as shown below figs.
Speed - 0 to 15 gear – 1
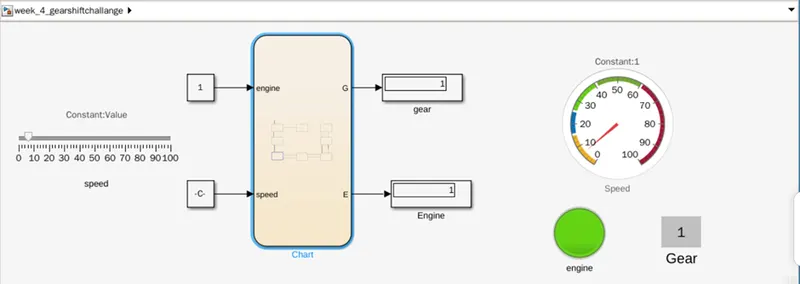
Fig 4.
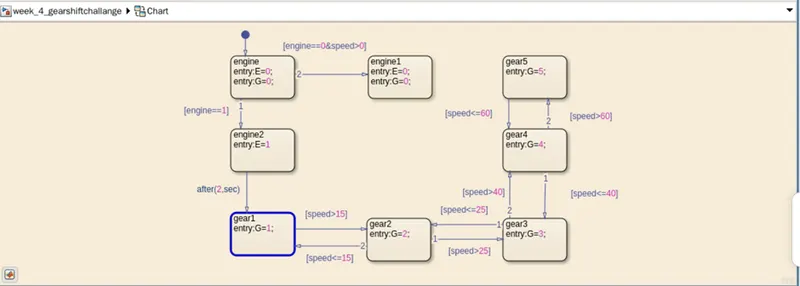
Fig 5.
Speed – 16 to 25 gear – 2
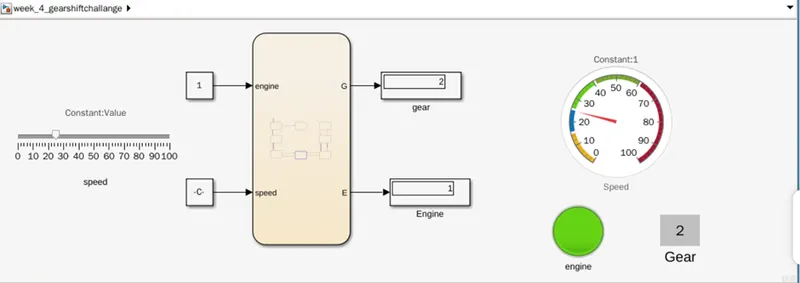
Fig 6.
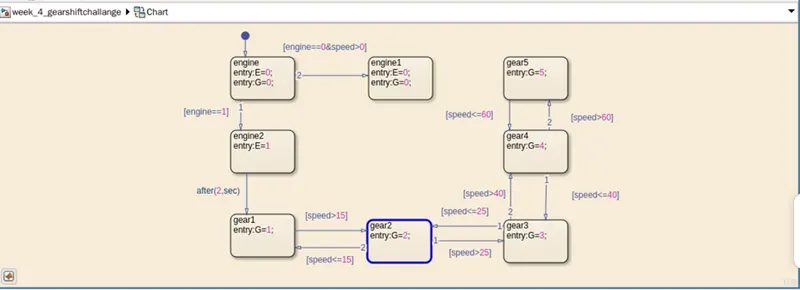
Fig 7.
Speed – 26 to 40 gear – 3
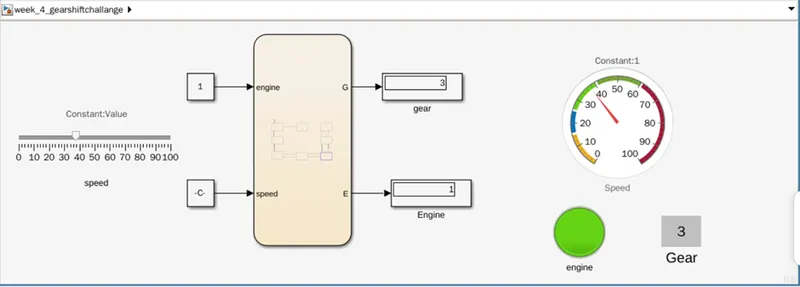
Fig 8.
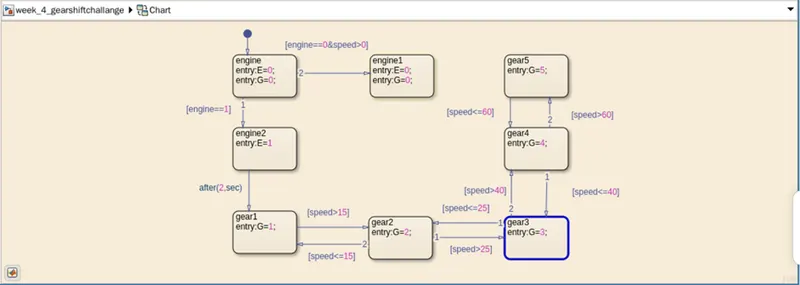
Fig 9.
Speed – 41 to 60 gear – 4
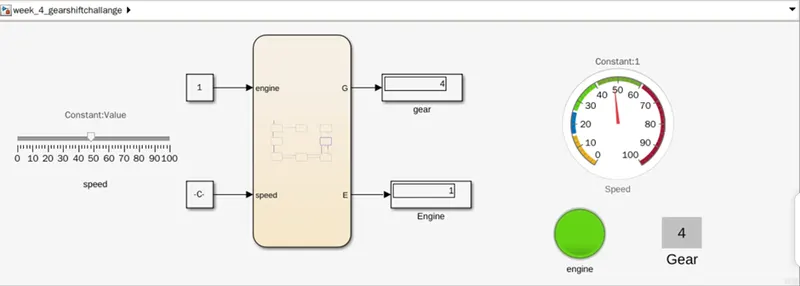
Fig 10.
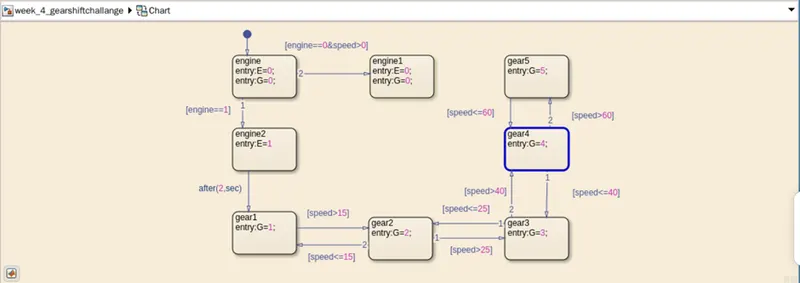
Fig 11.
Speed – above 61 gear – 5
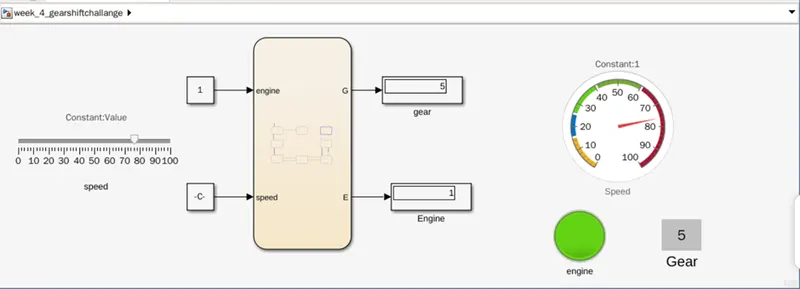
Fig 12.
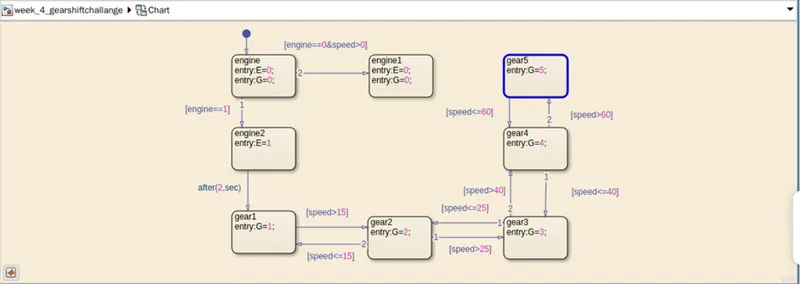
Fig 13.
Hence based on the given condition for gear shifting we completed the model.