Project 2 Thermal modeling of battery pack
Thermal modeling of battery pack
Aim
To simulate the thermal effects and compare life cycle performance at various temperatures, charge & discharge rates using MATLAB.
Objective
To analyse a 10 cell series lithium ion battery model and To simulate the thermal effects and compare life cycle performance at various temperatures, charge & discharge rates using MATLAB.
Introduction
The Lithium Ion batteries are widly used as an energy source in EV's and Hybrif vehicles. A good thermal control system for the batter will increse the efficiency and other operational characters in the vehicle.
The temperature of a lithium battery cell is important for its performance, efficiency, safety, and capacity and is influenced by the environmental temperature and by the charging and discharging process itself. Therefore, a thermal model of the battery is used in order to calculate and estimate the cell temperature.
Simulink Modelling of a 10 cell series lithium ion battery model
To simulate a battery pack consisting of multiple series-connected cells in an efficient manner. A fault can be introduced into one of the cells to see the impact on battery performance and cell temperatures. For efficiency, identical series-connected cells are not just simply modeled by connecting cell models in series. Instead a single cell is used, and the terminal voltage scaled up by the number of cells.
We are using the Referenace simulink model Lithium-Ion Battery Pack With Fault for modelling the 10 cell series lithium ion battery model.
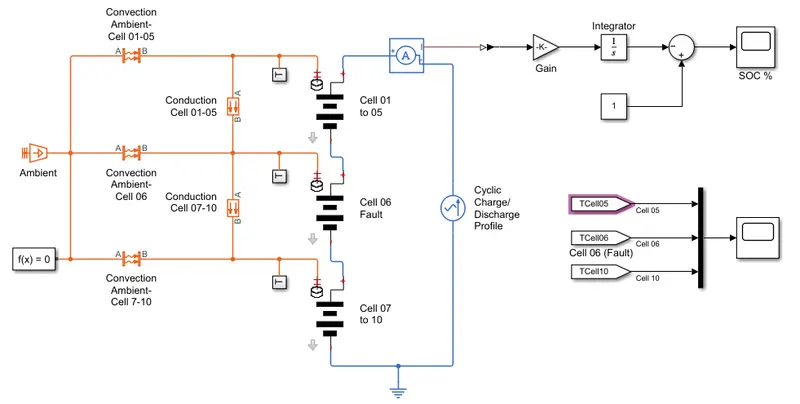
Cell 01 - 05 Subsystem
In this subsystem it is considered that 5 cells connected in series and there parameters has been analysed.
For cell 01-05, 5 cells ares connected in series. The initial temperature is set as 299.1 K.
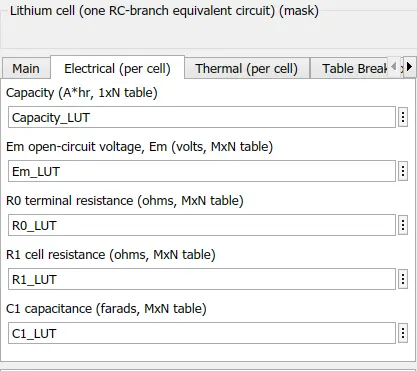
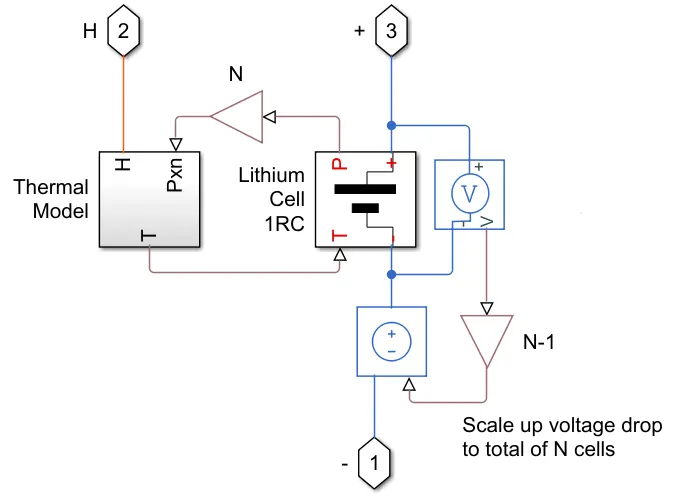
The cell subsystem consists of a Thermal model and Lithium Cell 1RC block tocalculate the temperature and thermal effect for cells and the battery pack.
Thermal Model
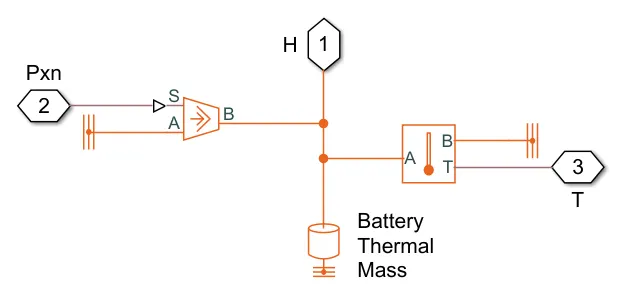
Temperature Sensor
This block measures temperature in a thermal network. There is no heat flow through the sensor. The physical signal port T reports the temperature difference across the sensor. The measurement is positive when the temperature at port A is greater than the temperature at port B.
Controlled Heat flow Rate Source
This block represents an ideal energy source in a thermal network that can maintain a controlled heat flow rate regardless of the temperature difference. The heat flow rate is set by the physical signal port S. A positive heat flow rate flows from port A to port B.
Battery Thermal Mass
This block models internal energy storage in a thermal network. The rate of temperature increase is proportional to the heat flow rate into the material and inversely proportional to the mass and specific heat of the material.
Thermal Refferance
This block represents a reference point in a thermal network where the temperature is equal to absolute zero.
Lithium Cell 1RC
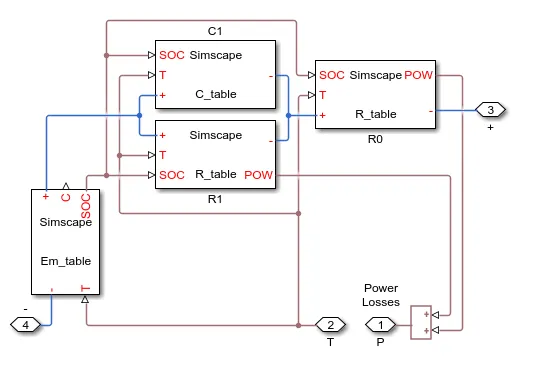
The subsystem consist of a C_Table models a capacitor where the capacitance value depends on an external physical signal inputs SOC and T. It is assumed that the capacitance value is slowly varying with time, and hence the equation i = C*dv/dt holds.
The R_table Models a resistor where the resistance value (R) depends on an external physical signal inputs SOC and T.
Cell 06 Subsytem (Fault Cell)
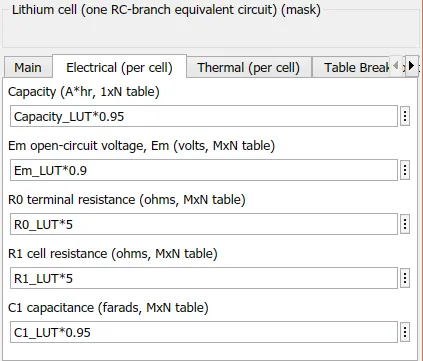
A cell cell is connected in series with an initial temperature 299.1K.
Cell 07 - 10 Subsystem
In this subsystem it is considered that 5 cells connected in series and there parameters has been analysed.
For cell 07-10, 4 cells ares connected in series. The initial temperature is set as 299.1 K.
Similar the Cell 01-05 Subsystem Cell 07-10 Subsystem consist of Thermal model and Lithium Cell 1RC block to calculate the temperature and thermal effect for cells and the battery pack.
SOC Estimation
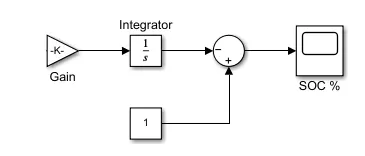
The coulom counting method measures the discharging current of a battery and integrates the discharging current over time in order to calculate SOC.
Current is set as input and battery State of Charge as output.
The Gain of this circuit is set as 1/(50*3600)
Result
For 299.1 K
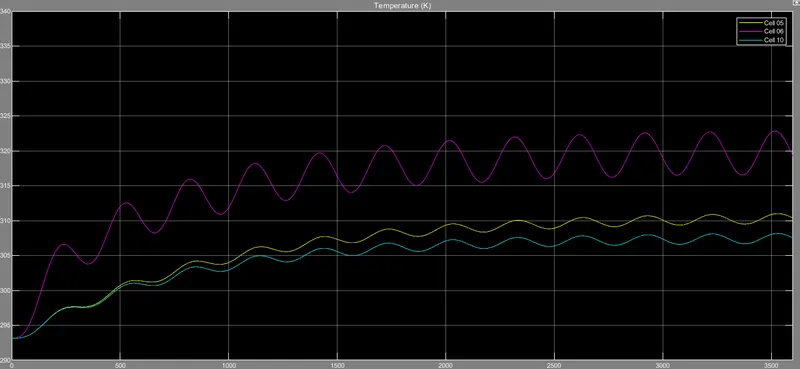
Starting and End Temperature
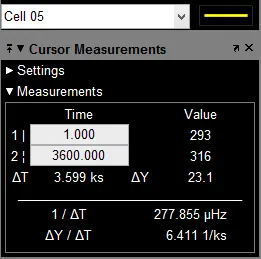
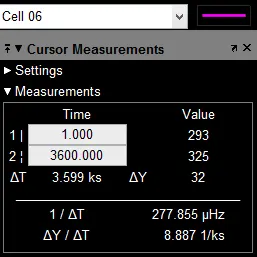
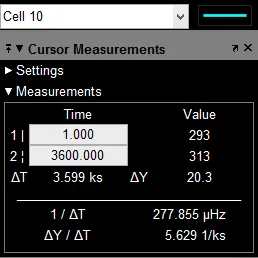
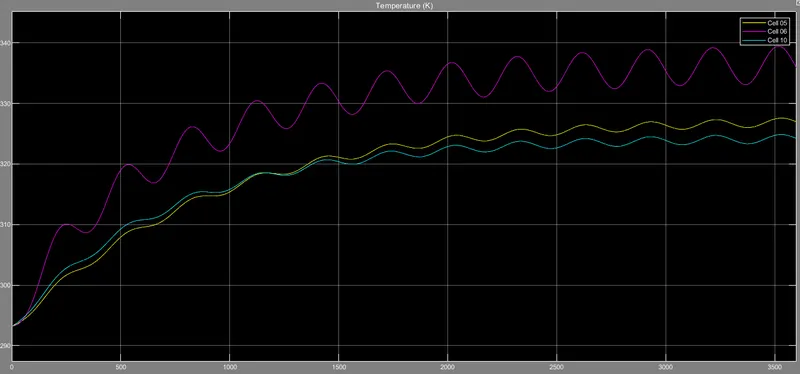
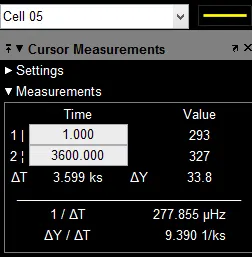
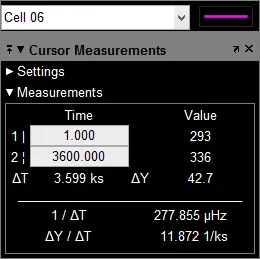
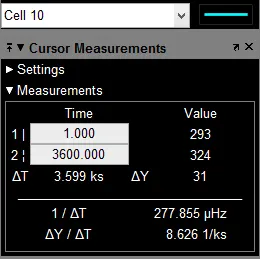
From the above charts we can see all the cells are having same temperature. After some time the cell 06 temperature is rising rapidly when compared to cell 5 and cell 10.
The final temperature of cell 5 and cell 10 is very much same ut cell 6(Fault cell) shows a high temperature rise.
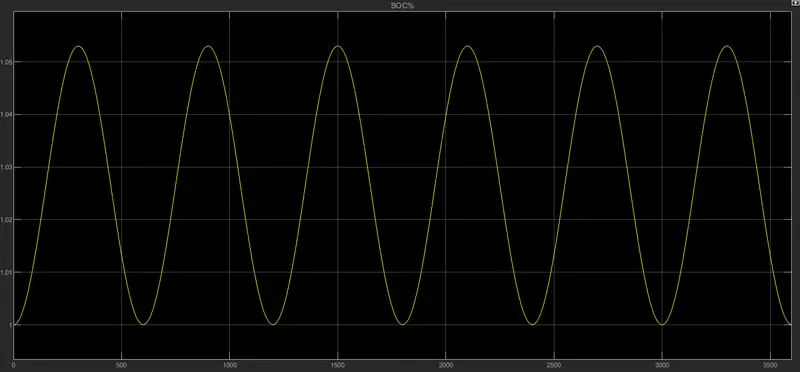
State of Charge (SOC)
For 310 K
Starting and End Temperature
Conclusion
As the differance in temperature we can observe the changes in heat flow rate y conduction and convection.
There are slight changes in cyclic charge and discharge.
SOC of the battery pack remains same irrespective to the change in the temperature.
Cell 6 shows the higher temperature rise due to the fault set up of the cell.
We simulated the thermal effect and compared at various temperature, faulty cell temperature, discharge cycle and performance of the battery pack.
Refferance
This model taken for modelling.