Project 2 Thermal modeling of battery pack
*This assignment is for the 13th batch live session**
AIM:
For a 10-cell series lithium-ion battery model, simulate the thermal effects and compare life cycle performance at various temperatures, and charge & discharge rates using MATLAB.
INTRODUCTION:
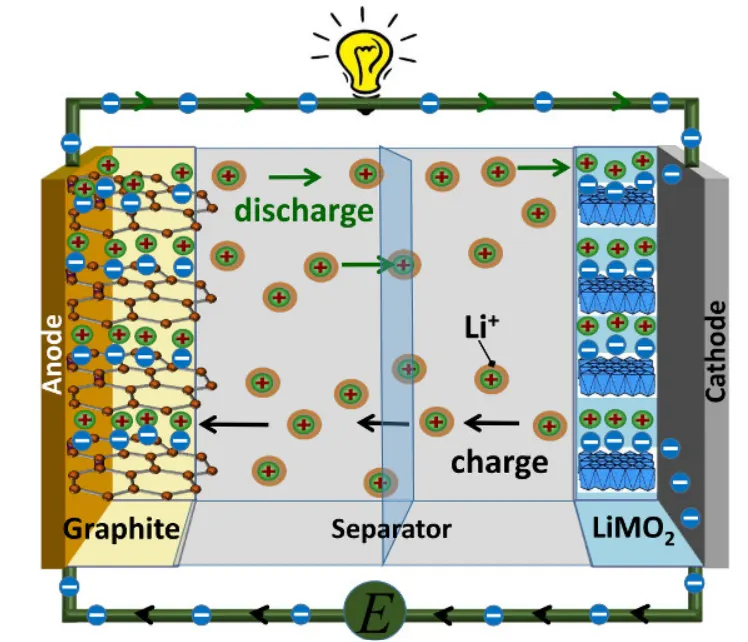
The rechargeable lithium-ion battery is made up of one or more power-generating compartments called cells. Each cell has essentially three components positive electrode, a negative electrode, and an electrolyte.
A positive electrode connects to the battery's positive or + terminal. A negative electrode connects to the negative or − terminal. And a chemical called an electrolyte is in between them.
The positive electrode (Cathode) is typically made from lithium metal oxide. The negative electrode (Anode) is generally made from graphite. The electrolyte varies from one type of battery to another.
During charging,
we connect the charger between the terminals, and the current will flow from the charger to the cathode. The Li metal oxide breaks down into Li-ion and then it travels to combine with the anode to form lithiated carbon and the current and electron flow are opposite.
Cathode:
LiMO2 à Li+ MO2 + e-
Anode:
C6 + Li+ + e- à LiC6 (Lithiated carbon)
Redox reaction:
LiMO2 + C6 à MO2 + LiC6
During Discharging,
i.e when the load is connected, at the anode the lithiated carbon will break down into Lithium ions, and then it combines with the cathode to form Lithium metal oxide.
Anode:
LiC6 à C6 + Li+ + e-
Cathode
MO2 + Li+ + e- à LiMO2
BASIC BLOCKS TO DESIGN THE REQUIRED MODEL IN MATLAB:
1. Battery:
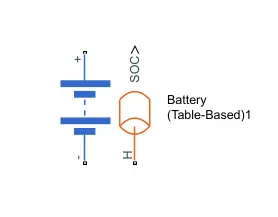
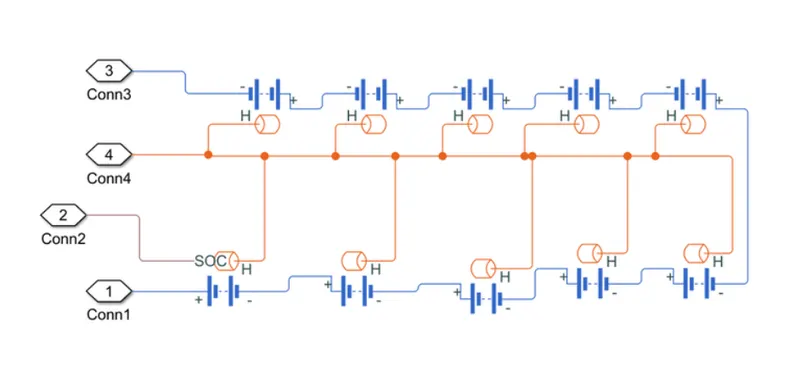
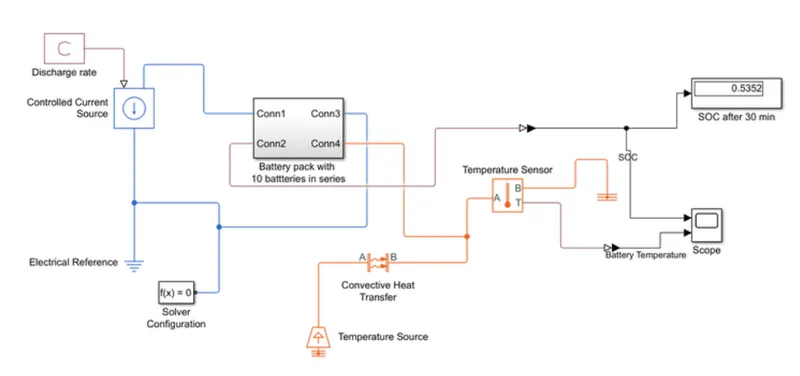
The battery used here is a tabulated battery having a maximum capacity of 4.2Ah. The instrumented show thermal port option for the battery is selected in the simscape toolbar. The initial temperature of the battery is 298.15k
which is room temperature. The initial SOC is given as 100%. There are a total of 10 batteries are connected in series
2. Controlled current source:
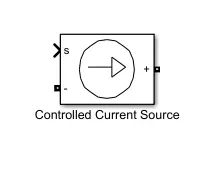
This block is used to drain the battery. The battery is constantly drained at different discharge rates for a time of 30 mins to observe the temperature and performance of the battery.
3. Temperature source:
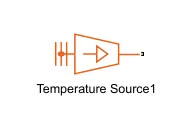
This block is provided to change the temperature of the battery to study the SOC variation at different temperatures of the battery. The temperature is sent to the battery through a convective heat transfer Block.
4. Convective heat transfer block:
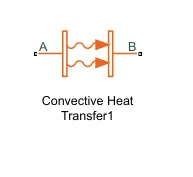
This block helps to transfer heat energy from the temperature source to the battery. The contact surface area is kept at 1 m^2 and the heat transfer coefficient is taken as 100 w/m^2k.
The below model shows the 10 lithium-ion batteries connected in series to evaluate the temperature-dependent performance.
COMBINATION OF ALL BLOCKS;
OBSERVATION:
CASE: 1
At a constant charge current of 4A
In this case, the charge current is given 4A through the simulation and temperature of the battery pack is varied
The below graph shows the Variation of SOC at 29OK temperature. The initial battery pack SOC is assumed to be 0 %
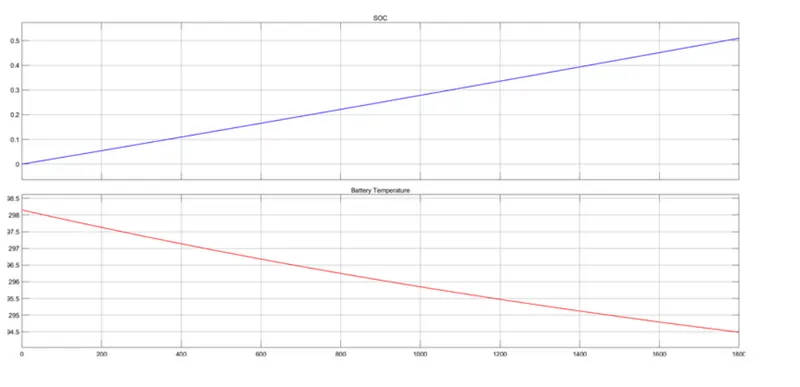
From the above plot;
@ T = 290 K; SOC = 50.9 %
@ T = 300 K; SOC = 48.7 %
@ T = 310 K; SOC = 48.5 %
CASE: 2
At a constant charge current of 2A
In this case, the charge current is given 2A through the simulation and the temperature of the battery pack is varied
The below graph shows the Variation of SOC at 29OK temperature. The initial battery pack SOC is assumed to be 0 %
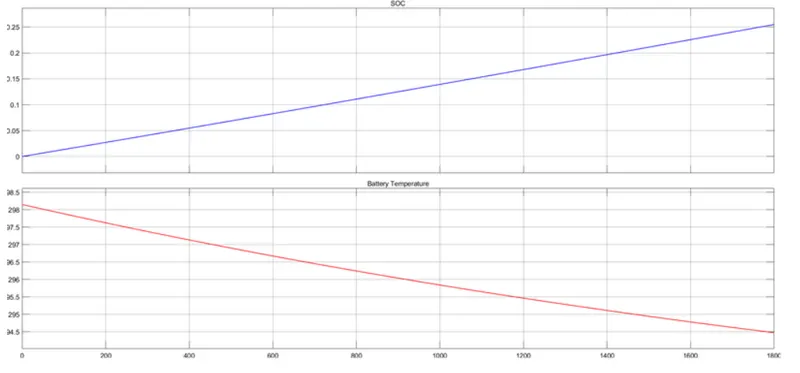
From the above plot;
@ T = 290 K; SOC = 25.5 %
@ T = 300 K; SOC = 24.3 %
@ T = 310 K; SOC = 24.2 %
CASE: 3
At constant discharge current of 4A
In this case the charge discurrent is given 4A through the simulation and the temperature of the battery pack is varied
The below graph shows the Variation of SOC at 29OK temperature. The initial battery pack SOC is assumed to be 0 %
From the above plot;
@ T = 290 K; SOC = 53.5 %
@ T = 300 K; SOC = 51.18 %
@ T = 310 K; SOC = 50.9 %
CASE: 4
At constant discharge current of 2A
In this case the charge discurrent is given 2A through the simulation and the temperature of the battery pack is varied
The below graph shows the Variation of SOC at 29OK temperature. The initial battery pack SOC is assumed to be 0 %
From the above plot;
@ T = 290 K; SOC = 79 %
@ T = 300 K; SOC = 75.5 %
@ T = 310 K; SOC = 75.22 %
CONCLUSION:
From the above observation it is clear that the temperature of the battery pack plays a very importat role in deciding the performance of the battery.