Thermal modeling of battery pack
Aim :- For a 10 cell series lithium ion battery model, simulate the thermal effects and compare life cycle performance at various temperatures, charge & discharge rates using MATLAB.
Theory :-
Working of lithium ion battery :-
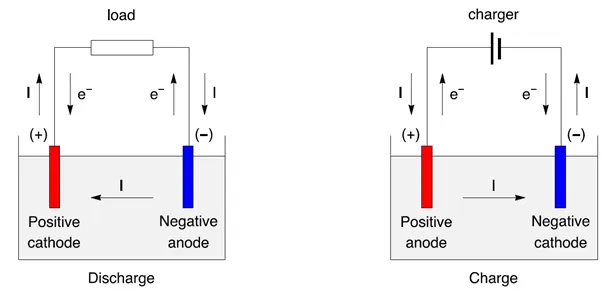
A battery is made up of an anode, cathode, separator, electrolyte, and two current collectors (positive and negative). The anode and cathode store the lithium. The electrolyte carries positively charged lithium ions from the anode to the cathode and vice versa through the separator. The movement of the lithium ions creates free electrons in the anode which creates a charge at the positive current collector. The electrical current then flows from the current collector through a device being powered (cell phone, computer, etc.) to the negative current collector. The separator blocks the flow of electrons inside the battery.
While the battery is discharging and providing an electric current, the anode releases lithium ions to the cathode, generating a flow of electrons from one side to the other. When plugging in the device, the opposite happens: Lithium ions are released by the cathode and received by the anode.
Model :-
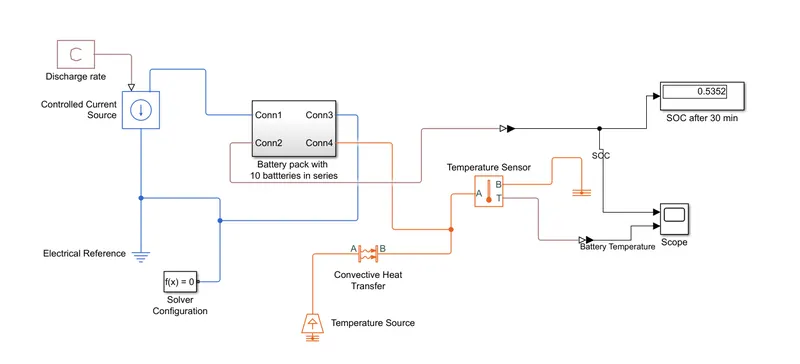
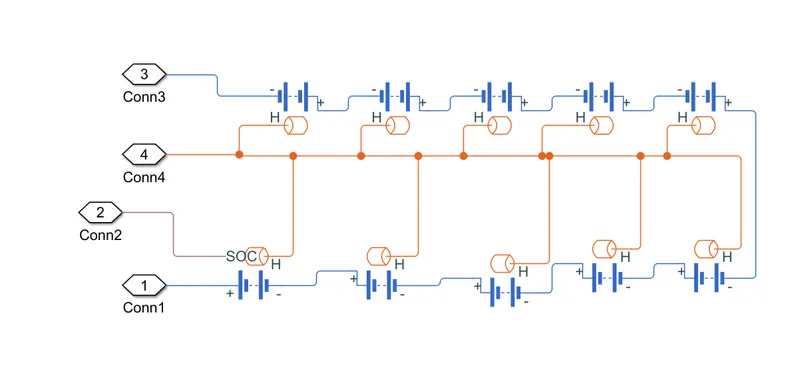
1. Battery :- The battery used here is tabulated battery having maximuim capacity of 4.2 Ah. The instrumented, show thermal port option for battery is selected in simscape tool bar. The initial temperature of battery is 298.15k which is room temperature. The initial SOC is given as 100%. There are a total of 10 batteries are connected in series.
2. Controlled current source :- This block is used to drain the battery. The battery is constantly drained at different discharge rates for a time of 30 mins to observe the temperature and performance of the battery.
3. Temperature source :- This block is provided to change the temperature the battery to study the SOC variation at different temperatures of the battery. The temperature is sent to battery through convective heat transfer Block.
4. Convective heat transfer block :- This block helps to transfer heat energy from temperature source to battery. The contact surface area is kept 1 m^2 and heat transfer coefficient is taken as 100 w/m^2k.
The below model shows the 10 lithium ion batteries connected in series to evaluate the temperature dependent performance.
The battery pack is modeled in a subsystem with 10 cells in series.
Simulation :- The simulation is run 4 different cases. The simulation is run for 30 mins for each case by changing charge, discharge current and temperature of battery pack. The SOC determines the performance of the battery pack under different temperatures.
Case 1 :- At constant discharge current of 2A
In this case the discharge current is 2A throught the simulation and temperature of the battery pack is varied. The below graph shows the Variation of SOC at 290K temperature.
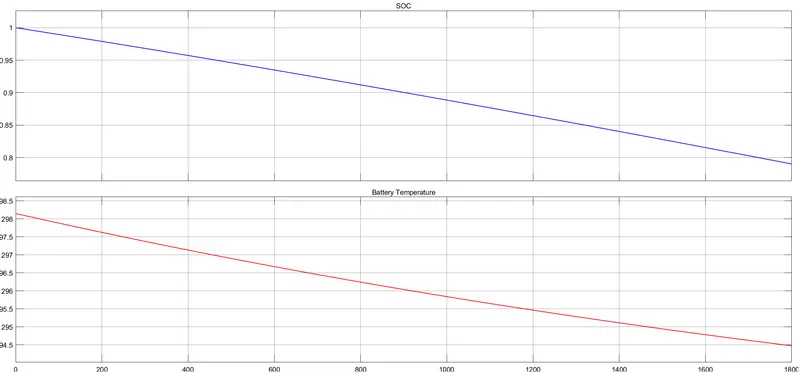
The table below shows different SOC levels after 30 mins for different battery pack temperature for a discharge current of 2A.
| Temperature in Kelvin | SOC in % |
| 290 | 79 |
| 300 | 75.5 |
| 310 | 75.22 |
Case 2 :- At constant discharge current of 4A
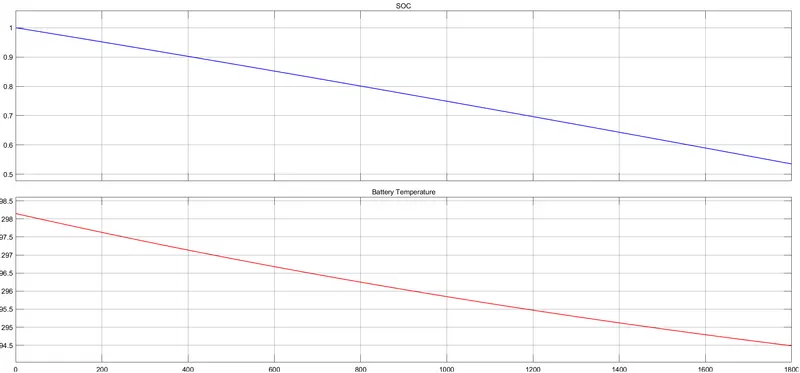
In this case the discharge current is 4A throught the simulation and temperature of the battery pack is varied. The below graph shows the Variation of SOC at 290K temperature.
The table below shows different SOC levels after 30 mins for different battery pack temperature for a discharge current of 4A.
| Temperature in Kelvin | SOC in % |
| 290 | 53.5 |
| 300 | 51.18 |
| 310 | 50.9 |
Case 3 :- At constant Charge current of 2A
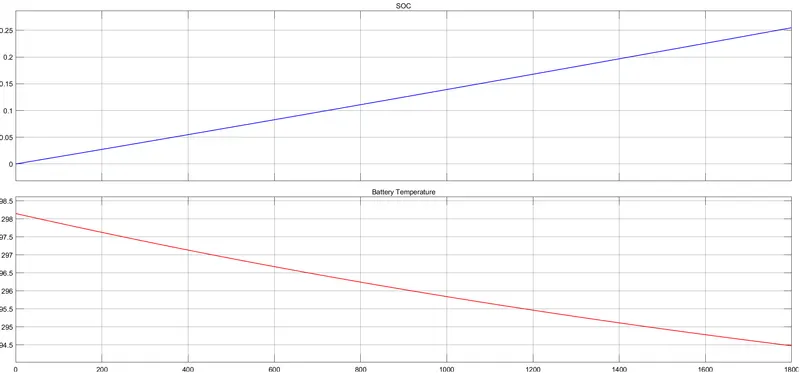
In this case the Charge current given is 2A throught the simulation and temperature of the battery pack is varied. The below graph shows the Variation of SOC at 290K temperature. The initial battery pack soc is assumed to be 0%.
The table below shows different SOC levels after 30 mins for different battery pack temperature for a charge current of 2A.
| Temperature in Kelvin | SOC in % |
| 290 | 25.5 |
| 300 | 24.3 |
| 310 | 24.2 |
Case 4 :- At constant Charge current of 4A
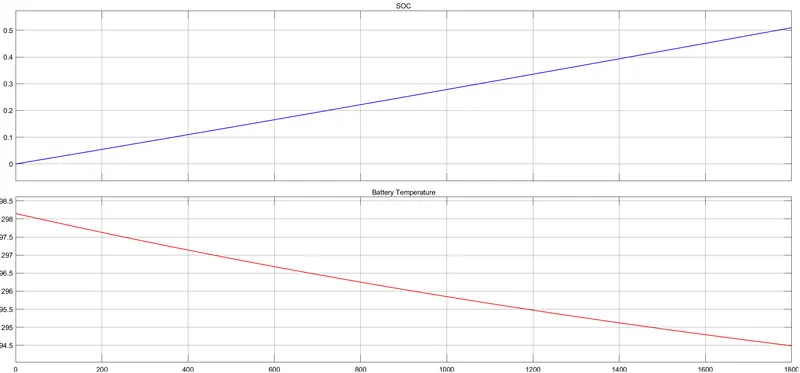
In this case the Charge current given is 4A throught the simulation and temperature of the battery pack is varied. The below graph shows the Variation of SOC at 290K temperature. The initial battery pack soc is assumed to be 0%.
The table below shows different SOC levels after 30 mins for different battery pack temperature for a charge current of 4A.
| Temperature in Kelvin | SOC in % |
| 290 | 50.9 |
| 300 | 48.7 |
| 310 | 48.5 |
Results :-
Hence from the above simulation cases, the thermal modeling of battery pack is done and variation of battery performance is studied under different temperatures, charge and discharge currents. It is observed that the temperature of the battery pack played a major in deciding the performance of the battery.