Project 2 Thermal modeling of battery pack
For a 10 cell series lithium ion battery model, simulate the thermal effects and compare life cycle performance at various temperatures, charge & discharge rates using MATLAB.
Answer:
Case 1 (Battery with the fault):
A built in matlab model “Lithium-ion battery pack with fault” is shown below:
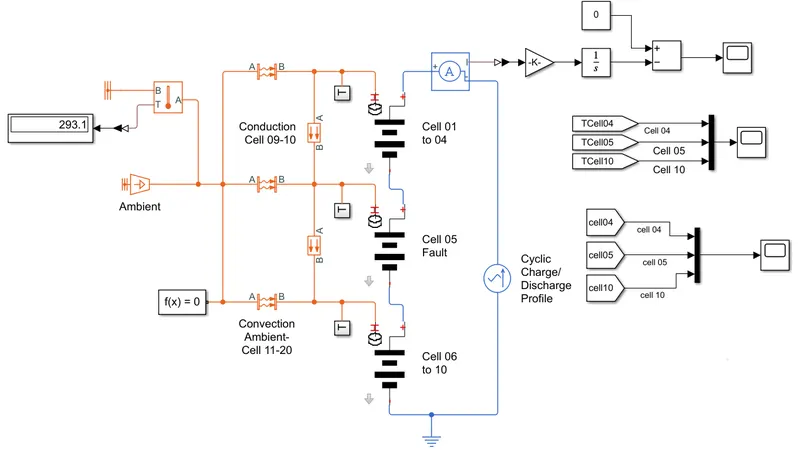
- The above model shows the simulation of battery pack with 10 series connected cells.
- In the above model 10 lithium ion cells are connected in the series.
- The cell number 5 is shown as faulty cell.
- The temperature of the cell 5 is not maintained properly to make cell faulty and this cell will affect the performance of overall battery pack.
- This fault is introduced to see the impact on battery performance and cell temperature.
- This fault is made by changing the parameters of the cell 5, reducing both capacity and open circuit voltage and increasing the resistance values.
- There is a conductive heat transfer between the cells and convective heat transfer in the surrounding environment.
- The figure below shows the parameters of the model in the workspace.
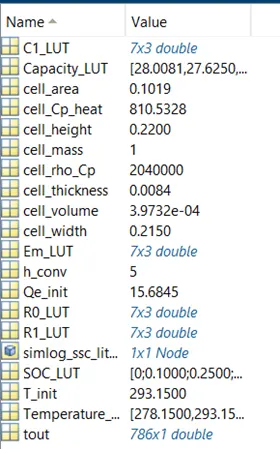
- In the below figure, the data of each cell in the battery pack is shown.
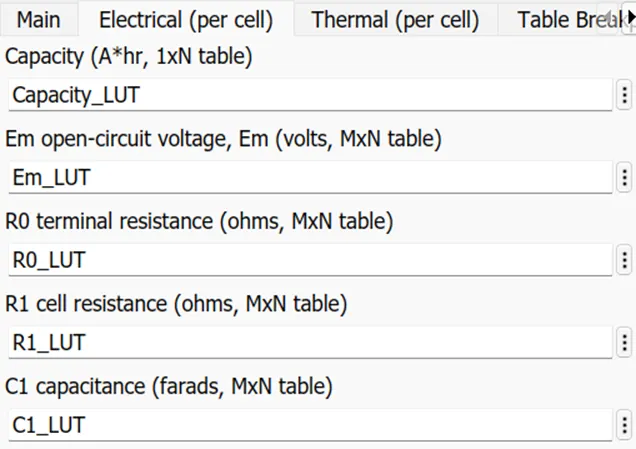
- Every parameter of the cell is defined in the workspace.
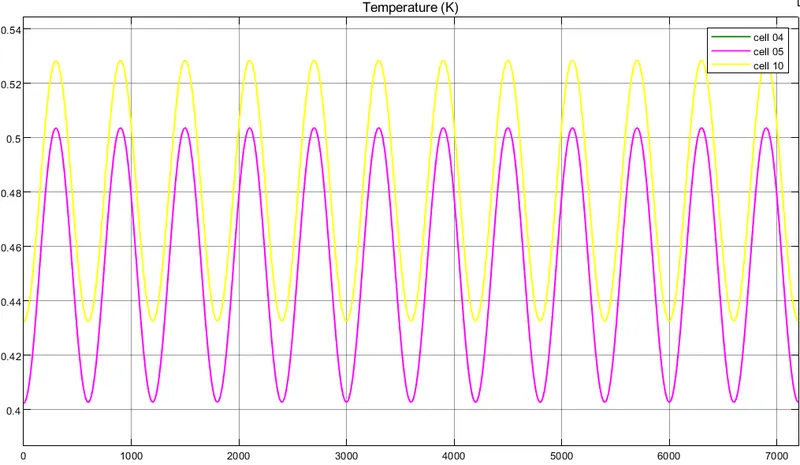
- Below figure shows the temperature graphs for the model.
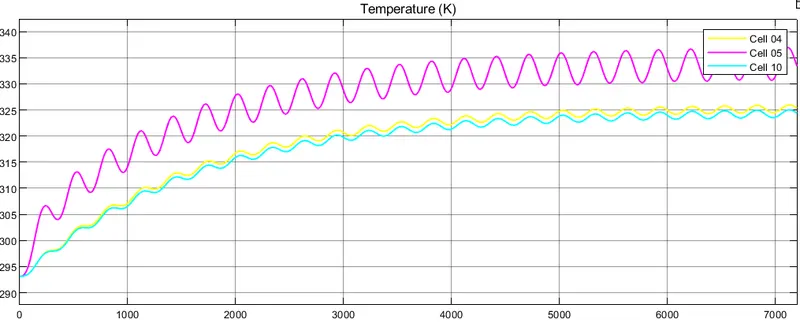
- The cell temperature of the faulty cell 5 is higher than the other cells in series.
- The temperature of the cells from 1-4 and 6-10 are same.
- The above figure shows the SOC of the cells in series.
- The SOC of the cell 1 – 4 and the cells 6 – 10 are the same as their temperatures are equal and they are normal cells.
- The SOC of the faulty cell 5 is lower than the other cell as there is a fault in the cell and its temperature is higher than the other cells.
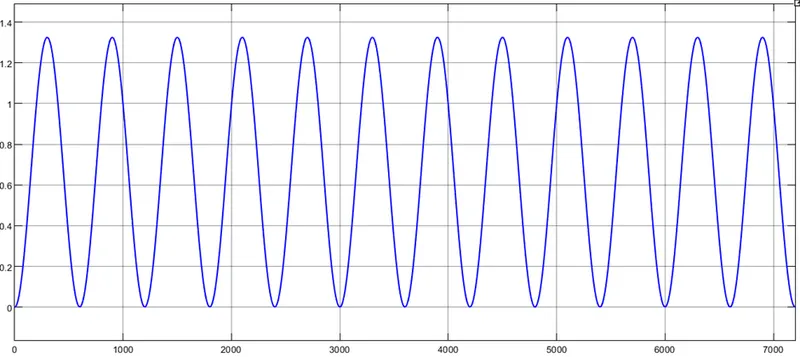
- The above figure shows the SOC of entire battery pack.
Simulink Model of a 10 Lithium-ion cells in series battery model:
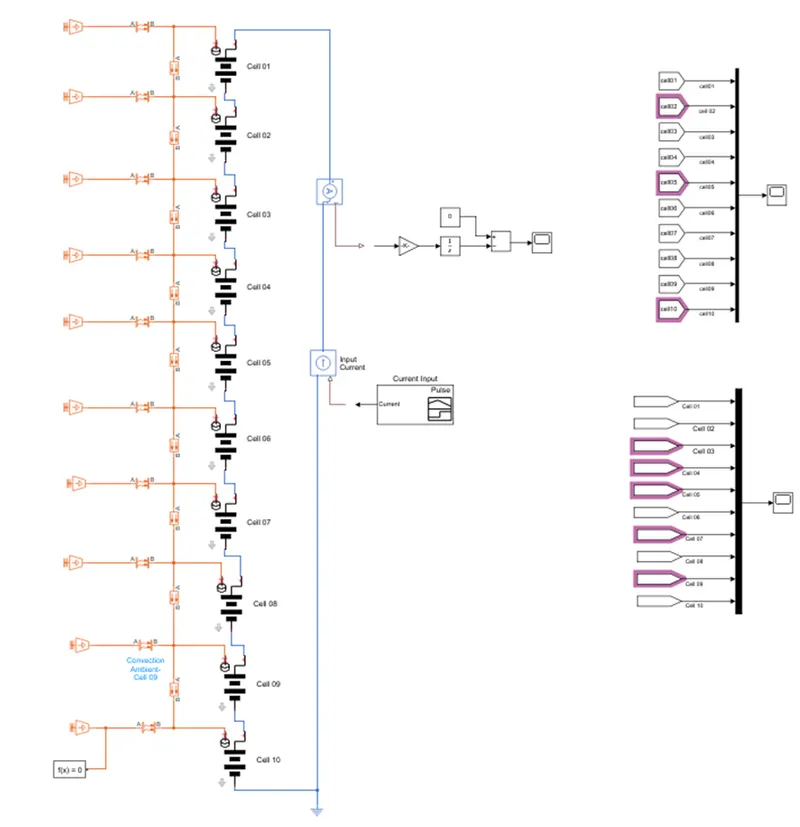
- Lithium-ion battery pack with fault is modified into the above model.
- In this model 10 lithium-ion cells are connected in series.
- The fault in the model is removed.
- The cyclic charge-discharge current source is replaced by controlled current source.
- The input to the current source is the signal builder block in the values of current are given.
- The complete SOC of the battery pack is measured.
- This battery model is tested for various temperatures of the cells and the charge and discharged rates.
- The SOC of each cell is measured and how SOC change for different temperature is measured.
Cell Subsystem:
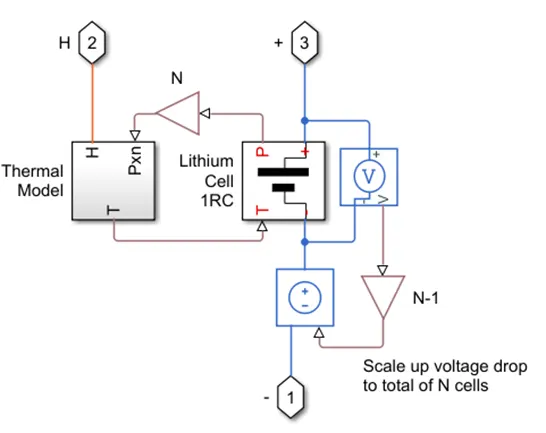
- A cell subsystem consists of a thermal model and lithium cell RC block which calculate the temperature and the thermal effect for cells and overall calculate for the battery pack.
- The blocks inside the subsystem are PS gain block which multiplies the input physical signal by a constant i.e. y = u*gain. Another block are voltage sensor and controlled voltage source.
- The voltage sensor block represents an ideal voltage sensor that is a device that converts voltage measured between any electrical connections into a physical signal proportional to the voltage.
- The controlled voltage source represents an ideal voltage source that is power enough to maintain the specified voltage at its output regardless of the current passing through it. The output voltage is V = Vs, where Vs is the numerical value presented at the physical signal port.
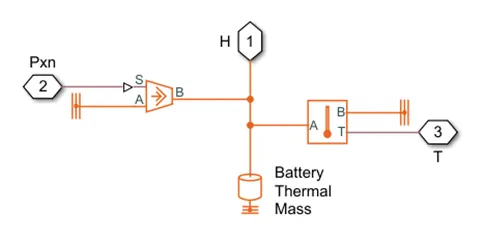
Thermal model Subsystem:
The important blocks inside the thermal model subsystem are:
- Thermal reference: This block represents a reference point in a thermal network where the temperature is equal to absolute zero.
- Controlled Heat Flow Rate Source: This block represents an ideal energy source in a thermal network that can maintained a controlled heat flow rate regardless of the temperature difference. The heat flow rate is set by the physical signal port S. A positive heat flow rate flows from port A to port B.
- Thermal mass: This blocks models internal energy storage in a thermal network. The rate of temperature increase in proportion to the heat flow rate into the material and inversely proportional to the mass and specific heat of the material.
- Temperature sensor: This block measures the temperature in a thermal network. There is no heat flow through the sensor. The physical signal port T reports the temperature difference across the sensor. The measurement is positive when the temperature at port A is greater than the temperature port B.
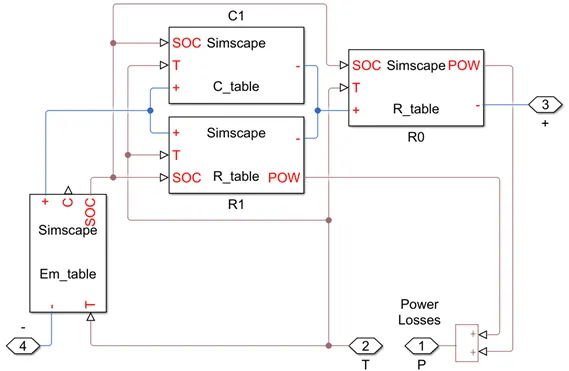
Lithium Cell 1RC Subsystem:
- This block basically consists of capacitance value C block which depends o an external physical signal inputs SOC and T. It is assumed that the capacitance value is slowly varying with time, and hence the equation I = C*dv/dt holds.
- Resistance value (R) block depends on an external physical signal inputs SOC and T.
- Voltage value (EM) which implement the cell main branch voltage source and determine values for capacity (C) and state of charge (SOC). The defining equations depend on cell temperature T.
Case 2 (Temperature of all the cell is same):
- In this case, the ambient temperature is 293.1 K and the temperature of all the cells are 293.1 K.
- The input current for charging and discharging modes varying in the manner as shown below.
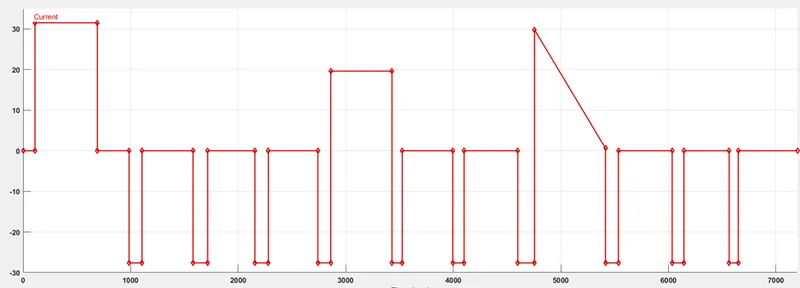
- In the above figure the positive waveform shows the charging of the battery and the negative waveform shows the discharging of the battery.
- When the waveform is zero it shows the battery is at rest.
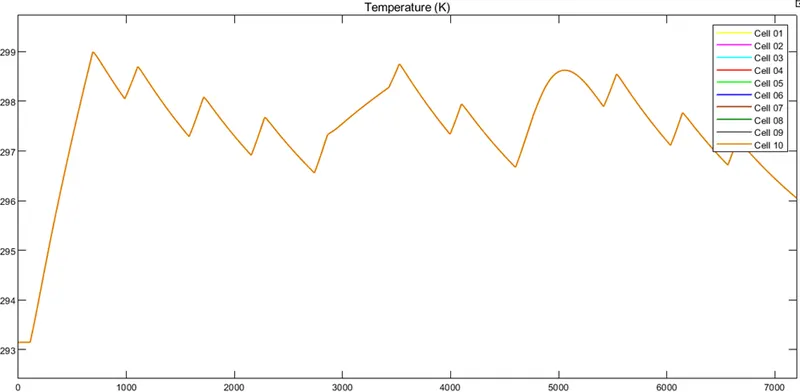
- The above graph shows the temperature of all the cells.
- As the temperature is same for all the cells, so the graph is similar for all the cells.
- During the charging mode the temperature is increases.
- During the rest period of the battery, the temperature is decrease.
- And during the discharging mode also temperature of the cell in increase.
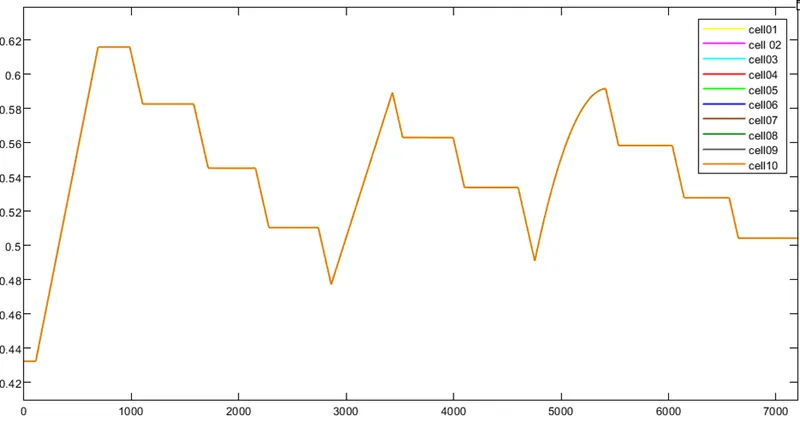
- The above graph shows the SOC of each cell and it is same for all the cell as their temperatures and the characteristics are same.
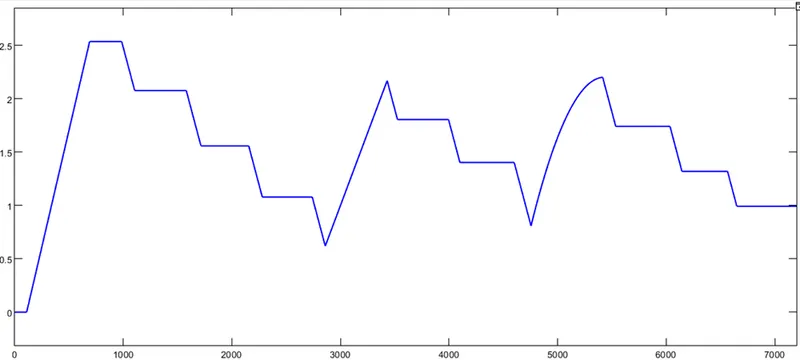
- The above graph shows the SOC of the battery pack.
- It is seen that the SOC is increased during the charging of the battery and decreased during the discharging of the battery.
- The SOC is constant when the battery is at rest.
Case 3 (Temperature of all the cells are different):
- In this case the ambient temperature is same but the temperature of each cell is now increased to see the temperature effect on each cell.
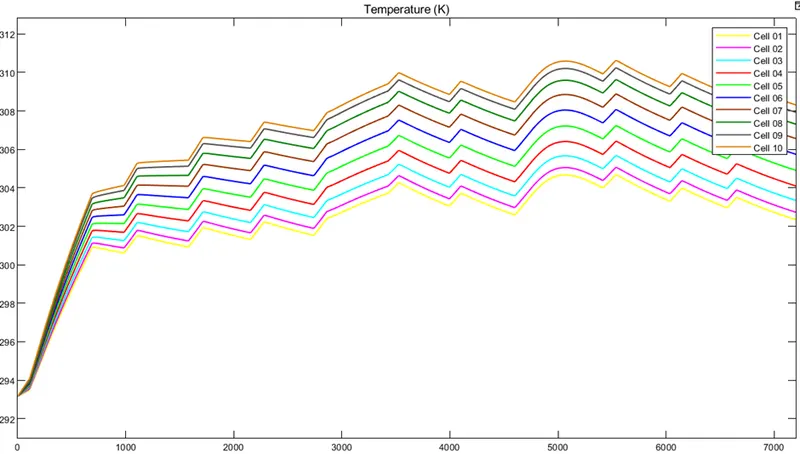
- In the above figure the temperature of each cell starts increasing from the ambient temperature.
- The temperatures are increasing as per the current drawn from the battery.
- The cell number 10 has the highest temperature and the cell number 1 has the lowest temperature of all the cells.
- The nature of graph for all the cells are same.
SOC of single cell:
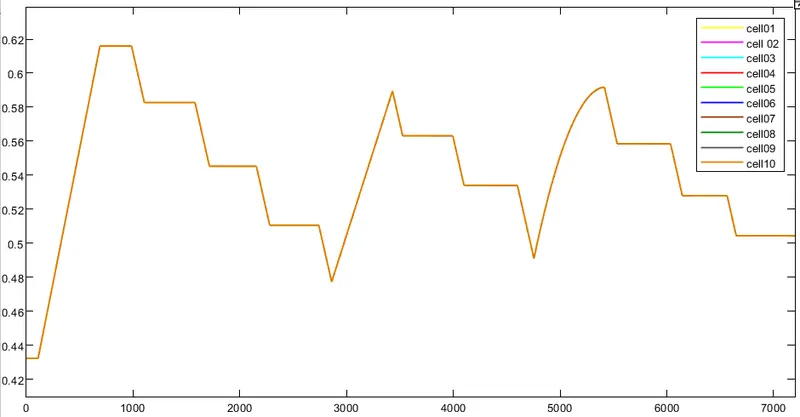
- As seen from the above graph the SOC of each cells are same but there is slight difference in SOC that can be seen when we zoom the graph.
SOC during the charging of the battery:
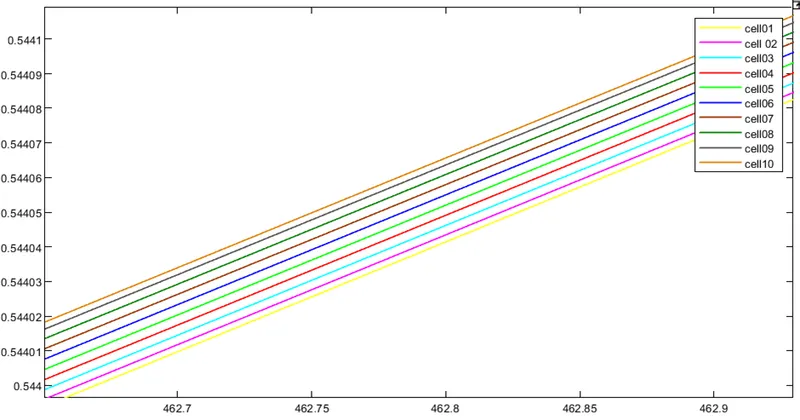
- The above graph shows the SOC of each cell when we zoom the graph.
- As seen during the charging of the battery the SOC of the cell 10 is higher.
- The cell 10 has higher temperature and draws more current than other cells therefore it charges earlier as compared to other cells.
- The cell 1 has the lowest SOC of all the cells as it has the lowest temperature.
SOC when the battery is at rest:
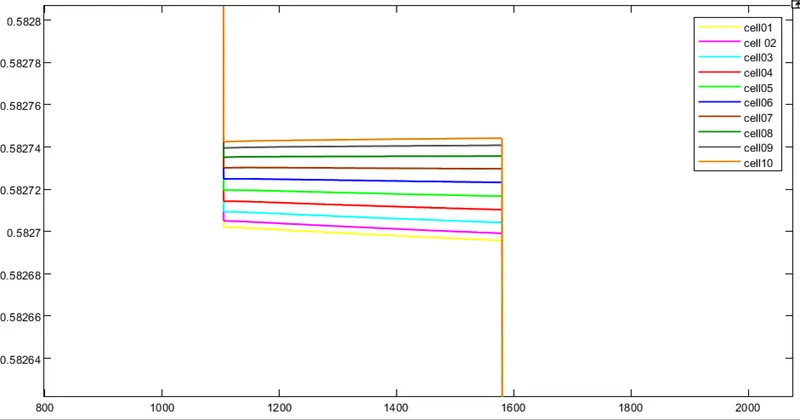
- The above graph shows the SOC of each cell when the battery is at rest.
- The SOC of the cell 10 is higher and cell 1 has lowest SOC.
SOC during discharging of the battery:
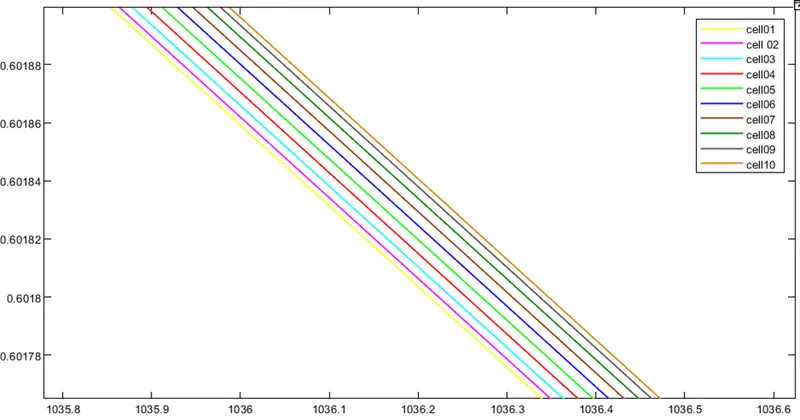
- During the discharging of the battery also the cell having the higher temperature discharges fast.
- And the cell with lower temperature discharges slowly.
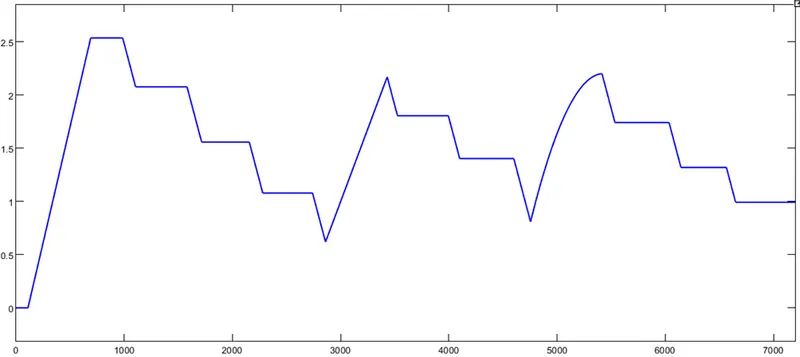
- The above graph shows the entire SOC of the battery pack and it is nearly same for both the cases of same and different temperature.
- There is a slight difference in the SOC of each sell therefore SOC of the battery pack is same as case 2.
Conclusion:
- In case 1 as there is a fault, the SOC of each cell is clearly visible and SOC of the faulty cell is lower.
- The SOC of the entire battery pack is less as there is a fault.
- In the case 2, the temperature of each cell is same and SOC of each cell is also same.
- In case 3, as each cell has the different temperature, then the SOC is also different for each and has slight difference.
- The cell with the higher temperature has the highest charging and the discharging rate.
- And the cell with the lowest temperature has the lowest charging and the discharging rate.
- The cell with higher temperature has the higher SOC and the cell with the lower temperature has the lowest SOC.
- The SOC is lowest in case of fault.